What Is Operational Efficiency? Formula, Examples & Steps

Operational efficiency compares what you spend to deliver work and run the business with the revenue that work earns.
To help you use this metric, we’ll give you the calculation formula, four hour-based metrics, a diagnosis table, and five steps to improve operational efficiency.
Each part uses one worked example: a 20-person firm whose utilization rose while its profit fell.
Key Takeaways
- Operational efficiency is calculated as cost of delivery plus operating expenses, divided by revenue, times 100; lower is better.
- The ratio and operating margin add up to 100%, so a ratio of 87.5% leaves 12.5% as operating profit.
- Operational efficiency can fall while utilization rises, when the extra hours are delivered but never billed.
- Billable utilization, overservicing rate, non-billable share, and effective hourly rate show why the ratio moved.
What Is Operational Efficiency?
Operational efficiency is the share of revenue a firm spends to deliver its work and run its business operations. It is a ratio: a firm at 85% spends 85 cents of each revenue dollar to deliver and operate.
Some owners call it business efficiency, and the measure is the same.
In a professional services firm, people’s hours are the largest cost, so operational efficiency is mostly labor efficiency. Cost covers salaries, contractors, and overhead, and revenue is the fees clients pay, hourly or fixed.
The efficiency of operations shows in how many paid hours turn into billed work.
You lower the ratio two ways: spend less, or bill more of the hours you already pay for. Spending less is a cost decision, so check how cost efficiency differs from cost effectiveness before you cut.
Billing more depends on your business processes, which decide where unbilled hours go: estimating, handoffs, approvals, and internal meetings.
Productivity counts output; operational efficiency counts what each unit of output costs. You can raise productivity by delivering more hours and still lose operational efficiency when the extra hours go unbilled.
Your accounts never label those unbilled hours as waste, so productivity alone will not reveal them.
How Do You Measure Operational Efficiency?
You measure operational efficiency with the operational efficiency ratio: cost of delivery plus operating expenses, divided by revenue. Accountants call the same number the operating ratio.
Operating ratio = (cost of delivery + operating expenses) ÷ revenue × 100
- Cost of delivery: the salaries of people who do client work, plus contractors and other direct delivery costs.
- Operating expenses: each operational cost of running the firm, like rent, software, marketing, and finance and human resources salaries.
- Revenue: net sales from your P&L (profit and loss statement), meaning total revenue minus discounts and credits.
Leave cost of delivery out and the ratio tracks overhead only, so unbilled client hours never appear. Use the same period for all three inputs, usually a quarter, because monthly figures swing with invoicing dates.
Calculation Example
An illustrative 20-person professional services firm tracks operational efficiency over two quarters. In Q1, the firm earns $960,000 in revenue, with $600,000 in cost of delivery and $240,000 in operating expenses.
- Total cost: $600,000 + $240,000 = $840,000
- Operating ratio: $840,000 ÷ $960,000 × 100 = 87.5%
In Q2, the firm sells the same hours, so revenue stays at $960,000. Cost of delivery rises to $648,000, including $48,000 of contractors, and operating expenses hold at $240,000.
- Operating ratio: ($648,000 + $240,000) ÷ $960,000 × 100 = 92.5%
Revenue holds flat while operational efficiency falls, because cost rises by exactly the contractor spend.
Productive’s budget and profitability tracking per project prices tracked hours at cost rates, so unbilled time lowers profit.

Get warnings of budgets overruns and leaking revenue.
What Is a Good Operating Ratio?
A good operating ratio is under 85%, and an excellent one is under 80%. Promethean Research’s 2026 agency benchmarks call a 15% to 20% after-tax net margin strong.
They call 20% or more excellent, and anything under 10% a sign of pricing or operating pressure. Those bands track operational performance after tax, so a 15% net margin takes an operating ratio under 85%.
Operating margin, one of the profit margins on your P&L, equals 100% minus the ratio.
At 87.5%, the example firm keeps 12.5 cents of each revenue dollar as operating profit.
After tax, its net margin is lower still, so this quarter does not reach the strong band. At 92.5%, operating profit falls from $120,000 to $72,000, and net margin drops under 10%.
How Do You Set the Right Target for Your Firm?
You set the right target for your firm by adjusting the benchmark for firm size and owner pay. In the same data, agencies under 10 staff averaged a 19% after-tax net margin in 2025.
Agencies with 50 or more staff averaged 8%, since larger firms carry more management and support roles. A 12-person firm has to run a lower ratio than a 60-person one to count as operationally efficient.
- Before you compare, add a market salary for any owner paid through profit, or your ratio looks too good. Skip that step and two firms with the same operational efficiency report different ratios.
- Then judge operational efficiency across your trailing four quarters, meaning the four most recent completed ones. Chart them in whatever business analytics tool you use, even a spreadsheet.
- A rise of two points or more in a single quarter is the signal to diagnose the cause. Four quarters without such a rise show efficient operations. A single good quarter proves less, because one large invoice can flatter it.
Protect Operational Efficiency Before Budgets Overrun
Productive’s budget forecasts compare scheduled and logged hours, so you see a projected overrun before the budget is spent.

Which Metrics Move the Operating Ratio?
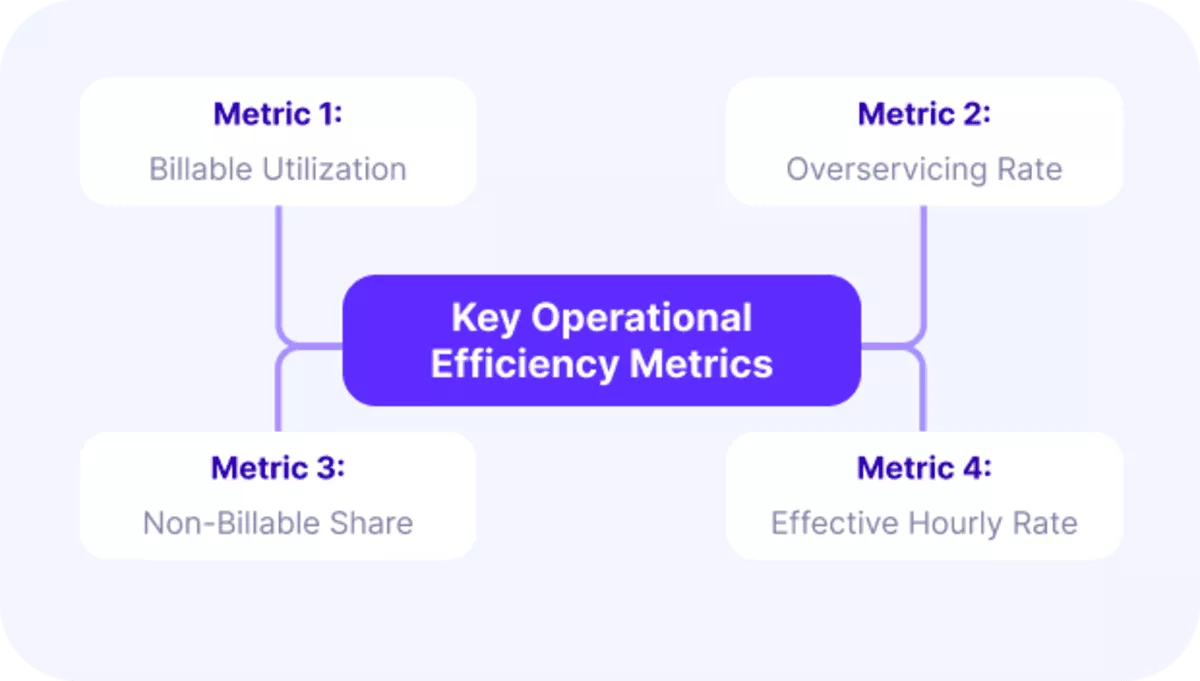
The metrics that move the operating ratio are billable utilization, overservicing rate, non-billable share, and effective hourly rate.
- A manufacturer tracks cost per unit, cycle time, and inventory turnover.
- A firm that sells time tracks these four performance metrics, because hours are its costliest input.
Each of these performance indicators explains a different part of why the example firm’s operational efficiency fell in Q2. All four come from timesheets and project budgets, so they need no business analytics beyond what you already keep.
Metric 1: Billable Utilization
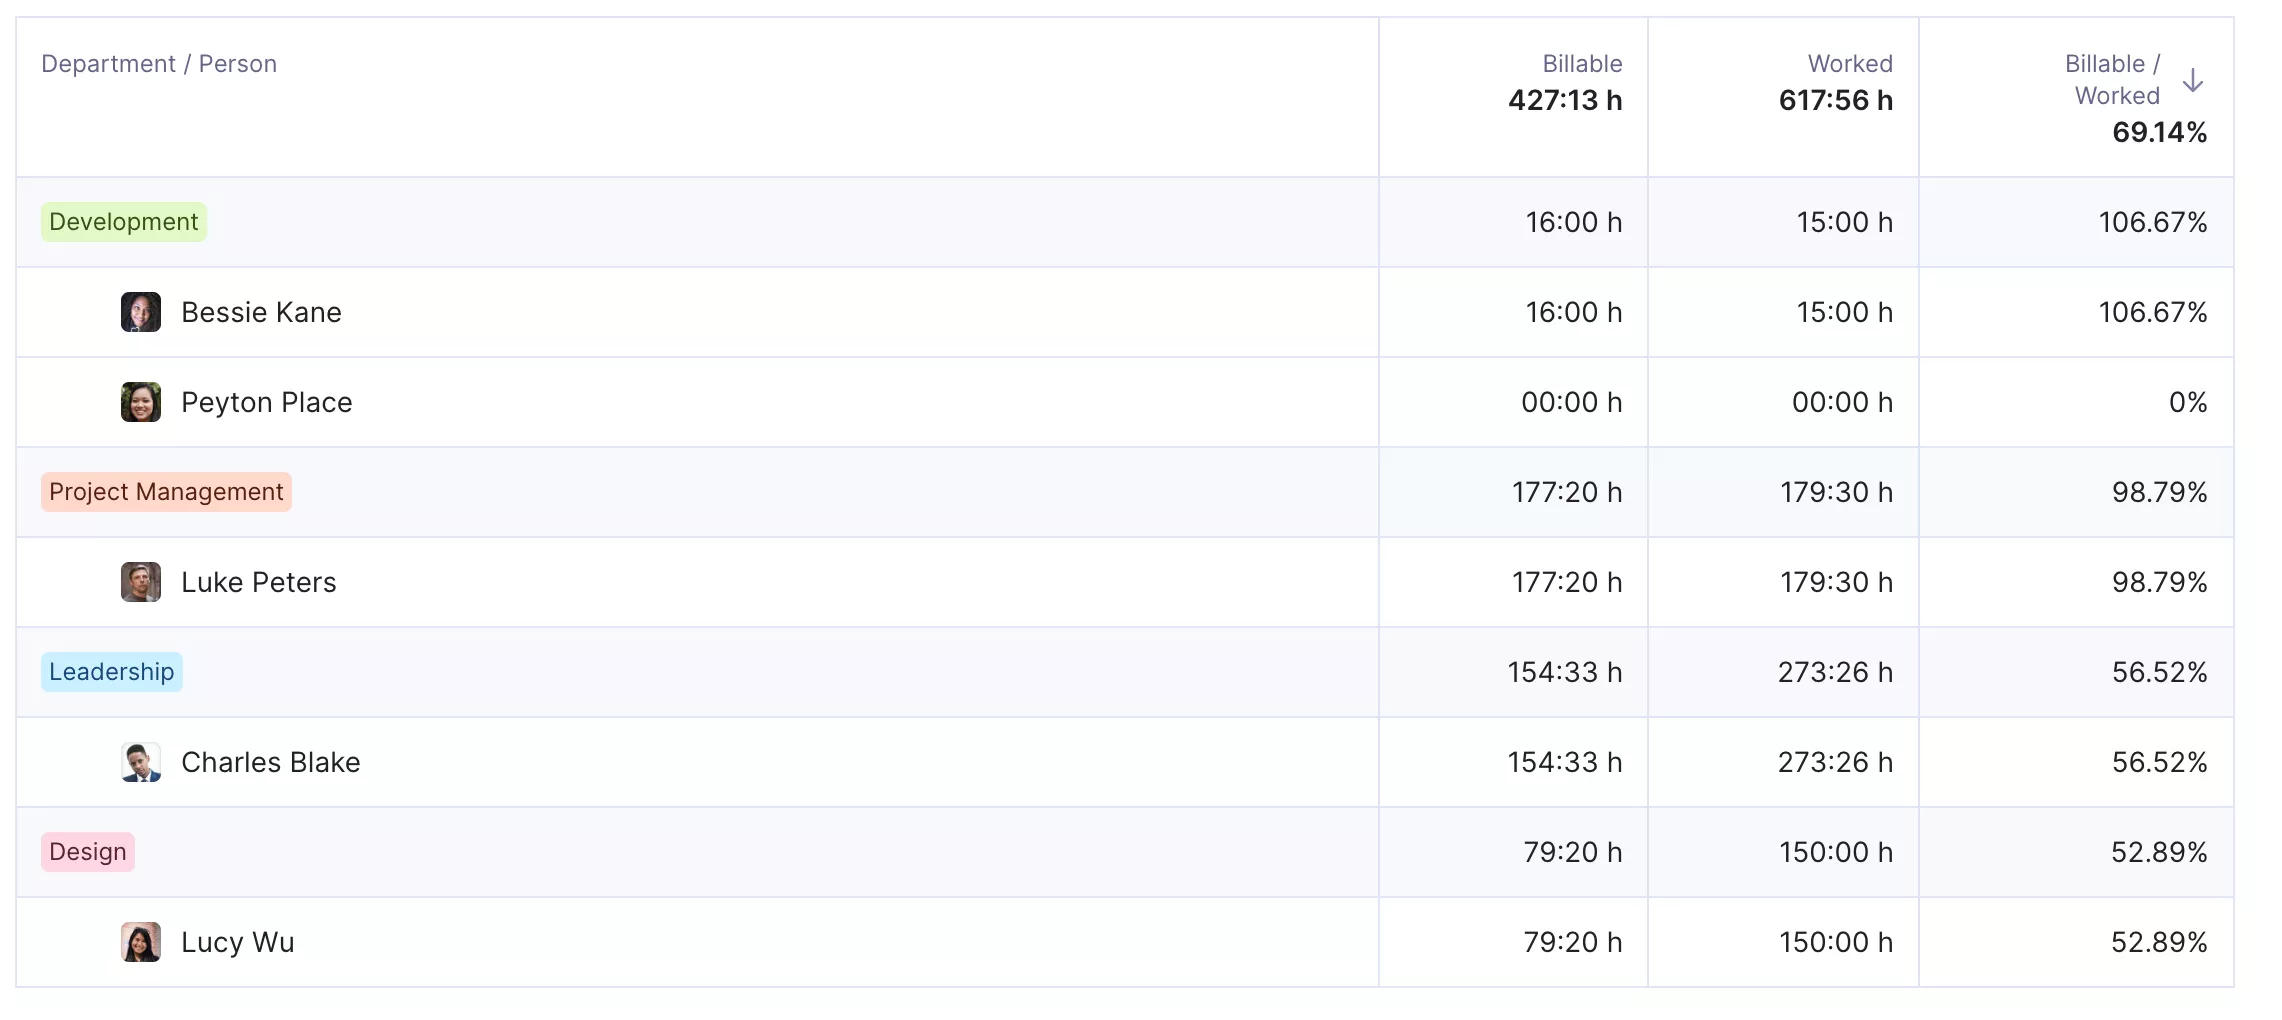
Billable utilization is billable hours divided by available hours. Count every hour logged to client work, and take available hours as contracted hours minus holidays and time off.
It is one of three resource utilization formulas, alongside overall and forecast utilization. Read a full guide to billable utilization for the calculation in more depth.
With 20 people at 480 available hours each, the example firm has 9,600 hours per quarter. In Q1, 6,720 hours of client work gives 70%; in Q2, 7,200 hours gives 75%.
On its own, that rise reads as an operational efficiency gain.
Get real-time utilization reports.
Metric 2: Overservicing Rate
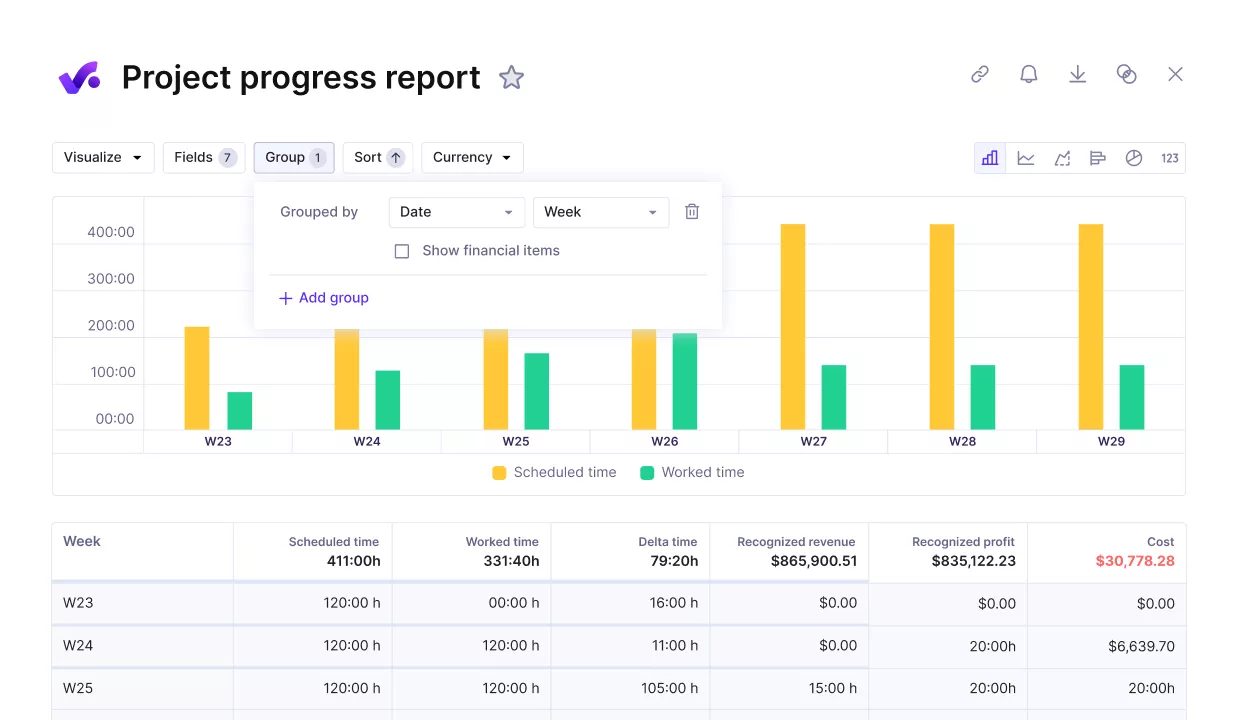
Overservicing rate is hours delivered beyond hours sold, divided by hours sold. Overservicing is client work you deliver but never bill. Tracking the gap between sold and actual time on each project shows where the rate comes from.
Measure progress against key finance metrics.
Sold hours stay at 6,400 in both quarters. In Q1 the firm delivers 6,720, a 5% rate, and in Q2 it delivers 7,680, a 20% rate.
The Q2 total includes 480 contractor hours, and 1,280 of the 7,680 hours go unbilled. This rate explains the Q2 fall in operational efficiency: the firm paid for delivery it never sold.
Metric 3: Non-Billable Share
Non-billable share is non-billable hours divided by all hours logged. Before you calculate it, agree which work counts as non-billable so every team logs time the same way.
Staff log 9,120 hours in each quarter. Non-billable time falls from 2,400 hours in Q1, a 26.3% share, to 1,920 hours in Q2, a 21.1% share. That drop looks good for operational efficiency, but the 480 freed hours go into unbilled client work.
Metric 4: Effective Hourly Rate
Effective hourly rate is revenue divided by all hours delivered on client work. The example firm sells its time at $150 an hour. Compare it with your rate card, the hourly price list by role, every quarter. Discounts and overservicing both pull it down.
In Q1, $960,000 over 6,720 hours gives $142.86; in Q2, $960,000 over 7,680 hours gives $125. The firm now earns $25 less per delivered hour than its sold rate, the cost of lost operational efficiency.
How Do You Diagnose a Rising Operating Ratio?
You diagnose a rising operating ratio by checking which moved with it: utilization, overservicing, non-billable share, or effective rate. Read the four together, because one metric alone misreads operational efficiency: utilization rose in the example firm’s worst quarter.
| What moved with the ratio | Cause of operational inefficiency | First fix |
|---|---|---|
| Utilization up, overservicing up | Estimates and scope drift in project management | Rebuild estimates from closed projects and warn at 80% of budget |
| Utilization down, contractor spend up | Resource allocation not matched to capacity, which creates bottlenecks | Check matching staff bookings before approving any contractor |
| Non-billable share up | Internal work growing faster than client work | Cap the largest non-billable category |
| Effective rate down, overservicing flat | Pricing or discounting | Compare invoiced rates with the rate card on the last 10 invoices |
| Admin time up inside non-billable work | Manual business processes with no automation | Process mapping, then automating repetitive tasks |
The example firm’s Q2 fits the scope pattern, so fixing estimates can restore its operational efficiency without cutting staff.
How to Improve Operational Efficiency
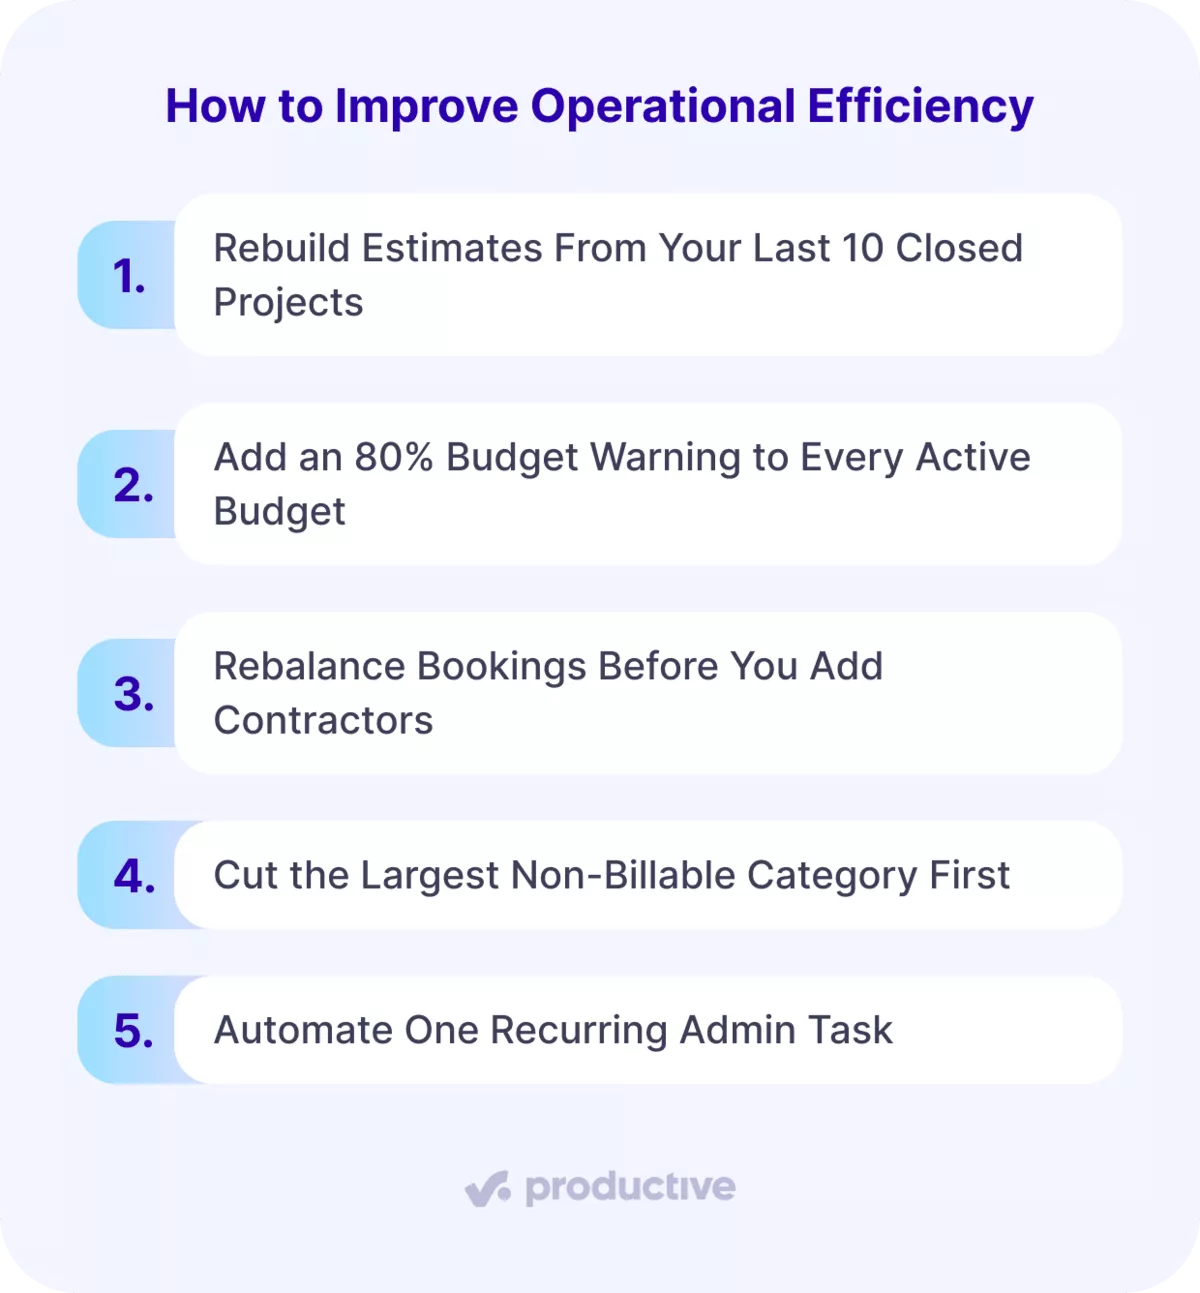
You improve operational efficiency by rebuilding estimates, adding budget warnings, rebalancing bookings, cutting non-billable time, and automating admin. Each step targets one of the four metrics, so you know which change moved operational efficiency.
Treat every threshold as a starting rule you adjust to your own data.
Step 1: Rebuild Estimates From Your Last 10 Closed Projects
- Open the estimates and timesheets for your last 10 closed projects of one type, such as software migrations.
- Calculate the overservicing rate for each project, then take the median of the 10.
- Add that median to your next estimate of the same type, or cut the scope item that overran most.
List every active budget in your project management tool, and set a warning at 80% of estimated hours. Budget burn is the share of estimated hours already used. When it hits 80%, the project lead reviews remaining scope with the client and logs the date.
A client told at 80% can approve extra hours, while a surprise at the invoice hurts customer satisfaction. Every hour caught at 80% can be sold before it is delivered, so it never lowers operational efficiency. Count it done when no budget reaches 100% without a logged scope conversation.
Productive’s time warnings email the budget owner once billable time reaches a set share of estimated hours.
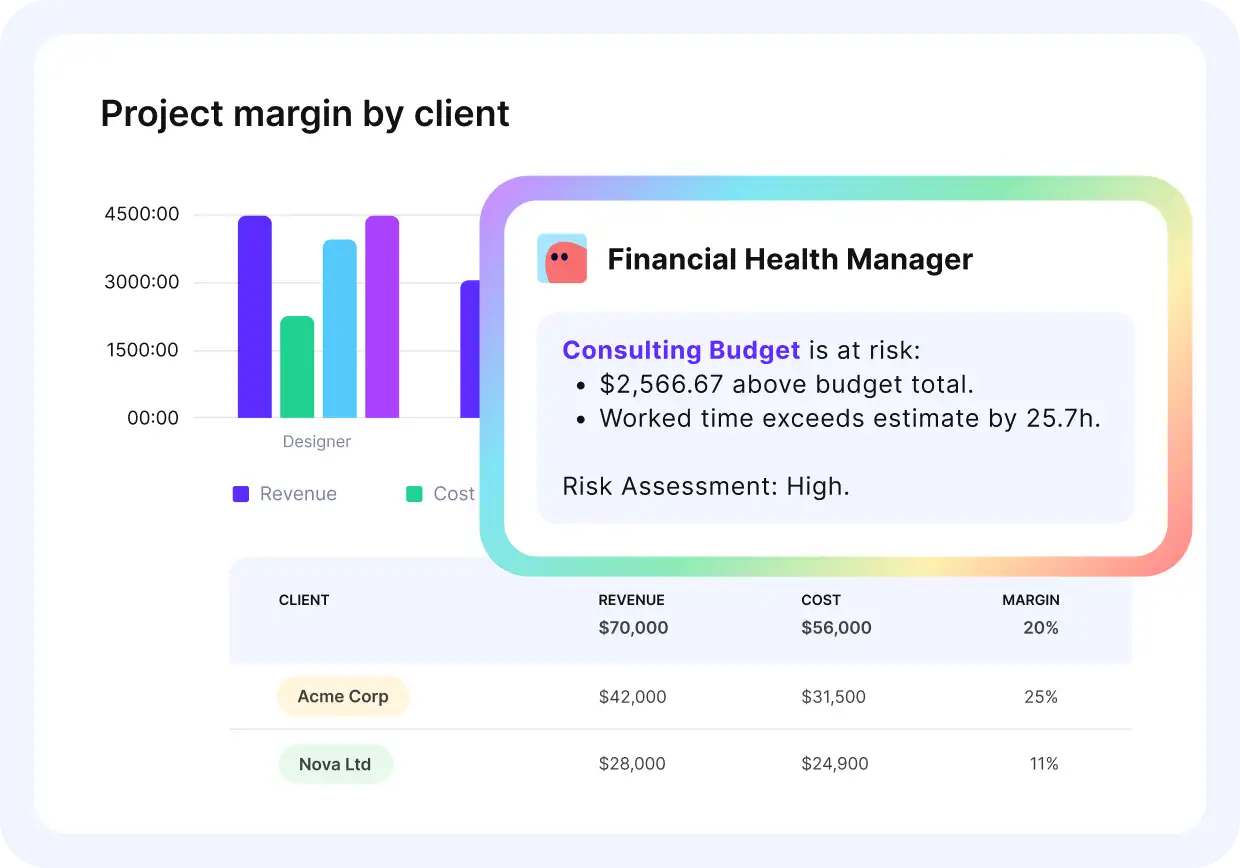
Ask for finance updates in plain language, get instant answers.
Step 3: Rebalance Bookings Before You Add Contractors
Pull up your resource schedule and bookings for the next eight weeks before anyone approves a contractor. This eight-week look-ahead is capacity planning in its simplest form: bookings against the hours each person has.
Check whether anyone with the same skill is booked under 70% in the same weeks. If someone is, move the work to them and skip the contractor.
A contractor hired while a matching employee is booked under 70% signals a resource allocation problem. The bottlenecks remain, and the firm pays for one more person.
Productive’s resource planning with booked and available time shows each person’s booked hours as a percentage of capacity.
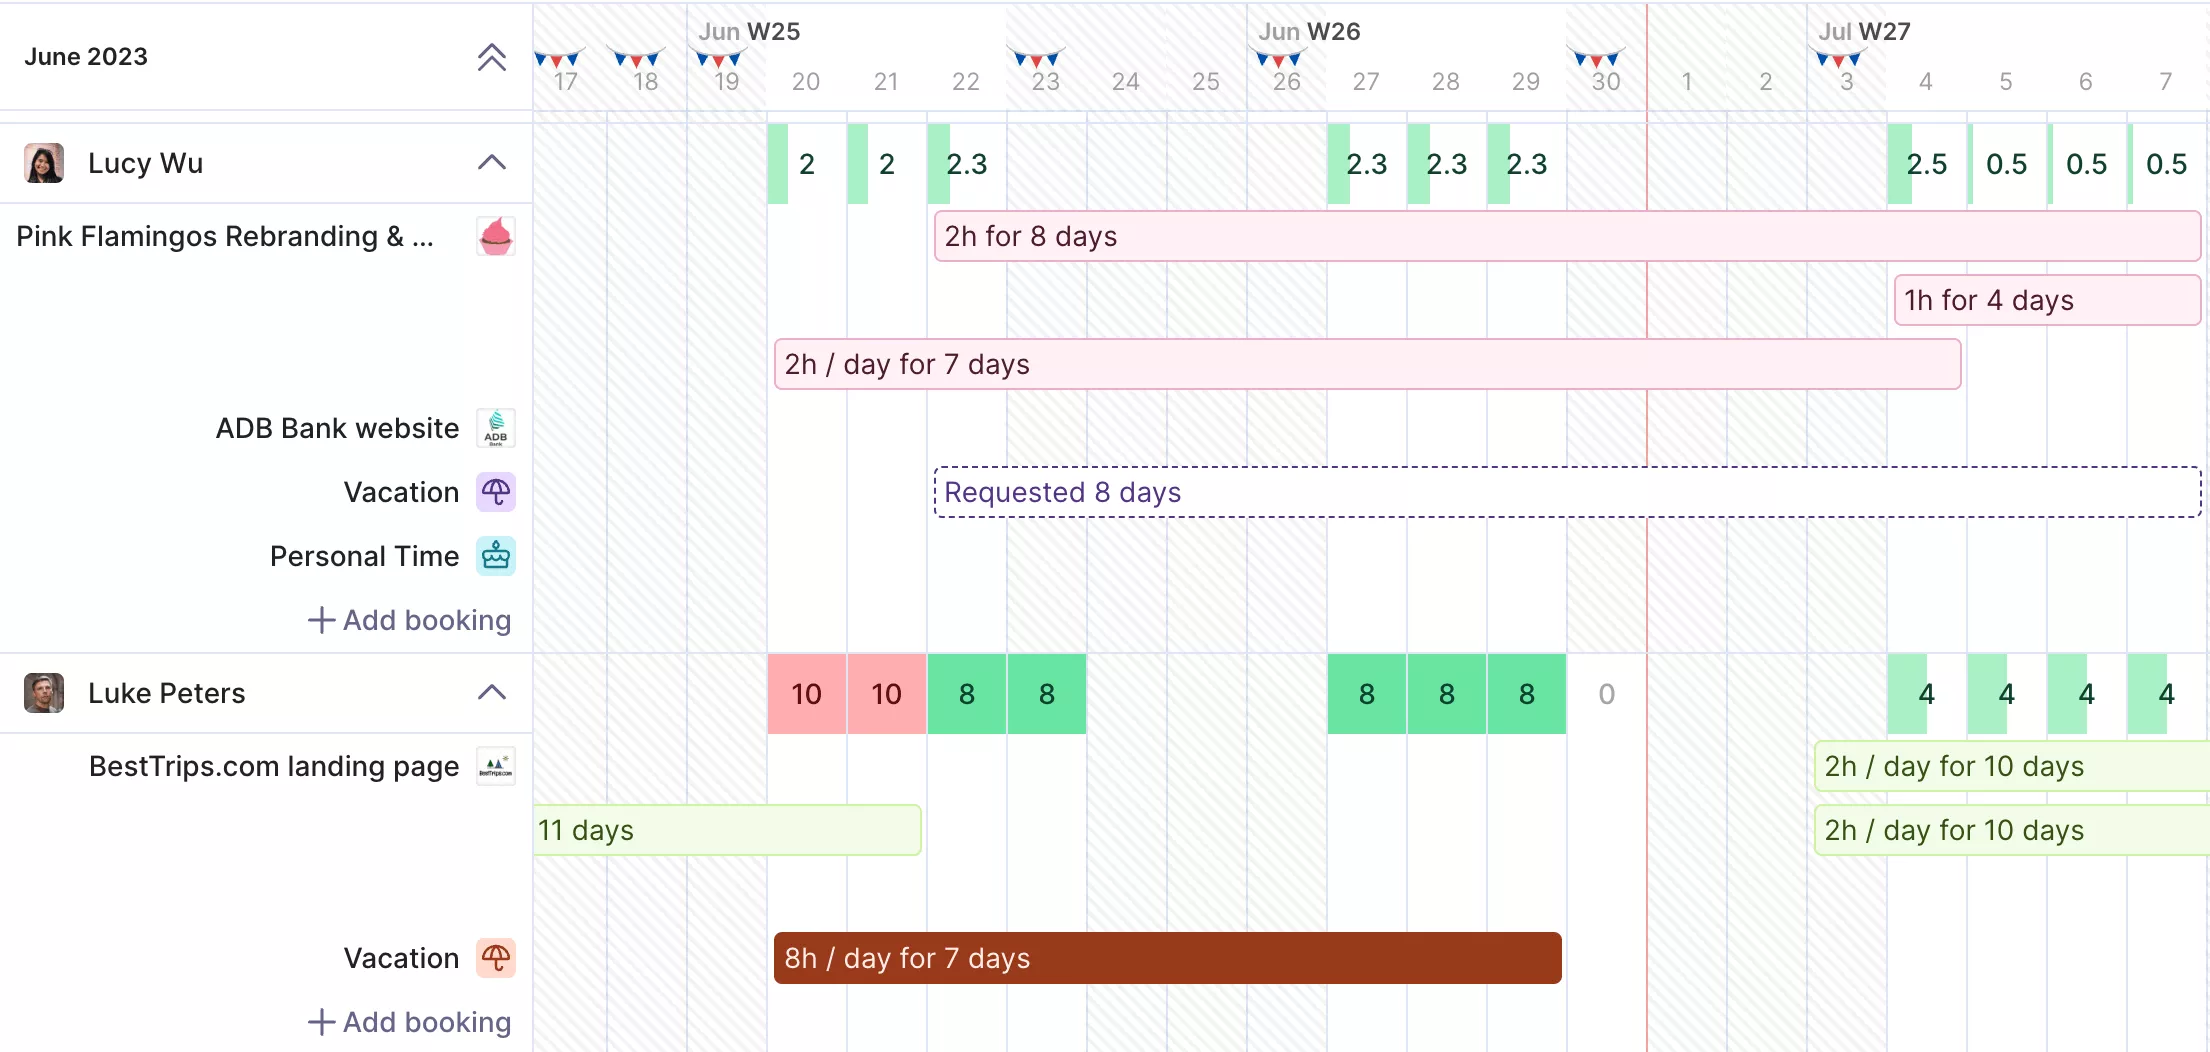
Manage all resources and prevent booking conflicts.
In Q2, the example firm bought 480 contractor hours while 480 of its own available hours went unlogged. That $48,000 is the whole 5-point drop in its operational efficiency. You pass this step when no contractor is approved while a matching employee is booked under 70%.
Step 4: Cut the Largest Non-Billable Category First
Export last month’s timesheets from your time tracking software and group non-billable time by category. Use categories such as internal meetings, admin, human resources tasks, sales support, and training. Pick the largest category and cap next month’s hours 20% under its current total.
Some non-billable work is investment and some is waste, so check which one the largest category holds. Pitching for new work and employee training earn nothing now, but cutting them costs next quarter’s revenue and productivity.
Look for waste in meetings that end without a decision and admin someone repeats by hand.
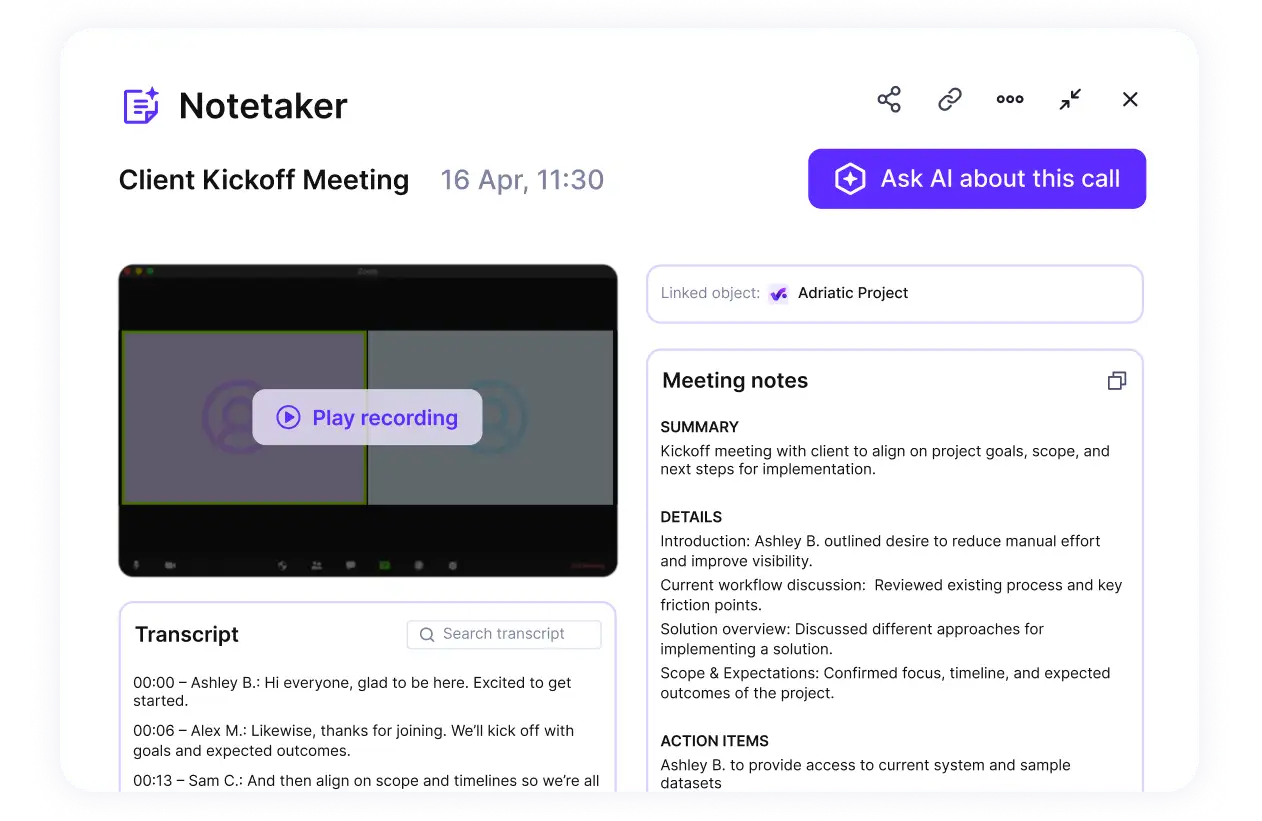
Convert meeting notes into summaries and assigned tasks.
Next month’s export passes if the category is at or under the cap and unbilled client hours hold steady. That second check matters, because the example firm’s non-billable share fell while its operational efficiency got worse.
Step 5: Automate One Recurring Admin Task
Ask each team lead for the admin tasks their team repeats every week, with the time each takes. Automate a task only if it runs weekly, takes over 30 minutes, and follows the same steps each time.
The tests limit automation to repetitive tasks, and anything that needs judgment stays manual.

Automate recurring admin tasks with Productive’s no-code approach.
If the steps vary, write them down first as standard operating procedures. Use simple process mapping: one line per step and one owner per line. Process mapping can show steps to cut before you build any workflow automation.
Productive’s no-code automations for recurring admin work can flag any task closed with no time logged. Four weeks later, the automation should run without anyone starting it; if it does not, fix the trigger.
Automating repetitive tasks raises operational efficiency only when the freed hours go to billed work. Book the freed hours onto sold work the same week, or the process efficiency gain never reaches the P&L.
The business processes around the task stay the same, so nobody has to relearn the work.
Track Operational Efficiency From One Set of Numbers
Productive keeps time tracking, budgets, and resource planning in one system, so every metric comes from the same data.
Operational Efficiency Examples
Operational efficiency examples from firms that sell time include DotDev cutting testing hours and Hike One raising billable utilization. Both come from Productive customer stories. Each shows one input changing, which is how professional services firms improve operational efficiency.
1. DotDev Cut a Testing Phase to 60 to 70 Hours
DotDev is a 34-person product development agency in Melbourne. In a 2020 interview, its co-founder said a standard testing phase used to take 120 to 180 hours.
A comparable enterprise site later went through testing in 60 to 70 hours. He credits running delivery and testing in one tool, while noting that technology and process changed too.
Fewer delivery hours for the same scope lower cost of delivery, the largest input to the ratio. DotDev also reads internal-project time as a capacity signal: 30% means room for more work.
Read how DotDev runs delivery and testing together in the full story.
2. Hike One Raised Billable Utilization by Around 10%
Hike One is a 75-person digital product design agency in Amsterdam. After almost a year on Productive, its managing director said billable utilization rose by around 10%. He tied that rise to a healthier margin.
Its reports also showed senior staff were underpriced, so the agency changed its pricing model. The margin gain matters, because rising utilization only helps when the extra hours are sold.
Operational Efficiency vs. Operational Excellence
Operational efficiency is a ratio you calculate each quarter; operational excellence is the routine that keeps improving it. Efficiency is the operating ratio itself, one figure per quarter that you compare with the last four. In operations management, excellence is the habit of measuring operational efficiency each month and acting on what moved.
That means reviewing the four metrics as key performance indicators, with one owner and performance goals for each.
That review loop is continuous improvement: small, repeated changes to the same process, each written into your best practices. Rebuilding estimates after the example firm’s 20% quarter is the kind of operational improvement it produces.
Then turn these targets into an operations strategy, with an owner and a review date for each.
Closing Thoughts
The operating ratio tells you that operational efficiency changed, and the four hour-based metrics tell you why. Read them together each quarter and fix that cause before you hire or cut.
If you want to improve operational efficiency from one set of numbers, keep hours, budgets, and bookings together.
Productive keeps all three in one place, so your business analytics and the four metrics share the same data. Book a demo and start today.
Connect With Agency Peers
Access agency-related Slack channels, exchange business insights, and join in on members-only live sessions.
