What Is Billable Utilization? Formula, Targets and 5 Steps

Billable utilization is the share of your team’s available hours that you bill to clients. If you only see it at month-end, the unbilled hours are already lost. Your estimates, hiring plans, and pricing then rest on a number you can no longer change.
This guide gives you the formula with a worked team example and target ranges by role. You also get a forecasting maturity model and five steps to raise billable hours without burning out your team.
Key Takeaways
- Billable utilization rate is billable hours divided by available hours, times 100. Pick one denominator and use it in every report.
- Set a billable utilization band per role and treat its top as a ceiling. Senior staff carry sales and mentoring time, so one agency-wide target misreads the team.
- Look for hidden bench capacity first: internal work that would give way to client work. Cutting it raises operational efficiency, but billable utilization only moves when you book those hours.
- Utilization forecasting from scheduled work shows a bench or an overload weeks ahead. Actuals only show it after the month closes.

What Is Billable Utilization?
Billable utilization is the percentage of an employee’s or team’s available hours spent on billable tasks for clients. It shows how much of the time you pay for turns into revenue-generating client work.
Available hours are contracted hours minus approved time off and public holidays. Billable hours are hours logged to client work, under any billing model. Everything else is non-billable: sales, admin, training, internal projects, and time on the bench.
| Activity | Billable? |
|---|---|
| Design or development work on a client project | Yes |
| Hours on a fixed-fee or retainer project | Yes, even when the invoice does not change |
| Client calls your contract covers | Yes |
| Rework you choose not to charge for | No, log it as non-billable |
| Sales pitches and proposals | No |
| Team stand-ups and training | No |
Utilization counts hours, not money. Realization (billed value against the value of hours worked) is the separate metric that tracks what you get paid.
You can measure billable utilization per person, team, project, or agency:
- Per person: who is overloaded and who is underbooked.
- Per team: which group carries the non-billable load.
- Per project: where delivery ran past the hours you sold.
- Agency-wide: whether you have room for more client work.
A low rate is not always idle time. Often it is hidden bench capacity: internal work that would give way once a client project arrives. Teams also use billability for a related measure.
Check how billability differs from utilization before you compare two reports.
Billable Utilization vs. Resource Utilization
Resource utilization counts every productive hour, billable or not, against available hours. Billable utilization counts only client hours. Take a designer with 152 available hours, 114 billable hours, and 20 hours of internal brand work. She runs 88.2% resource utilization and 75% billable utilization.
The 13-point gap is internal work that a billable target never sees. If you also report resource utilization across all work, show both rates side by side.
How to Calculate Your Billable Utilization Rate
You calculate your billable utilization rate by dividing billable hours by available hours, then multiplying by 100. Use the same period for both numbers, usually one month. The billable utilization rate formula is below:
Billable utilization rate = (billable hours ÷ available hours) × 100
Example: One Designer in One Month
Your designer is contracted for 40 hours a week, so a four-week month holds 160 hours. One public holiday removes 8, leaving 152 available hours. She logs 114 hours to revenue-generating client work.
114 ÷ 152 × 100 = 75%
Now say she also worked 13 hours of overtime on internal work, 165 hours in total. Measured as billable hours against actual hours worked, the same month reads 69.1%. Available hours stay fixed when overtime comes and goes, which is why they make the steadier denominator. Pick one and use it in every report.
Example: A Three-Person Team
Add the hours first, then divide. Averaging individual rates overweights anyone who was out for part of the month.
| Role | Available hours | Billable hours | Rate |
|---|---|---|---|
| Account director | 152 | 61 | 40.1% |
| Senior designer (one week off) | 120 | 96 | 80.0% |
| Junior developer | 152 | 129 | 84.9% |
| Team | 424 | 286 | 67.5% |
Averaging the three rates gives 68.3%, which overstates the team’s billable utilization. The account director’s 91 non-billable hours need a second look too. Sales and client management belong to the role.
If 30 of them went to a pausable internal project, that is hidden bench capacity you could book.
A table built by hand each month gives you no real-time visibility when a rate slips. Productive gives you utilization reports per person, including Billable Utilization by People, without a spreadsheet.
If your time data has gaps, fix how you track billable hours before you trust any rate.
Stop Rebuilding Utilization Spreadsheets
Productive gives you utilization reports per person, so the month-end table builds itself from your data.

What Is a Good Billable Utilization Rate?
A good billable utilization rate is 70% to 90% for production staff and 60% to 80% for account management. Those ranges come from Promethean Research’s agency utilization guidance, published in 2021, which also puts partners lower still.
The wider market runs below the production range. SPI Research’s 2026 benchmark report covered 509 professional services firms. It put average billable utilization at 66.4% for 2025, the lowest in its 19-year history.
| Group | Typical target or result | Source |
|---|---|---|
| Production staff | 70% to 90% | Promethean Research, 2021 |
| Account management | 60% to 80% | Promethean Research, 2021 |
| Partners and senior roles | Much lower than production staff | Promethean Research, 2021 |
| Professional services firms, 2025 average | 66.4% | SPI Research, 2026 |
| Top 20% of those firms | Substantially higher than the rest | SPI Research, 2026 |
Why the Rate Differs by Role
Senior roles carry sales, hiring, mentoring, and review, so their billable utilization sits lower by design. Junior consultants spend most of the week on delivery and run toward the top of the band.
That makes consultant leverage (how many junior consultants each senior person supervises) the main driver of your blended rate. Example: with seniors at 50% and juniors at 85%, one senior and four juniors average 78%.
Two seniors and three juniors average 71%, with nobody working harder.
Push consultant leverage too far and seniors lose their review hours. That shows up as rework and weaker delivery quality before it shows up in the rate.
How Much the Rate Moves Month to Month
Monthly rates swing with client schedules, new-account onboarding, and gaps between projects. Judge utilization targets against a rolling three-month average. Act on a single month only when it misses by more than 10 points.
Watch the top of the band as closely as the bottom. Rates held above it for months cost consultant sustainability, because the extra hours come from evenings and weekends.
What Affects Your Billable Time and Utilization?
Your billable utilization depends on four things: project management, staffing mix, time tracking, and forecasting. Below we cover how all of these individual factors impact your utilization rates.
How You Manage Projects
Internal meetings, status calls, and unplanned rework fill hours that should go to client delivery. A weekly two-hour internal meeting for six people uses 12 available hours every week. Status updates written in shared tasks replace many of those calls.
If your current tool can’t hold them, see which is the best project management software for your team.
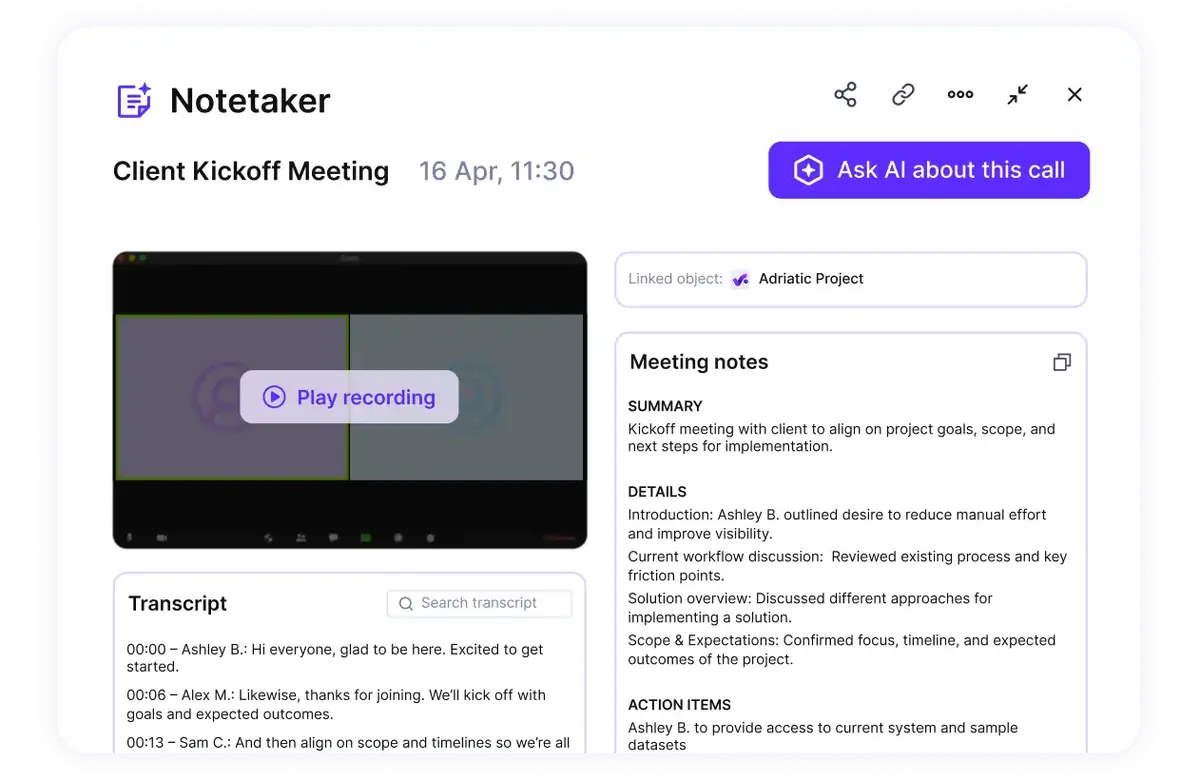
Use the AI notetaker to convert meeting transcripts into tasks with descriptions and due dates.
What’s Your Staffing Mix
Consultant leverage sets your ceiling. With too few junior consultants, seniors pick up delivery work, so their rate rises while your margin falls. With too many, seniors lose review time and delivery quality drops.
Consultant leverage also limits delivery scalability. You can add junior consultants only as fast as your seniors can review their work.
How You Track Time
Timesheets filled in from memory on Friday lose short client tasks. Billable hours then read low and non-billable hours read high, so the rate understates the work. Logging time daily, or using billable hours tracking software, narrows that gap.
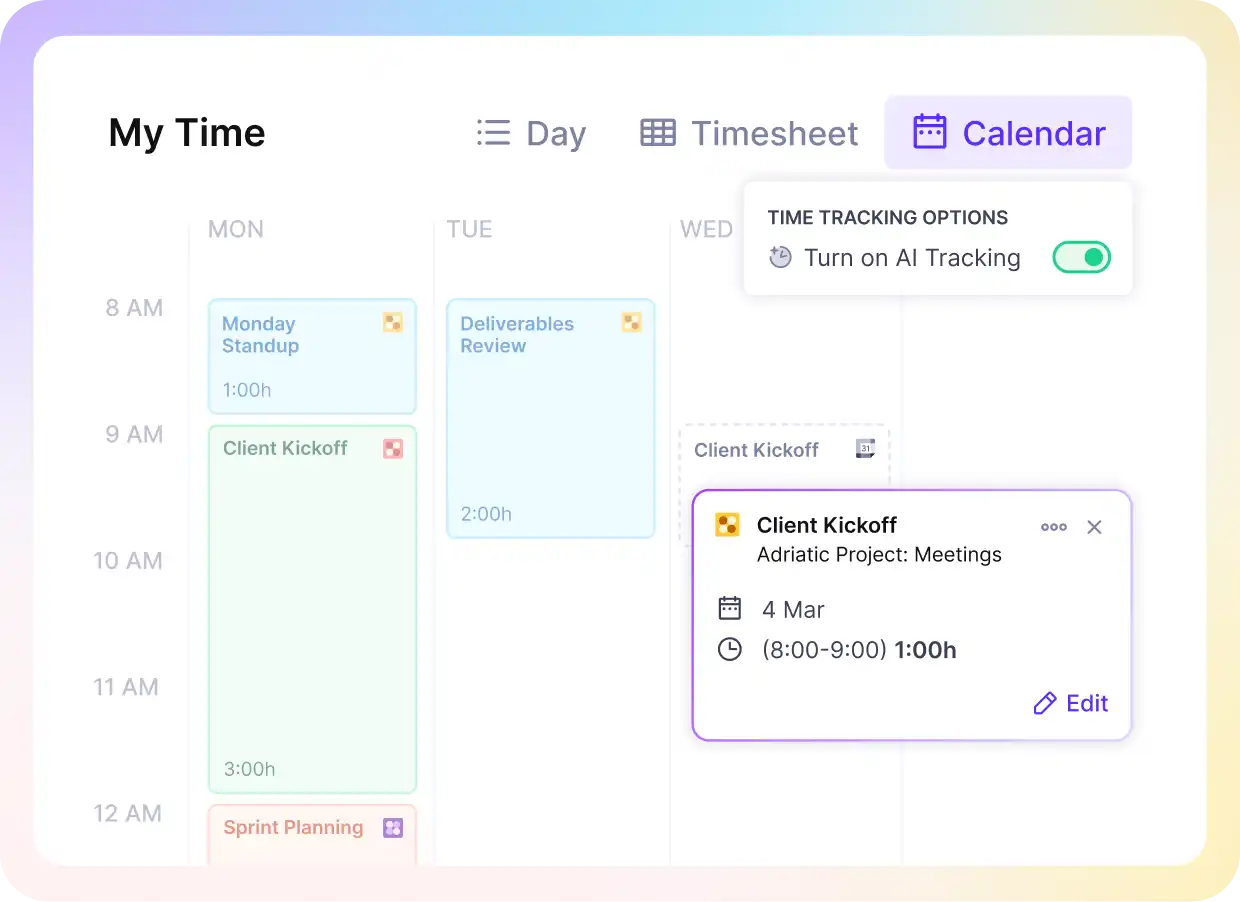
Use Productive’s AI assistant to convert calendar entries into timesheets.
Do You Forecast
Weak forecasting means you staff projects as deals close. Two projects then claim the same senior designer in the same week. Those staffing conflicts push billable hours from one month into the next.
Which Metrics Help You Increase Utilization?
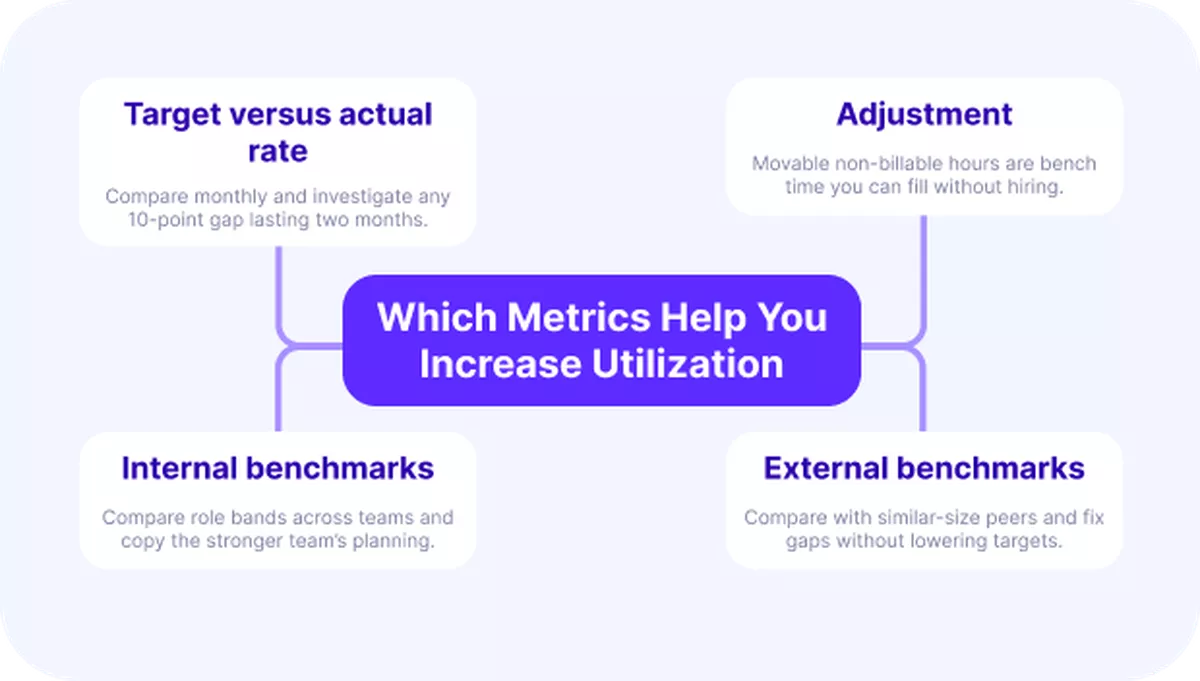
Four metrics help you increase billable utilization: target versus actual rate, hidden bench capacity, internal benchmarks, and external benchmarks. In the shortlist below, we’ll tell you how to calculate each one.
- Target versus actual rate. Compare each person’s actual rate with their role target every month. A gap under 5 points is noise. A 10-point gap held for two months needs a cause: a lost project, a bad estimate, or internal work. A rate inside the band for a full quarter signals delivery predictability: estimates hold and projects start on time.
- Hidden bench capacity. Split non-billable hours into fixed work (sales, admin, required training) and movable work (internal projects, optional tasks). The movable share is bench time you can fill without hiring. Track the movable share monthly, as a percentage of available hours, to measure your operational efficiency gains.

That’s a key thing that we get out of the reports that really feeds into our utilization and resourcing. If we know we’re doing 30% on the internal projects, then we know we’ve got the capacity to take on more work.
Read the full story: Using Productive, DotDev Has Grown 50% YoY For the Past Three Years
- Internal benchmarks. Higher consultant leverage lifts a team’s blended rate, so compare people against their role band first. If a role runs 10 points higher in another team, copy one of that team’s planning habits. Check the gap a quarter later to see if the staffing optimization worked.
- External benchmarks. Compare your agency-wide rate with peers of a similar size and service mix. If you sit well below them, find the cause first. Look at internal work, late staffing, and a pipeline too thin to fill capacity. Lowering a target to match a weak result bills no extra hours.
How Does Utilization Forecasting Work?
Utilization forecasting divides each person’s scheduled billable hours by their available hours for a future month. It draws on confirmed bookings and approved time off, with tentative bookings as a separate what-if layer.
Example: a developer has 152 available hours next month and 98 hours booked to client projects. Her forecast is 64.5%, so you have 54 hours to sell before the month starts.
Sum those gaps across teams and you have the starting point to plan capacity across the agency.
In Productive, the Forecasted Billable Utilization by People report lets you forecast billable hours months ahead. Approved time off feeds into your resource plans. Tentative bookings let you pencil in people for deals that are not confirmed yet.
Those hours stay out of scheduled time until you confirm the booking.
The Four Stages of Forecasting Maturity
Forecasting maturity is how far ahead, and how reliably, you can see each person’s billable hours. You move up a stage when your current method starts costing you work. The table shows where each stage fits, where it breaks, and when to move on.
| Stage | Who uses it | Good for | Enough when | Where it breaks | Signals to upgrade |
|---|---|---|---|---|---|
| Gut feel | Small, founder-led teams | Fast calls, no admin | One person knows every booking | The bench shows up only when someone asks for work | Double bookings, or nobody knows who is free next month |
| Spreadsheet | Teams where a PM or ops lead owns the sheet | A shared view of bookings | Projects are few, long, and stable | Hand updates lag and formulas break, so people staff from old numbers | You recheck the sheet before every staffing call |
| Bookings | Teams using a resource planner tied to projects | A forecast that moves with every booking | Most work is signed before it starts | Unsigned deals stay invisible until they land | Wins keep arriving with start dates you can’t staff |
| Pipeline-weighted | Teams with a steady pipeline and one resourcing owner | Seeing next quarter’s free capacity early | Sales keeps deal stages current | Stale deal odds and old tentative bookings inflate the forecast | Top stage: audit tentative bookings older than a month |
Each move up changes what you can see. Going from a spreadsheet to bookings gives you real-time visibility of who is free next month. Utilization forecasting then updates with every booking.
Adding the pipeline shows hidden bench capacity while sales can still fill it, and brings delivery predictability. At higher forecasting maturity, staffing optimization becomes a weekly 30-minute review instead of a month-end scramble.
Signs of Weak Forecasting
Weak forecasting shows up as late staffing conflicts, idle juniors, and month-end misses. Conflicts surface after kickoff, when two projects need the same person in the same week. Junior consultants sit on the bench while seniors work weekends. Actual utilization lands more than 10 points off the forecast more than once a quarter.
See Next Month’s Utilization Today
Productive’s Forecasted Billable Utilization by People report shows each person’s rate for the months ahead.

Allocation Governance
Allocation governance means the rules on who books whom, who approves, and which project wins a clash. Write three rules down:
- One person approves bookings for each team.
- A booking with no confirmed start date is released after two weeks.
- Client work goes ahead of internal work unless a director signs off.
Without these rules, staffing conflicts go to whoever asks first, and delivery predictability drops. Delivery scalability stalls too, because each new client adds clashes faster than it adds billable hours.
How to Raise Billable Hours Without Burning Out Your Team
To raise billable hours, set role bands, cut movable work, book freed hours, write booking rules, and cap overload. Run them in order. Each step ends with a pass and a fail condition.
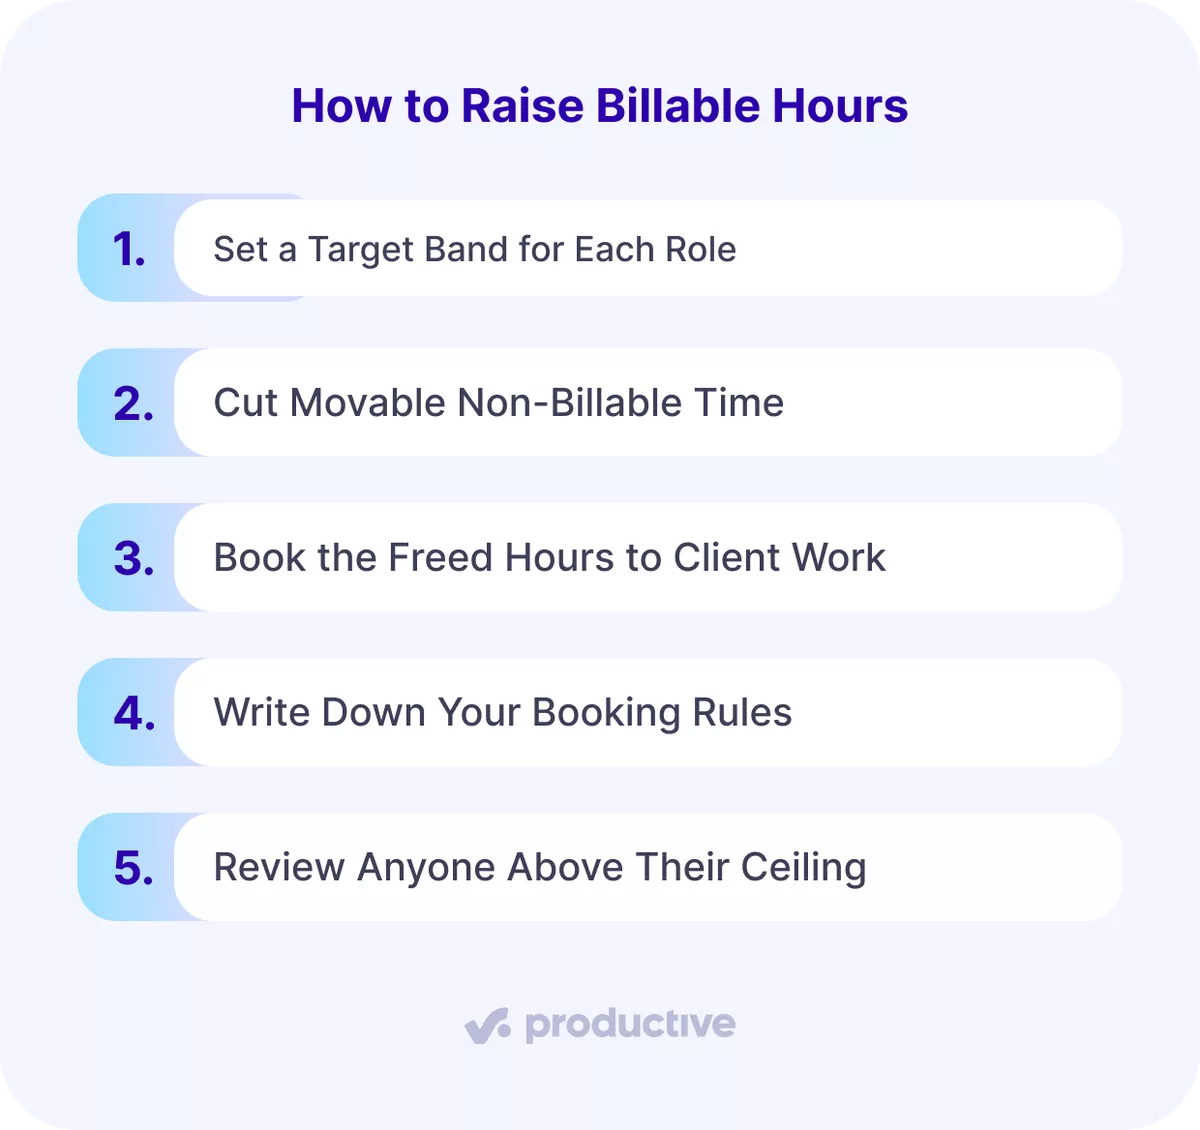
Here’s a detailed five-step process:
Step 1: Set a Target Band for Each Role
Make a short table with one row per role, plus a floor and a ceiling for each. The floor is where you start looking for missing work. The ceiling is where you start checking workload.
Begin with published ranges, such as 60% to 80% for account managers, then adjust for your service mix. Next, weight each band’s midpoint by headcount to get the blended target your consultant leverage produces.
Example: two account managers at a 70% midpoint and six designers at 80% give a blended target of 77.5%.
- Pass condition: every person has a band, and the blended target matches your financial plan.
- Fail condition: the plan needs more than your mix can produce, say 75% against 71%. Change the mix or the plan before you push people harder.
Step 2: Cut Movable Non-Billable Time
Export last month’s non-billable time entries and sort them by category. Mark each category as fixed or movable. Then cut or shorten any recurring internal meetings over one hour a week that produce no decision or owner. Example: a weekly 90-minute update meeting can become a written update plus a 20-minute Q&A.
- Pass condition: each team’s movable non-billable share drops by at least 5 points the following month. That gain is operational efficiency. It becomes billable time only in Step Three.
- Fail condition: the share drops by less than 5 points, or the cut meetings return within a month. Find out who brought them back before you cut again.
Step 3: Book the Freed Hours to Client Work
Open next month’s forecast and list everyone below their floor. Book their freed hours onto revenue-generating client work in your resource planner within the same week. Start with projects behind schedule, then with small billable tasks waiting in the backlog.
- Pass condition: everyone forecast below their floor for next month is booked inside their band by Friday.
- Fail condition: hours stay unbooked for two weeks because there is no client work. Send sales the free hours by role, so the pipeline can fill them.
Step 4: Write Down Your Booking Rules
Publish your allocation governance rules in the team handbook and name one approver per team. Keep them to one page. When a team sits below its floor, lend its junior consultants to a team above its ceiling.
That cross-team staffing optimization uses hours you already pay for.
- Pass condition: staffing conflicts found after kickoff fall to zero within one quarter.
- Fail condition: clashes still surface after kickoff, or bookings skip the approver. Review each case and tighten the rule it slipped past.
Step 5: Review Anyone Above Their Ceiling
Pull a list each month of everyone above their role ceiling. Anyone on it two months running gets a workload review with their manager. The review exists to rebalance workloads before people burn out. Move one recurring task to a colleague below their floor, or push a non-urgent deadline back a week.
Check their rework hours and missed review dates there too. Those are your earliest delivery quality signals.
- Pass condition: nobody stays above their ceiling for three months.
- Fail condition: the same names return every month. That points to a wrong band or a thin team, so go back to Step One.
Consultant sustainability sets the limit on delivery scalability, because growth built on overtime ends when people leave. Protecting consultant sustainability protects delivery quality too.
Connect Your Data With the Place You Deliver Work
Billable utilization breaks where your data breaks. Spread time, bookings, and invoices across three tools, and every rate becomes a reconciliation job. Keep the hours, the bookings, and the plan in the tool where you deliver the work.
Utilization forecasting stops being a monthly rebuild, and delivery quality holds because overload shows before deadlines. If you want that in one place, Productive runs time tracking, resource planning, and utilization reports together.
Book a demo and start today.
Connect With Agency Peers
Access agency-related Slack channels, exchange business insights, and join in on members-only live sessions.
