Capacity Planning Metrics (2026) – What to Track & When to Act

Capacity planning metrics are the numbers that show how many hours a team has and whether new work fits. You use them to decide whether to take a project, when it can start, and when to hire.
We’ve included formulas for available hours, utilization, capacity gap and bench time, each with a threshold. We also show why monthly averages hide overbooked weeks and what utilization level to plan to.
Key Takeaways
- Divide every utilization number by available hours. That is contracted time less leave and holidays, with internal meetings still counted.
- Run total, billable and forecast utilization on that same denominator. The example team reads 87.8% total and 77.4% billable this quarter, and 87.2% forecast for next month.
- A healthy monthly average can hide overbooked weeks. No month in the example averaged over 90%, yet 2 of its 12 weeks were overbooked.
- Plan below 100% by your weekly spread, the swing in weekly utilization. One spread allows about one overbooked week in six, and two allow about one a year.
What Are Capacity Planning Metrics?
Capacity planning metrics are workforce measures that compare a team’s available hours with booked and expected work. They are tracked per team and per period, usually a week or a month.
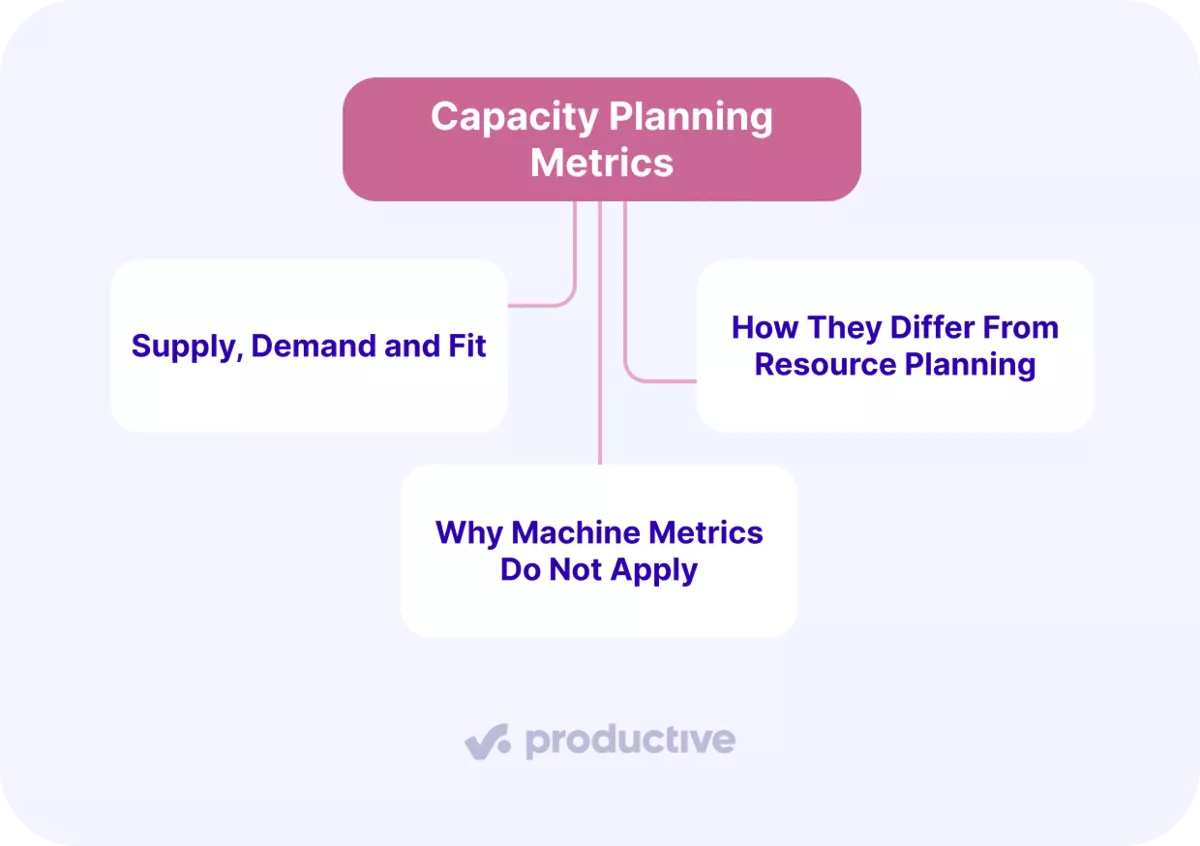
Supply, Demand and Fit
Each metric measures supply, demand, or the fit between them. Supply is the hours your team can work in the period. Demand is the hours already booked plus the pipeline work you expect to win. Fit metrics compare the two to show whether supply covers demand.
How They Differ From Resource Planning
Resource planning differs because it assigns hours to named people and projects. These numbers cover the team’s total hours, before anyone is named. When you run the same arithmetic person by person, the practice is called resource capacity planning.
Why Machine Metrics Do Not Apply
For a firm that sells time, the unit is people’s hours, not machine output. Server response time and production yield do not apply, so every formula counts hours.
Manage capacity with Productive
Which Metrics Show Whether Your Team Can Take On More Work?
The metrics that show whether your team can take on more work are available hours, weighted demand, utilization, capacity gap and bench time.
- Available hours and weighted demand are inputs, and the other three are calculated from them.
- Hours are finite resources, so a fully booked week has no room for extra work.
- Anything added comes out of another project’s dates or out of people working past their contract.
These numbers come before resource allocation and resource planning. You confirm the hours exist first, then decide who gets them.
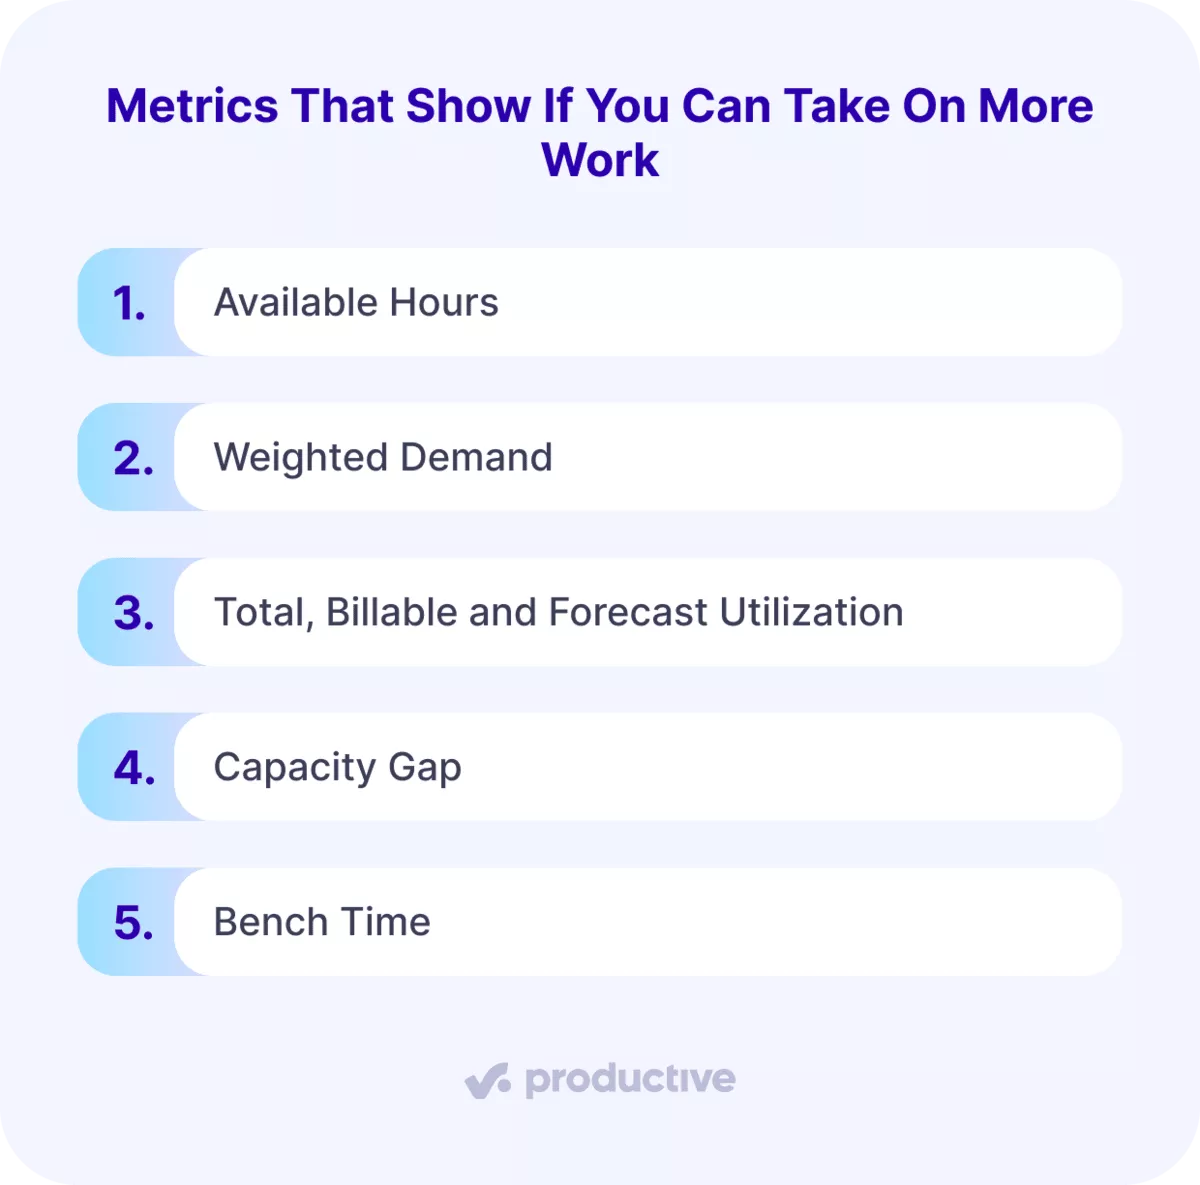
Metric 1: Available Hours
Available hours are contracted hours minus leave and public holidays for the period. Team capacity for a week is the sum of every person’s available hours.
Internal meetings and other non-billable time stay inside available hours. They are booked work, and total utilization counts them. Subtract them from supply instead, and billable utilization looks higher than it is.
The denominator shrinks while billable time stays the same.
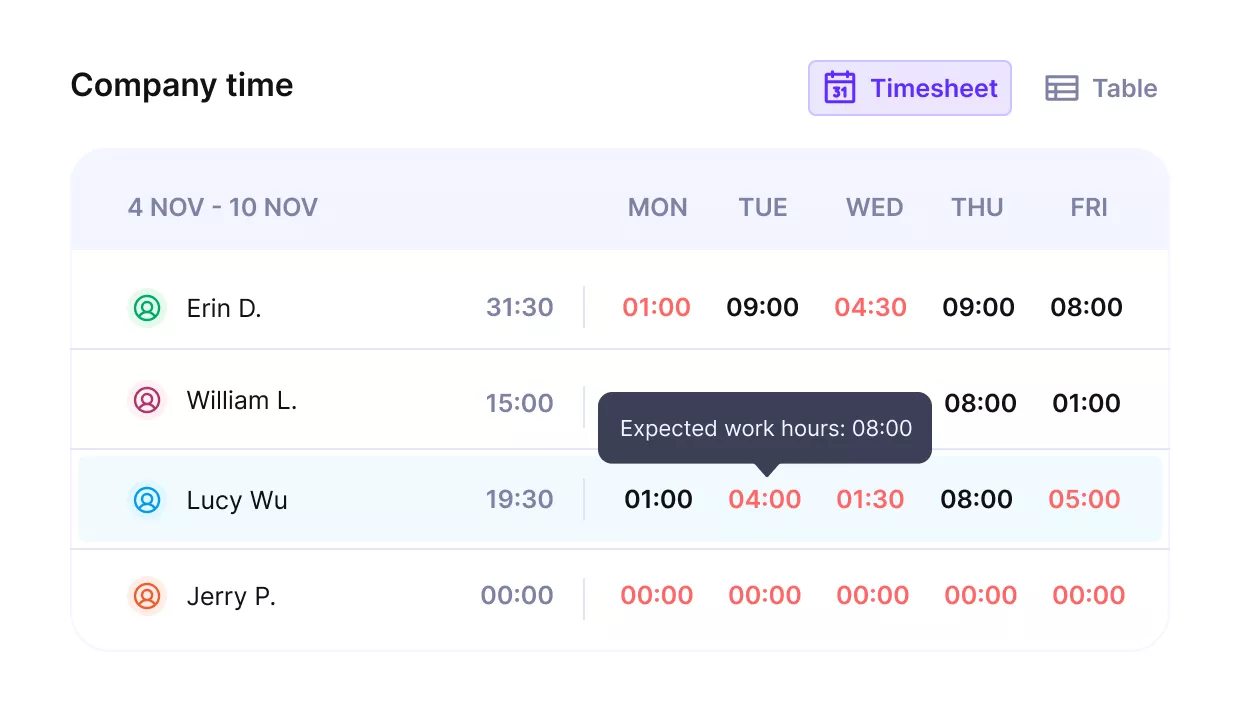
Get real time updates on available time and idle hours.
Metric 2: Weighted Demand
Some demand is not booked yet, such as a proposal due to start in three weeks. Weighted demand is confirmed bookings plus each pipeline deal’s estimated hours multiplied by its win probability. Win probability is the chance, in percent, that the deal closes.
The weighting keeps a 50% deal from counting at full size, which would overstate the workload. Leaving the deal out entirely understates it. Lead time (weeks from a deal closing to its work starting) shows which weeks the pipeline affects.
At two weeks, pipeline belongs in next month’s demand; at eight weeks, next month is confirmed work only.
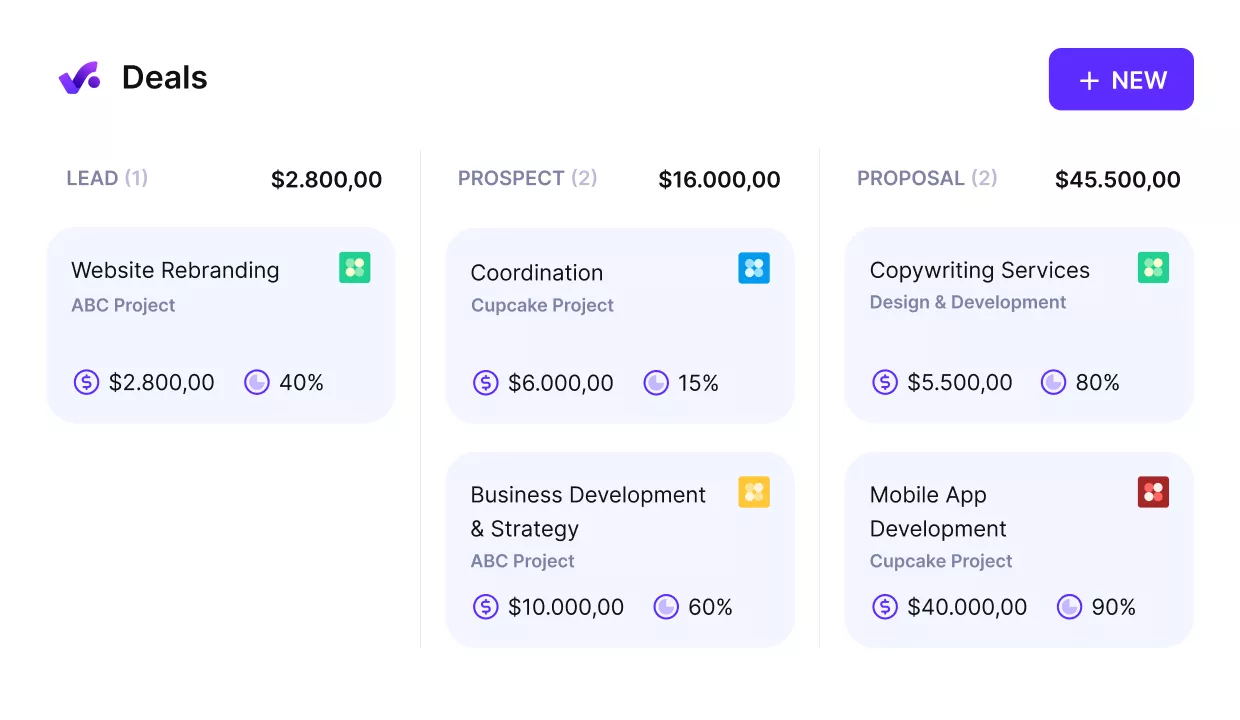
Factor in upcoming work in your capacity forecasts.
Metric 3: Total, Billable and Forecast Utilization
All three utilization formulas share one denominator, available hours, so their results compare directly.
- Total utilization = all booked hours ÷ available hours
- Billable utilization = booked billable time ÷ available hours
- Forecast utilization = (booked hours + weighted pipeline hours) ÷ available hours for a future period
Total shows how full the team is. Billable shows how much of that time earns revenue. Forecast shows the same view for weeks that have not happened yet. Any of the three gets called a utilization rate, so name which one a report shows. Some teams call total utilization resource utilization.
Metric 4: Capacity Gap
Before you accept the next deal, the capacity gap shows whether the team has the hours for it. It is available hours minus booked hours minus weighted pipeline hours for the same period.
A positive gap means spare hours, and a negative gap means the team is short.
A negative gap more than a month out is a scheduling problem you can still fix by moving dates. A gap that stays negative across a quarter is a hiring question.
Metric 5: Bench Time
People with no bookings for a week are on the bench. Bench time is available hours with nothing booked, divided by available hours. Calculate it week by week and person by person. A team total can hide one person with no bookings for a month while colleagues are overbooked.
Some bench is healthy, because it covers unplanned absence, estimate overruns and deals that start early.
How Do You Calculate Utilization, Capacity Gap and Bench Time?
You calculate all three from available hours, booked hours and weighted pipeline hours. Each input must cover the same period, such as a quarter or a month ahead.
Utilization for One Quarter
Example: an illustrative team of 10 people, each on 40 contracted hours a week, over a 12-week quarter.
| Input or result | Quarter |
|---|---|
| Contracted hours | 4,800 |
| Leave and public holidays | 176 |
| Available hours | 4,624 |
| Booked hours, all work | 4,060 |
| Booked billable time | 3,580 |
| Booked internal time | 480 |
| Total utilization | 87.8% |
| Billable share of available hours | 77.4% |
- Available hours: 4,800 contracted hours minus 176 hours of leave is 4,624.
- Total utilization: 4,060 booked hours divided by 4,624 available hours is 87.8%.
- Billable share: 3,580 hours of billable time divided by 4,624 available hours is 77.4%.
- Internal time: the 480 booked internal hours account for the difference between the total and billable figures.
Bench Time Week by Week
For bench time, add up each week’s unbooked hours: 591 hours, or 12.8% of available hours. Netting the quarter instead gives 4,624 minus 4,060, or 564 hours and 12.2%. The 27-hour difference is two overbooked weeks offsetting idle hours in other weeks.
Forecast for the Next Four Weeks
- Available hours: 1,536, after 64 hours of leave.
- Confirmed bookings: 1,180 hours.
- Weighted pipeline: Deal A is 240 hours at a 50% win probability, so it counts 120. Deal B is 160 hours at 25%, so it counts 40, for a total of 160.
- Forecast utilization: 1,180 plus 160, divided by 1,536, is 87.2%.
- Capacity gap: 1,536 minus 1,180 minus 160 is 196 spare hours.
If both deals close at full size, the team needs 1,580 hours against 1,536 available. That is a gap of minus 44 hours and 102.9% forecast utilization.
See Whether New Work Fits, Week by Week
Productive keeps bookings, leave and pipeline in one Resource Planner, so every capacity number comes from the same data.

Why Do Monthly Averages Hide Overbooked Weeks?
Monthly averages hide overbooked weeks because a busy week and a quiet week cancel out in the month’s total. Dividing a month’s booked hours by its available hours blends them into one number.
| Week | Available hours | Booked hours | Total utilization |
|---|---|---|---|
| 1 | 400 | 320 | 80.0% |
| 2 | 384 | 350 | 91.1% |
| 3 | 392 | 330 | 84.2% |
| 4 | 376 | 390 | 103.7% |
| 5 | 360 | 355 | 98.6% |
| 6 | 400 | 280 | 70.0% |
| 7 | 392 | 405 | 103.3% |
| 8 | 384 | 330 | 85.9% |
| 9 | 368 | 310 | 84.2% |
| 10 | 400 | 340 | 85.0% |
| 11 | 392 | 290 | 74.0% |
| 12 | 376 | 360 | 95.7% |
Grouped into four-week months, the averages are 89.6%, 89.2% and 84.6%. The quarter’s total workload of 4,060 hours fits inside 4,624 available hours. Yet weeks 4 and 7 are over capacity by 14 and 13 hours.
Track Overbooked Weeks and Weekly Spread
Track overbooked weeks and weekly spread alongside the monthly average.
- Overbooked weeks: the share of weeks where booked hours exceed available hours. The example team has 2 of 12, or 16.7%.
- Weekly spread: the standard deviation of weekly total utilization, meaning how far a typical week falls from the average. The example team’s spread is 10.4 percentage points. In a spreadsheet, run STDEV.P over the weekly utilization column.
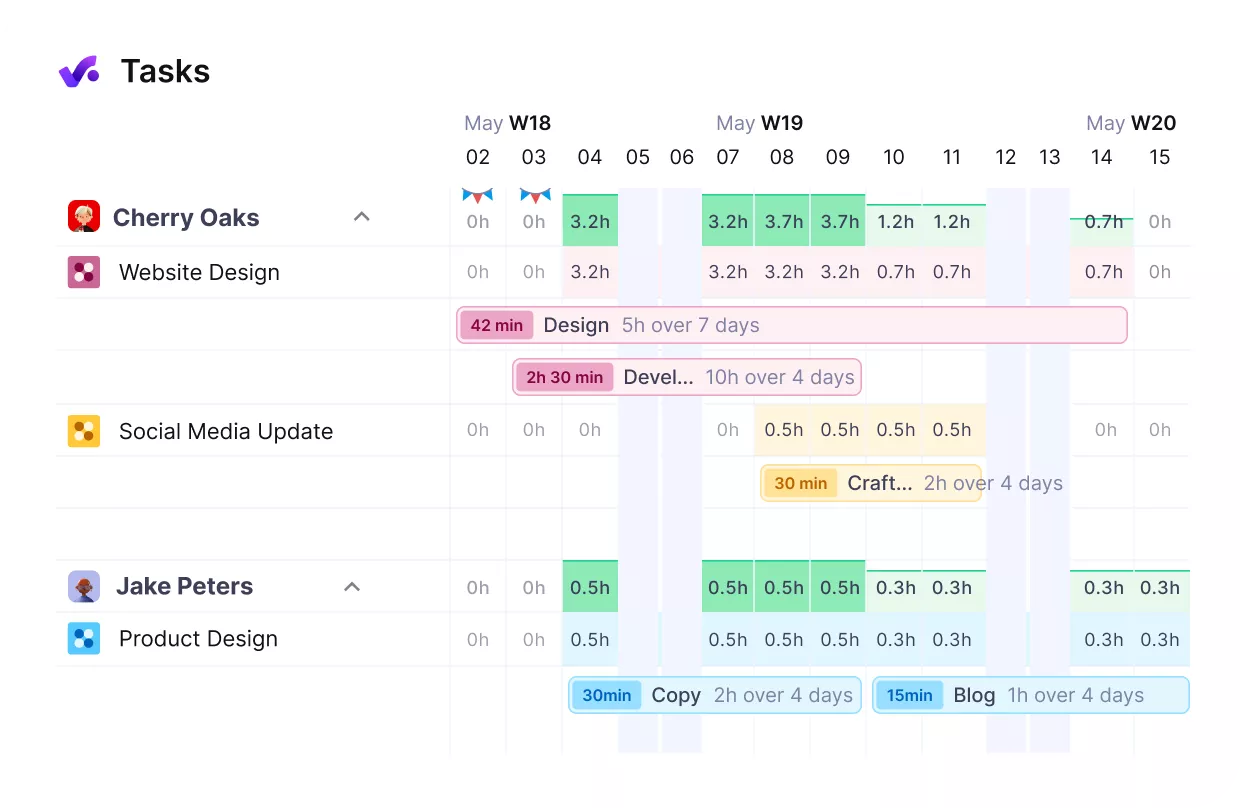
Productive gives you real-time overviews of your team’s workload.
Where the Overtime Shows Up
In the example, assume the 27 overbooked hours were worked as overtime hours to deliver the bookings. Check timesheets for the peak workload days in each overbooked week, and note which projects filled them.
What Utilization Level Should You Plan To?
Plan total utilization to 100% minus one weekly spread, or minus two spreads when overbooked weeks are costly. For the example team, a 10.4-point spread gives 89.6%, and two spreads give 79.2%.

Connect utilization metrics with financial performance.
Overbooked Weeks at Each Planning Level
Each level allows a predictable share of overbooked weeks, assuming weekly utilization is roughly bell-shaped. One spread below 100% leaves about 15.9% of weeks overbooked, or one in six. Two spreads below 100% leave about 2.3%, roughly one week a year.
The example team averaged 87.8%, just inside one spread, and had 2 overbooked weeks in 12. That is close to the one in six the rule predicts.

Manage available resources in real-time.
How the Rule Compares With SPI’s Benchmark
SPI Research’s 2025 benchmark of 403 firms found billable utilization fell to 68.9% in 2024. SPI treats 75% as optimal, and the top 20% of firms averaged 76.2%.
Those are billable figures, so set them against the example’s 77.4% billable figure, which clears SPI’s 75%. The 89.6% plan level is total utilization, which also counts internal time.
Setting a Utilization Target From Margin
When finance leaders set a utilization target from margin, show them the weekly spread next to it. Clinic scheduling research shows that throughput (work delivered per week), extra hours and waiting time trade off.
Pushing utilization toward 100% raises both extra hours and delays. Plan to the spread, not the average: a target set on averages ignores the overbooked weeks.
What Should You Do When a Number Crosses Its Threshold?
When a number crosses its threshold, take the first action tied to it and set a date to recheck. The five triggers are overbooked weeks, a negative capacity gap, high bench time, hours past contract and estimate overruns.
Treat each threshold as a starting rule for your own data. Log each trigger and the action taken in your monthly management reporting.
| Trigger | Artifact you already own | Threshold (starting rule) | Action | Pass/fail check |
|---|---|---|---|---|
| Overbooked weeks | Booked and available hours per person, last 12 weeks | More than 2 overbooked weeks in 12 for the team, or one person overbooked 3 weeks running | The resource manager moves or splits bookings in the next overbooked week before anyone approves extra hours | 2 or fewer overbooked weeks in the next 12 |
| Negative capacity gap | Available hours, confirmed bookings and weighted pipeline for the next four weeks | Gap below zero in any of those weeks | Before signing, bring in a freelancer, move the start date or hold the deal, and record which | Gap at zero or above for every week before the contract goes out |
| Bench time | Bench time per person, week by week | Above 20% for the same person three weeks in a row | The delivery lead pulls forward confirmed pipeline work or assigns internal work with an end date | That person’s bench time under 20% within four weeks |
| Logged hours past contract | Last month’s timesheets next to contracted hours | More than 5% above contracted hours for a person in a month | The delivery lead moves next month’s bookings to people booked under 80% with the same skill | That person at or under 105% of contract next month |
| Estimate overruns | Estimated and actual hours for the last five closed projects of one type | Actual hours more than 10% over the estimate on three of the five | Add the median overrun of the five to the matching line of the next estimate | The next three projects of that type finish within 10% of the estimate |
Find the Bottleneck in Overbooked Weeks
The person who is over their hours is the bottleneck for every project they work on. Productive’s capacity indicators in the By Person view show each person’s booked hours against available hours.
In the Resource Planner, half-year and year zooms group time by week, giving visibility into resources across a quarter.
Hold the Start Date Until People Are Named
Hold the start date until resource planning has named people for it.
In Productive, you can book pipeline work as tentative bookings, which stay out of scheduled hours until confirmed. Switching on Include tentative factors them into the planner’s booked totals, showing the resource allocation if the deal closes.
Diagnose Recurring Bench Time
Recurring bench for the same person points to a skills or sales mismatch. For skills, train or reassign the person; for sales, review whether the pipeline needs what they do. Give spare capacity internal work with an end date, so the person is free again when a deal closes.
Rebalance Hours Past Contract
Five percent over contract is about one extra day in a four-week month. Moving bookings to colleagues under 80% aims for balanced workloads across the skill group, checked on next month’s timesheets.
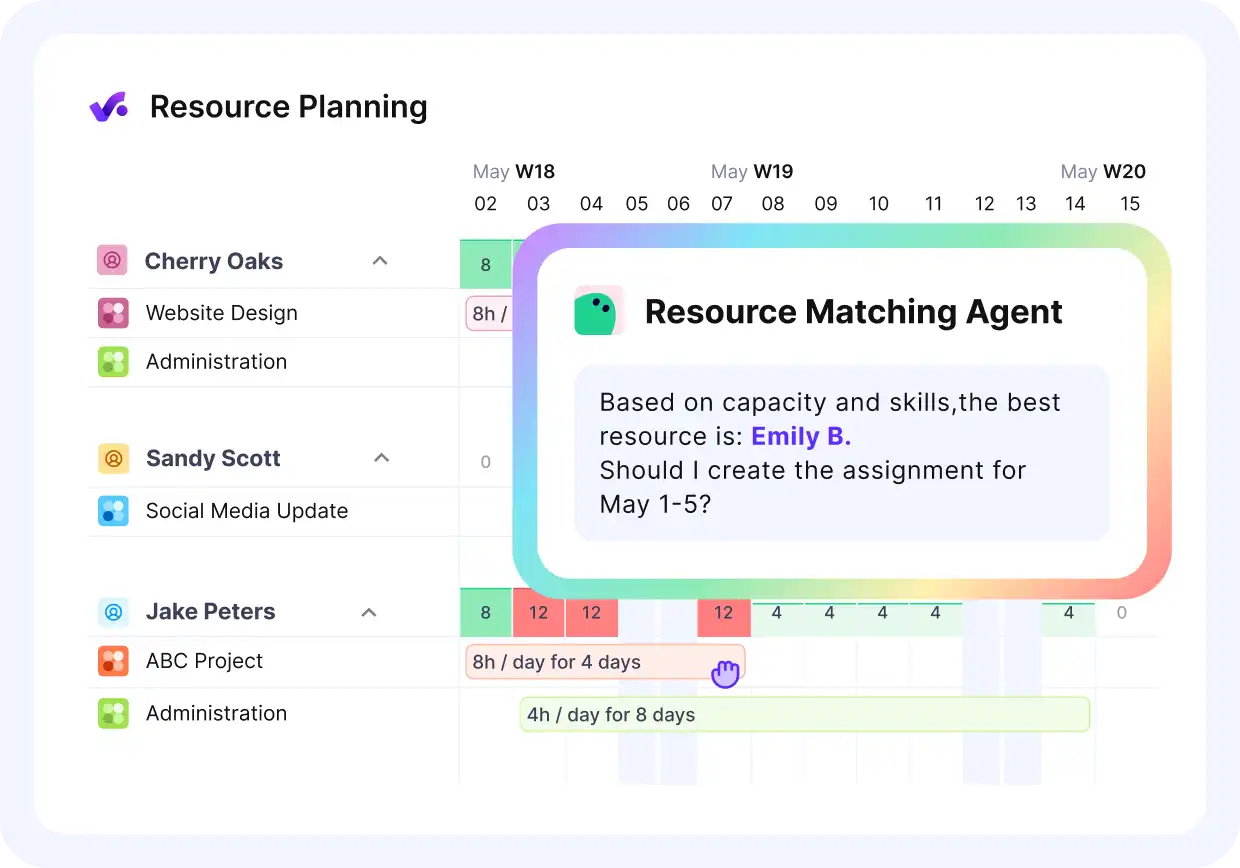
Productive’s AI assistant helps you match people based on available skills.
Correct Overruns Above 10% in Estimates
SPI’s research flags project overruns above 10% as damaging to delivery and client relationships. Project estimate accuracy (actual hours divided by estimated hours) shows how far off your estimates run.
Estimates set booked hours, so an estimate that runs 20% short books 20% too little.
How Do You Report Capacity Numbers to Stakeholders?
You report capacity numbers by giving each stakeholder only the numbers behind their decision, at the cadence they decide.
| Stakeholder | Numbers | Cadence | Decision |
|---|---|---|---|
| Delivery leads | Overbooked weeks and bench time, per person | Weekly | Which bookings to move |
| Resource managers | Capacity gap for the next four to eight weeks | Weekly | Whether a new deal can start on its date |
| Sales | Gap for the proposed start weeks | Before each proposal | Which start date to offer |
| Finance leaders | Billable and forecast utilization against target | Monthly | Whether revenue and margin forecasts hold |
| Partners or directors | Gap trend across quarters | Quarterly | Whether to hire |
Read Utilization Next to Margin
Put billable and forecast utilization in the same monthly pack as the financial reporting they explain. Reading utilization beside financial reporting shows whether a margin change came from hours or from rates.
The monthly view then goes into management reporting, and the quarterly gap trend goes to whoever approves hiring.
Keep Timesheets Current
Every number in these reports depends on timely actuals: timesheets submitted by the end of each week. A late timesheet leaves last week’s booked hours standing in for hours worked. Before each Monday review, count the timesheets still open.
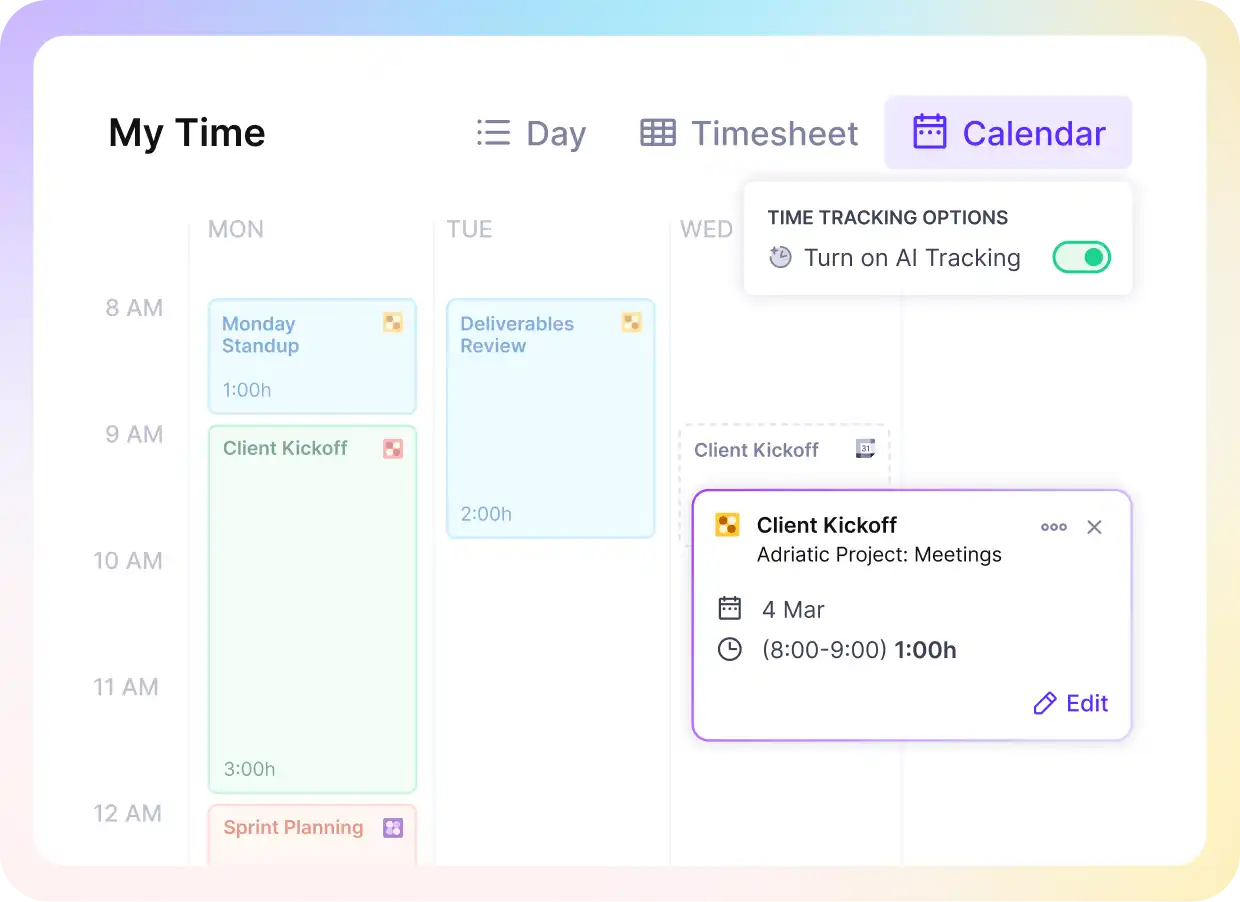
Track time with AI, automatic trackers or convert calendar events to timesheets.
Send Each Stakeholder Their Own Report
In Productive, Pulse sends a saved report on a daily, weekly, bi-weekly or monthly schedule. It can go by email, Slack or Teams, to named people or whole teams. That lets each stakeholder get their own report at their own cadence.

Customize reports for each stakeholder.
Final Thoughts
An average shows whether the quarter fits; weekly numbers show whether each week does. Weekly numbers stay consistent only when available hours, bookings, leave and pipeline come from one system. Split across tools, each input updates on its own schedule, and capacity planning becomes reconciliation.
If you want those four inputs in one system for your Monday review, book a demo with Productive.
FAQ
What Is a Good Utilization Rate?
A good target for billable time is 75%, which SPI treats as optimal, against a 2024 average of 68.9%.
How Do You Calculate Available Hours?
You subtract leave and public holidays from contracted hours, so the example team’s 4,800 becomes 4,624.
What Is the Difference Between Total and Billable Utilization?
The difference is internal time, like meetings and admin, which total utilization counts and the billable figure excludes.
How Often Should You Review Utilization and Bench Time?
Review both weekly per person and monthly per team, matching the cadence each stakeholder decides on.
Which Five Numbers Belong in a Weekly Review?
A weekly review needs five capacity planning KPIs: available hours, total utilization, overbooked weeks, capacity gap and bench time.
Connect With Agency Peers
Access agency-related Slack channels, exchange business insights, and join in on members-only live sessions.
