Resource Utilization – What Is It and How to Calculate It?

Resource utilization tells you what share of the hours you pay for actually earns money. Pulling the number is easy. Deciding what to change once you have it is the hard part.
This guide covers the three resource utilization formulas and one worked example. Then how to read the number by role, and what tracking it tells you about hiring and margin.
Finally, four steps that move it, each using a file you already have.
Key Takeaways
- You need three numbers, not one. One utilization percentage shows whether someone is busy. The next shows whether they are earning, and the third shows what next month looks like.
- Use the hours someone had, not the hours they worked. Hours worked as the bottom number caps everyone at 100%, so overload never shows.
- Every role gets its own target. Employee utilization sits around 70 to 90% for delivery staff. A director at 40% is doing their job.
- A low number usually means not enough sold work. Under 60% points at your pipeline or your scoping, not at how hard people are trying.
Free Capacity Planning Template
Download our template to schedule time for billable vs non-billable tasks, track workloads, and get insights into utilization with preset formulas.

What Is Resource Utilization?
Resource utilization is the share of a person’s available hours spent on billable client work, shown as a percentage. In professional services, project resources are people and their time.
- It measures people and the hours they have available, not machines or software seats. Resource availability is contracted capacity minus time off and public holidays. A part-time designer on 20 hours a week and a contractor on 30 each carry their own baseline.
- Past 15 or 20 people, project managers stop holding those baselines in their head. Answering who can absorb a new client next week turns into guesswork. Resource capacity becomes an estimate rather than a number.
- The percentage tells you how much of the week became client-billable work and where the rest went. The figure only means something when the hours underneath it are right.
Agencies on fixed fees often estimate hours during the pitch and never record what was spent. The billable share is then unmeasurable.
With Productive’s Time Tracking, hours log against projects and services whether the work is billed hourly or flat. The billable split then exists on every piece of work. That is what makes the split measurable on fixed-fee engagements, where delivery cost is usually invisible.
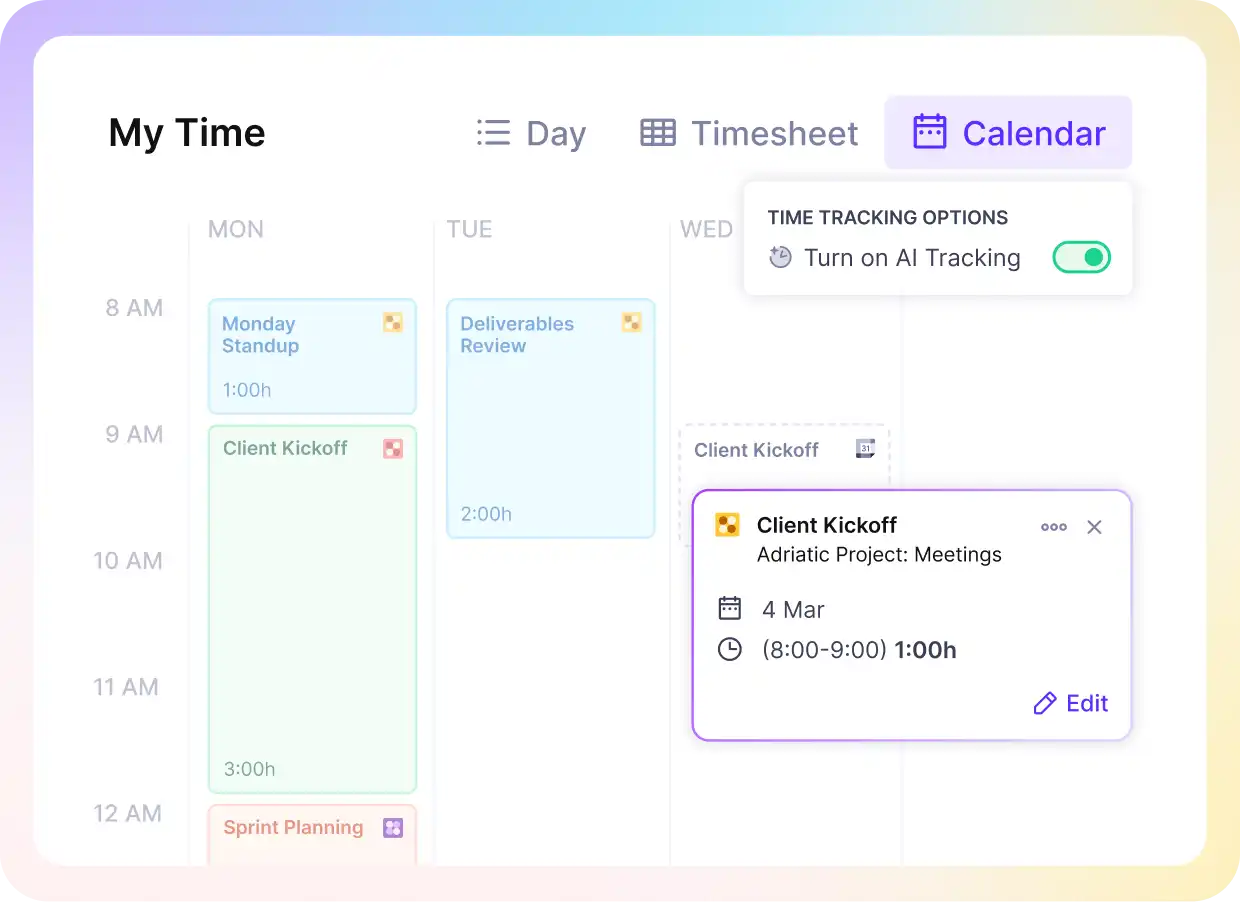
Use Productive’s AI to convert calendar events into time entries.
Utilization in IT and Other Industries
Utilization in IT and other industries measures equipment and materials rather than people. In IT that means servers and the load they carry. Manufacturing applies it to machine capacity, material availability, and how smoothly a production line runs.
Those versions share the arithmetic and almost nothing else. In professional services the problem is different. The resource is a person, and resource availability is what you sell.
Why Is Resource Utilization Important?
Resource utilization is important because it links how your people spend their hours to what the business earns. In professional services, time is the product. Tracking utilization across departments drives four project management decisions:
- Pricing and estimating: a fixed-fee project that absorbs more hours than you scoped shows up here first. You see it before the invoice goes out.
- Hiring: a role above its band for three months is a recruiting signal, not a feeling.
- Margin: every hour worked but not billed is cost you absorb. The billable share sets what each person contributes.
- Retention: people held at the top of their range for months leave. Replacing them costs more than rebalancing.
A 25-person creative agency running at 60% resource utilization agency-wide looks reasonably healthy. Split the same number by seniority and the picture changes. Senior designers and strategists sit at 90%, while junior staff sit closer to 30%.
The average is fine. The structure is not. Seniors are delivering work that belongs one level down. That raises the cost of every hour and cuts margin on engagements priced for a mixed team.
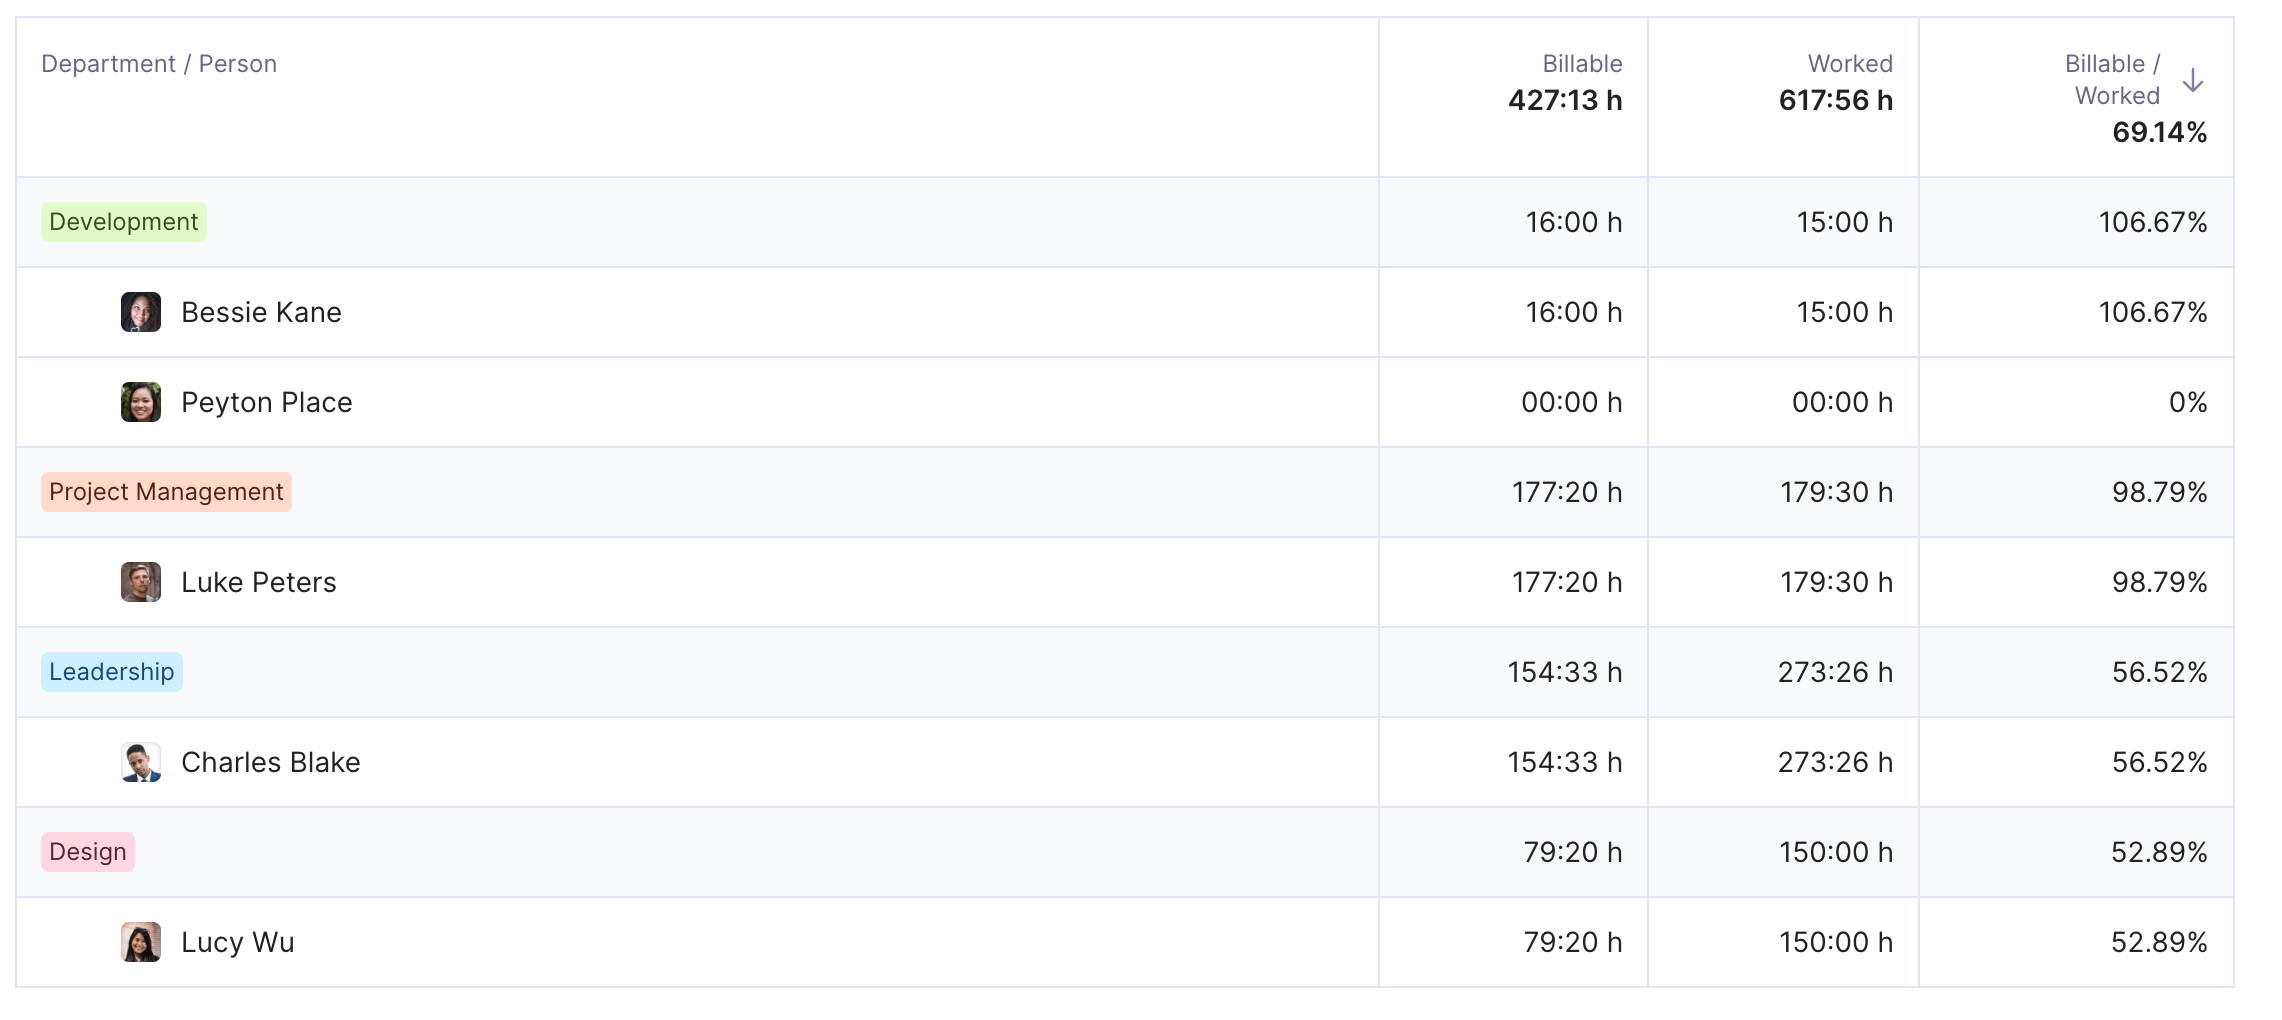
Get instant utilization reports.
Juniors are not getting the reps that grow them into billable capacity. Both groups have a reason to leave within the year.
Burnout arrives at the top end long before anyone complains.
Productive’s Reporting breaks the number down by person, team, and role. You manage the split rather than the average, and rebalance before next quarter’s staffing is locked in.
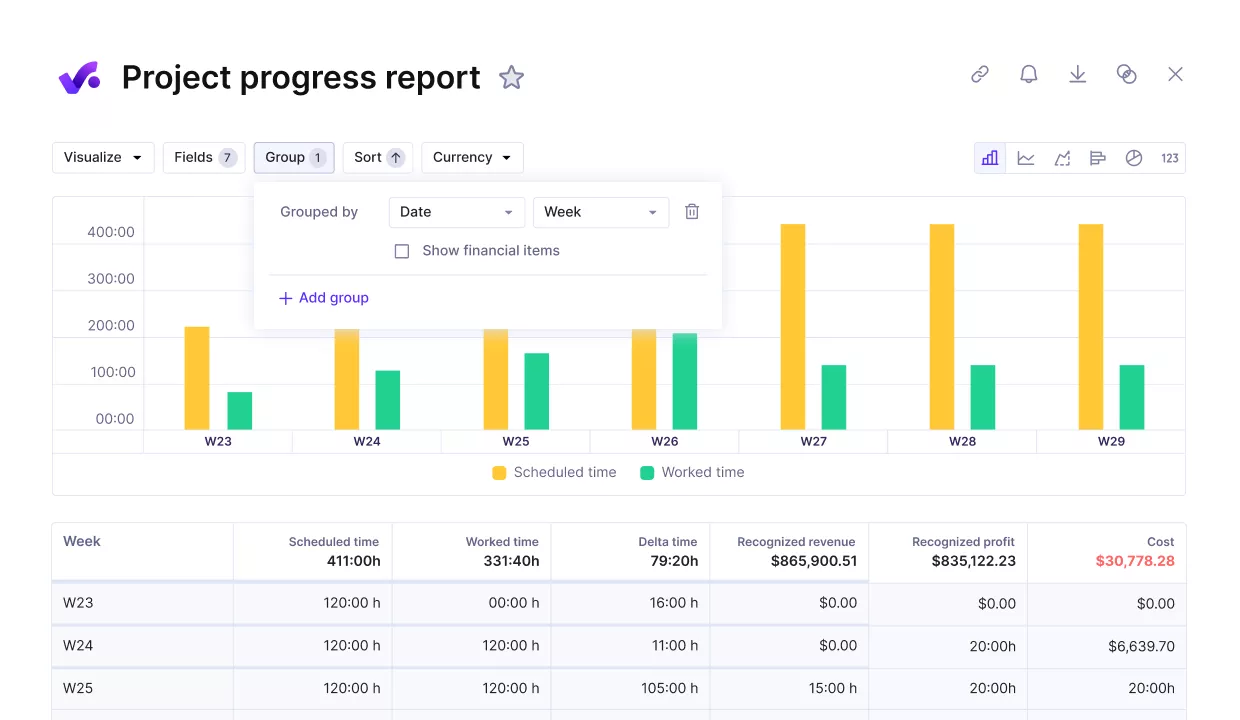
Compare project progress against key performance metrics.
Difference in Resource Utilization vs Resource Allocation
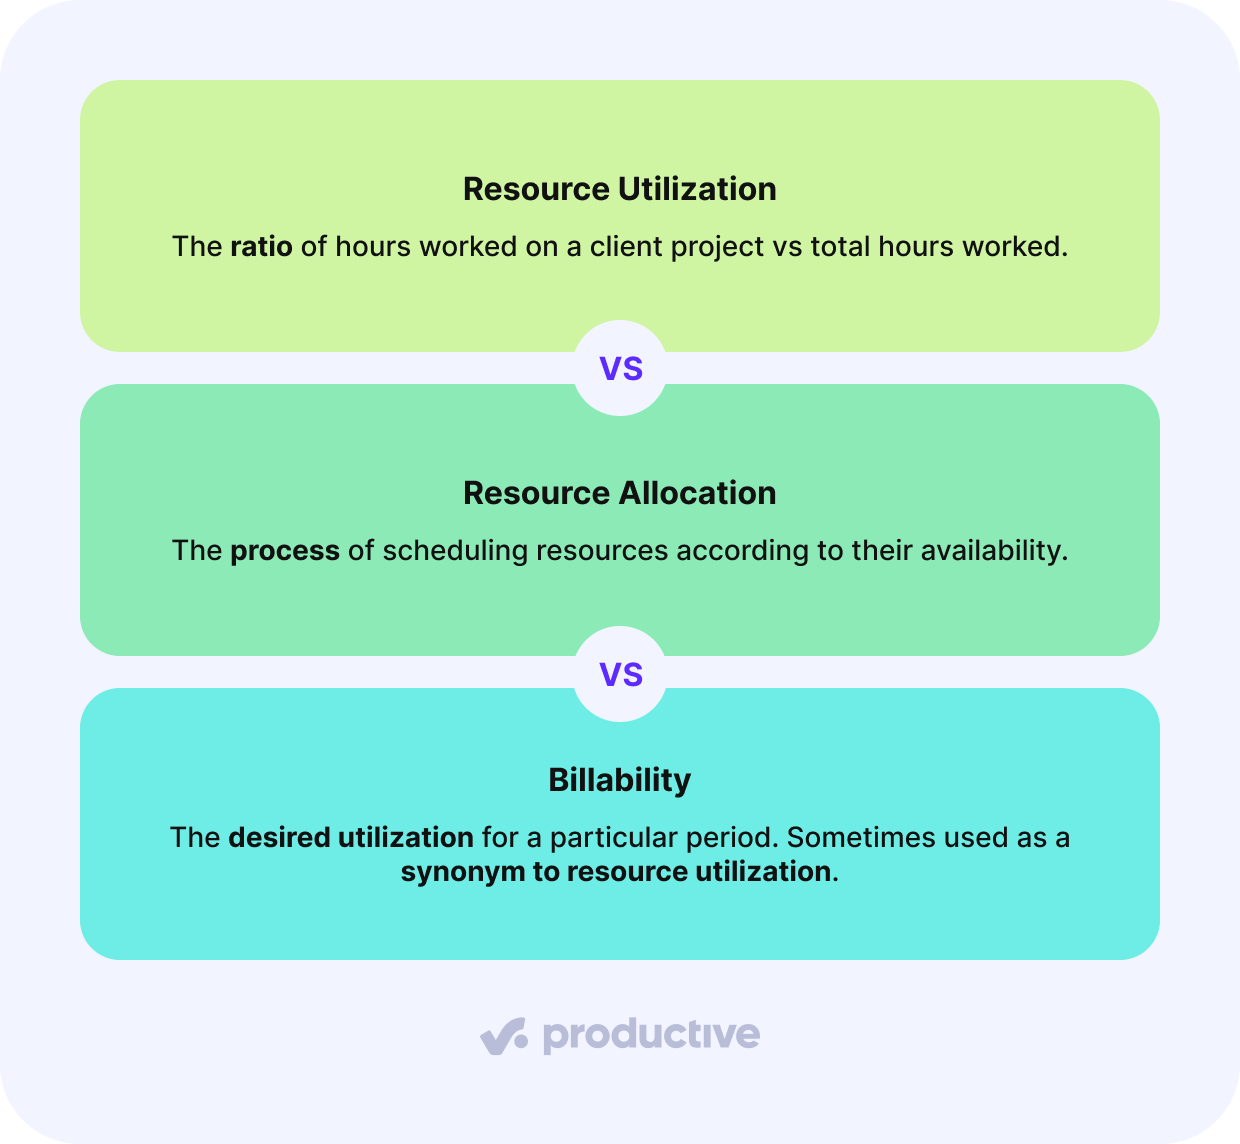
The difference between resource utilization and resource allocation is direction and purpose. Utilization reports backward. It measures the billable share of the week that just closed.
Resource allocation is the process of scheduling people against resource availability, so it commits the weeks ahead.
The plain rule: check utilization to diagnose how hours were spent. Use PM resource allocation to decide who works next. Both sit inside the same resource planning cycle, and each one feeds the other.
In a 25-person social agency, the sequence runs like this:
- A utilization breakdown shows the content team averaging under 60% across the quarter.
- The resource manager matches the campaign’s resource requirements to two writers on bench time.
- The following month’s report shows whether that move recovered billable hours.
Mixing the two up costs money in both directions. A team can look fully allocated on the schedule and still report 52% utilization. That usually points at non-billable work nobody scoped rather than a shortage of client projects.
Resource allocation without a utilization read is guesswork.
Resource utilization without allocation is a number with no action attached. In Productive’s Resource Planning holds the booked hours and logged time lands against them.
The plan and the actual come from one source.
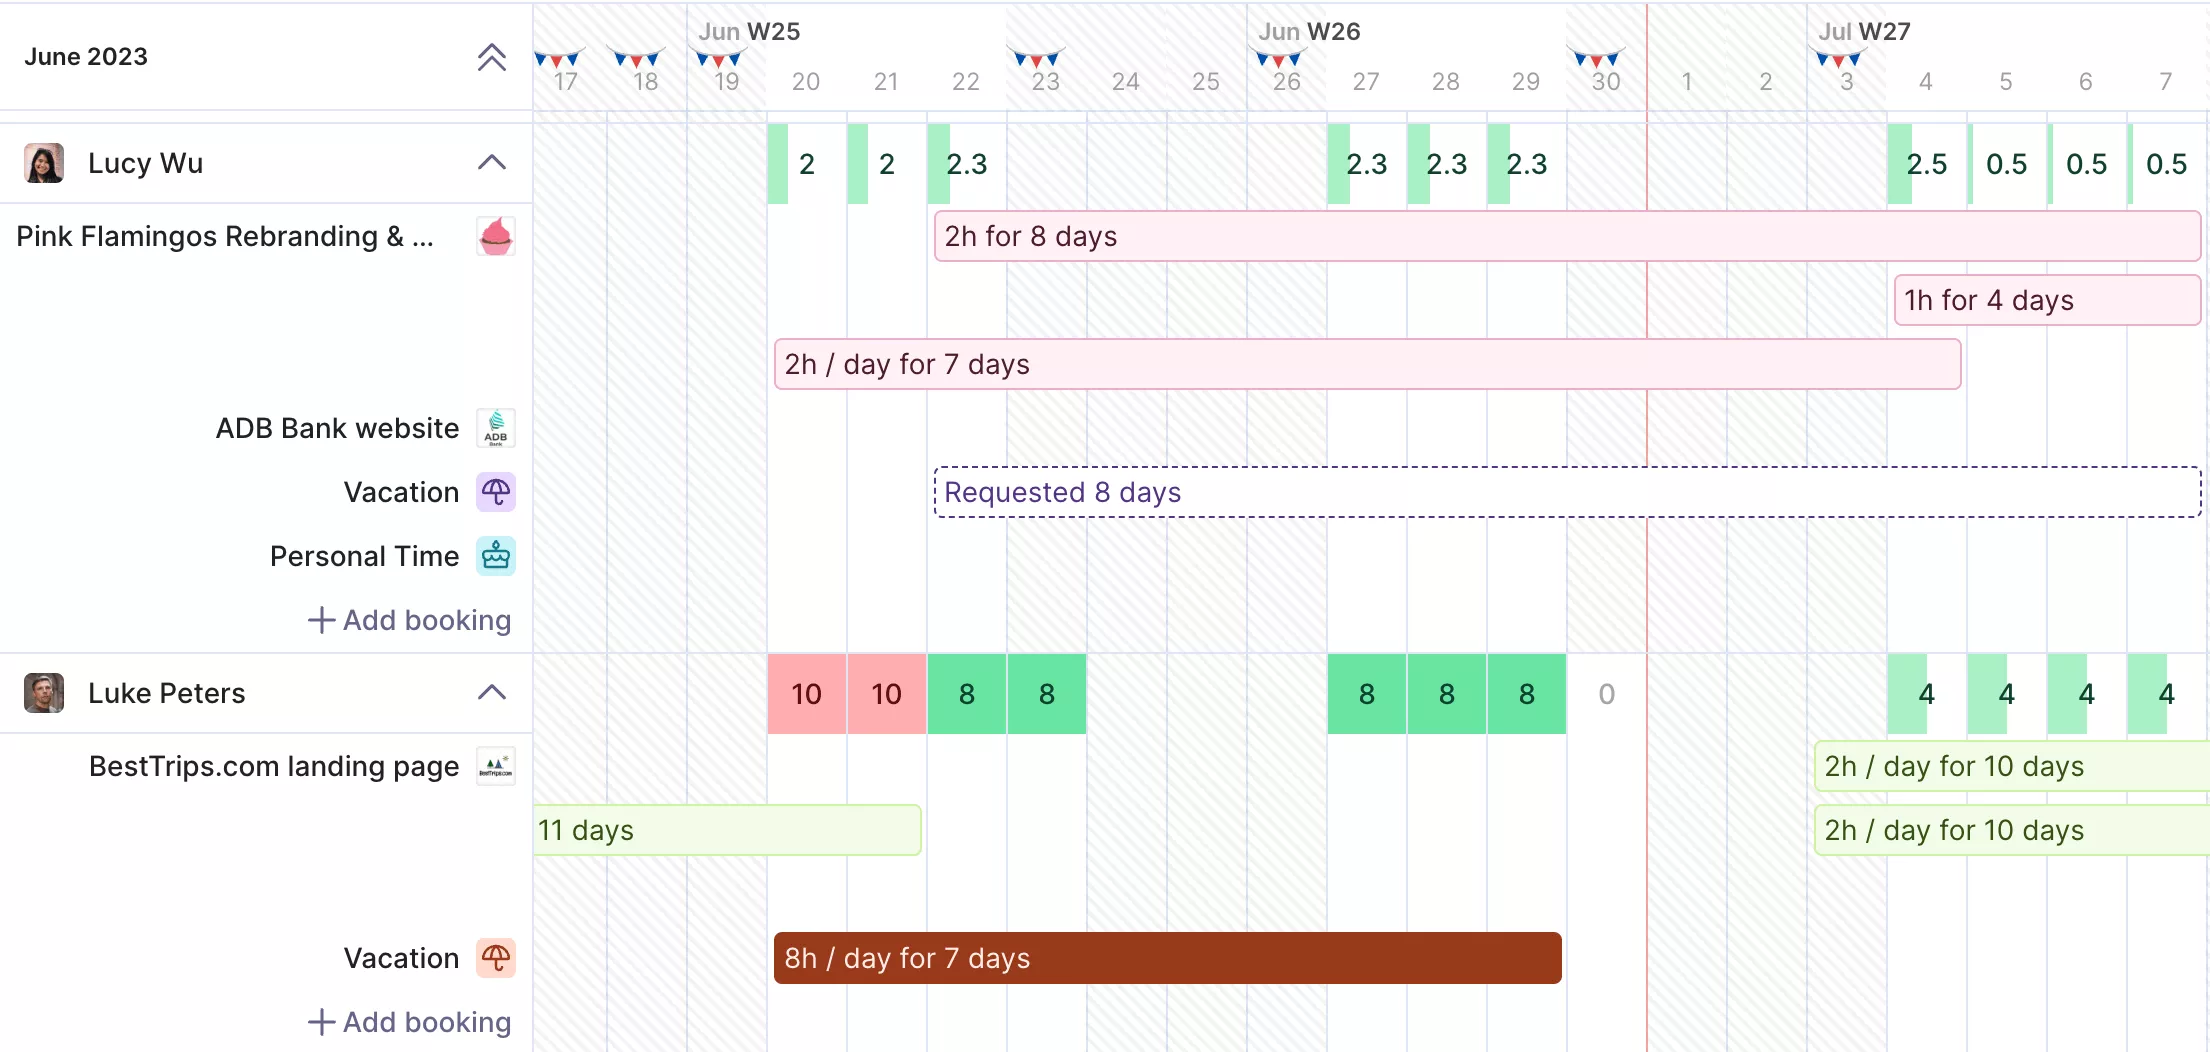
Manage your resources from a single source of truth.
Utilization vs Billability
Billability is the utilization you planned for, and resource utilization is what actually happened. Some firms treat billability as a synonym, which works until the two numbers disagree. When they do, the gap shows how much of the planned work never got billed.
Efficiency rate is a third number people confuse with both. Utilization asks how much of the week was billable. Efficiency rate asks whether those hours produced what you quoted.
Someone at 90% utilization can still post a poor efficiency rate.
What Is the Resource Utilization Formula?
The resource utilization formula divides billable hours by the hours someone had available, then multiplies by 100. Most guides give you that one line and stop. Three resource utilization formulas exist, and each answers a different question about the same person.
Each resource utilization measure shares one denominator, so settle that first.
- Available hours means contracted hours minus public holidays and booked time off.
- A designer contracted for 40 hours, in a week carrying one public holiday, has 32.
Overall utilization = all logged hours / available hours x 100
Billable utilization = billable hours / available hours x 100
Forecast utilization = scheduled hours / available hours x 100
The first tells you whether someone is busy. The second tells you whether they are earning. The third tells you whether they will still be busy next month.
Dividing by hours worked instead caps every utilization rate at 100%. Overtime disappears, and so does the overload you opened the report to find.
How to Calculate Utilization: A Worked Example
Calculating resource utilization three ways for one person is what makes the utilization rate readable. Take the designer above, with 32 hours available. She logs 30 hours that week, and 24 of them are billable.
Her overall figure is 30 divided by 32, or 94%. Her billable utilization is 24 divided by 32, or 75%. Same person, same week, two numbers 19 points apart.
That gap is the useful part, and it is the line between billable and non-billable work. Six hours went to internal meetings, admin, and revisions nobody scoped.
You now know the size of her non-billable load, not just that it exists.
- Report her against hours worked instead and she reads 80% billable. That denominator flatters her by five points and hides the six hours completely.
- Forecast resource utilization runs the same arithmetic forward. Next month she has 136 hours available and 80 already booked, so she forecasts at 59%. That is 41% of her month unsold while this week reads full.
- One number says she is busy, one says what she earned, and the third says go and sell something.
No utilization number survives bad time data. Tracking time is nobody’s favorite task, so keep it simple. Good time keeping software runs a timer straight from the task.
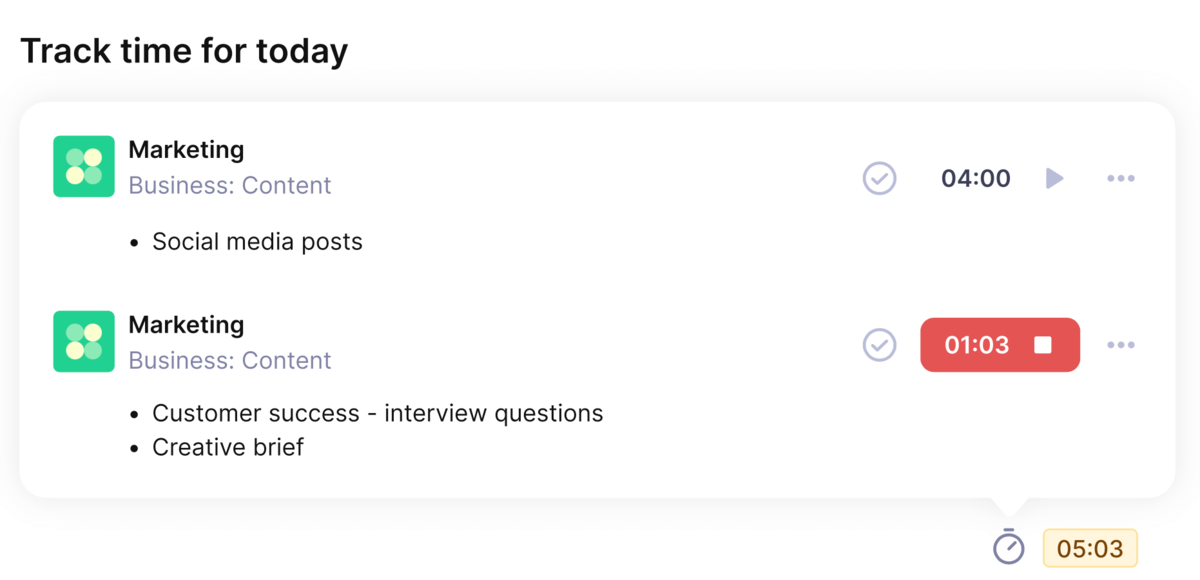
Track time with AI, automatic or manual time trackers.
Stop Rebuilding Your Utilization Report
Productive measures utilization against the hours people actually had available, not the hours they worked. The billable split comes out of the same record your team logs time into.

How Do You Analyze Resource Utilization in Real Time?
You analyze resource utilization in real time by comparing hours logged against hours booked, by person, role and department. A role under its target utilization means you are paying for capacity nobody sold. A role above 90% for weeks means you are quoting work against hours that do not exist.
Act on the gap, not the agency average. Move under-booked people onto live projects, pull scheduled work forward, or hand sales a list of open hours. For over-booked roles, raise rates, renegotiate deadlines, or start hiring.
In Productive, utilization runs against availability rather than capacity, so holidays and time off already sit in the denominator. The Billable utilization by person report shows the same split once a period closes.
That figure answers three separate questions, depending on the decision in front of you.
1. Guide Hiring
Guiding hiring means reading the utilization rate at department level. Design sits at 88% for three months while development runs at 55%. That is a hiring signal and a pipeline problem at once. Recruit into the department that stays full, and sell into the one that does not.
2. Optimize Project Performance
Optimizing project performance starts when a project absorbs more hours than you quoted. Check whether the extra time is non-billable, and why. Unscoped revisions, reopened work, and handovers nobody owned all show up here. Fix whichever of those is costing you, or renegotiate while the engagement runs.
3. Make Strategic Decisions
Strategic decisions about new work rest on forecast utilization across the agency. Booked to 60% for next quarter, you have room for another retainer. Booked to 95%, the next win costs you a hire or a deadline.

That’s a key thing that we get out of the reports that really feeds into our utilization and resourcing. If we know we’re spending 30% of our time on internal projects, then we know we’ve got the capacity to take on more work.
What Can Tracking Resource Utilization Tell You?
Tracking resource utilization answers three questions a project plan cannot. It tells you who has room next month, which engagements are losing margin, and which roles face burnout. Each one is a decision you can act on this week.
In a 10-person agency, tracking utilization might show two developers at 95% for three months. Two others run at 45%. Rebalancing pulls the overloaded pair back toward 80% and lifts the other two to 60%. That moves roughly 48 hours of billable time a month, capacity you were already paying for.
- Resource utilization by person shows overutilization and underutilization in the same chart. Team utilization averages hide both.
- The same view protects margin while work is still open. See an engagement burning hours faster than the budget allows before it closes, and you can still renegotiate scope. You can also move a junior role onto the remaining tasks. After the final invoice, that margin is gone.
- Utilization also gives account leads a straight answer to the question that stalls resourcing. Who has room for this client next month? That answer comes from booked and logged hours in one place, not from memory or four personal to-do lists.
How Do You Improve Resource Utilization?
You improve resource utilization by setting a target utilization per role and comparing booked hours against logged hours weekly. Move work before anyone crosses 100% or drops below 60%. The lever is rarely effort. It is usually scope, pricing, or a pipeline that went quiet three months ago.
Work through these four steps in order. Each needs a file you already have and a number that says whether utilization is the real problem.
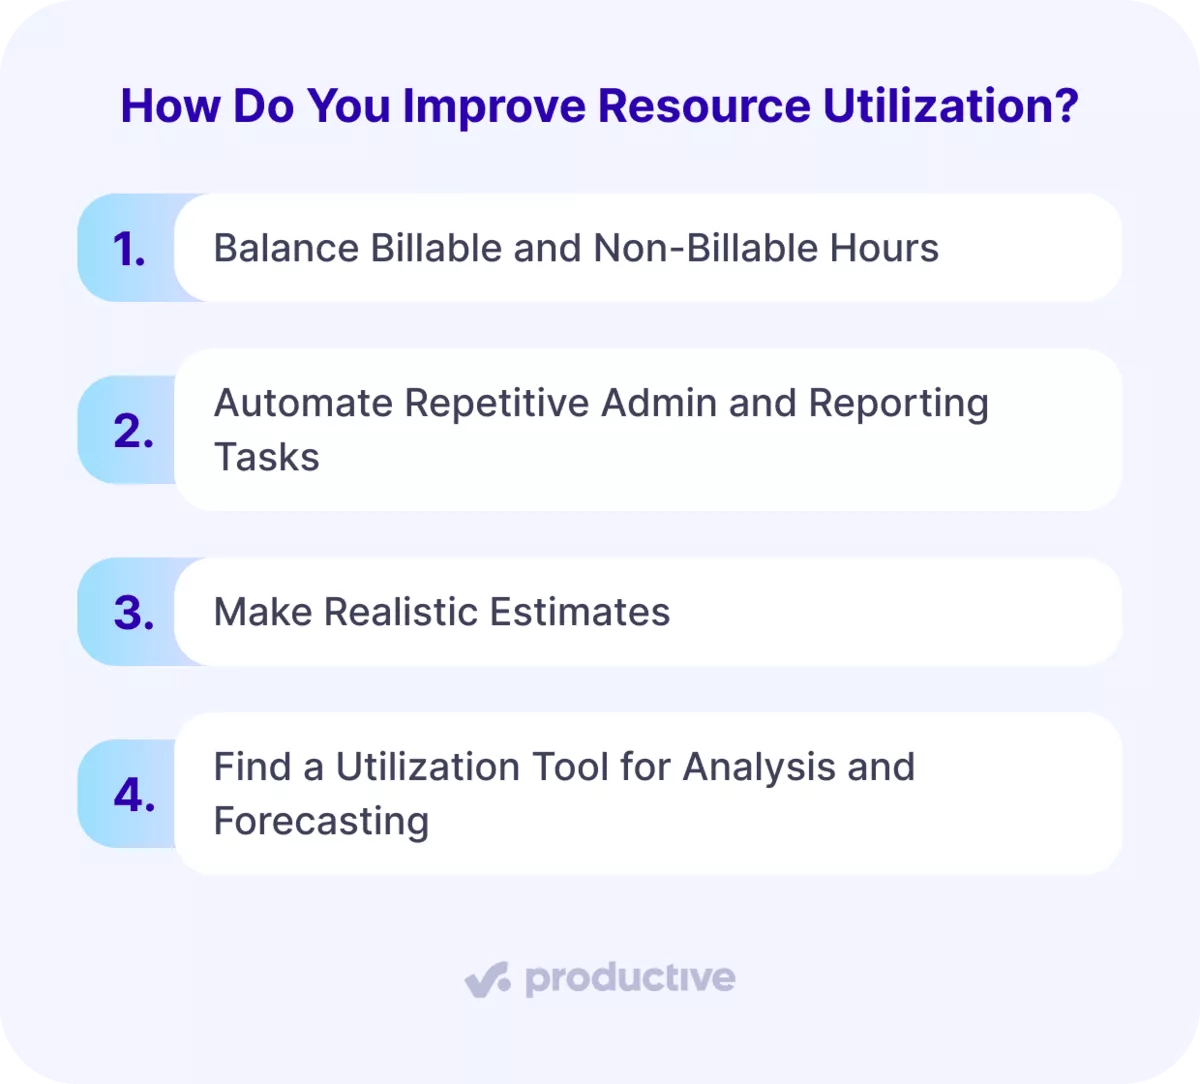
Let’s explore them in more detail.
1. Balance Billable and Non-Billable Hours
Balancing billable and non-billable hours starts with finding out where your agency actually sits. The 2026 AgencyAnalytics benchmarks report found half of agency leaders at 60 to 79% billable. Another 18% reported 80 to 100%, 22% landed at 40 to 59%, and 9% came in under 40%.
Pull last quarter’s timesheets and work out your own utilization rate. Count billable hours against the hours people had available, not against hours worked.
- Under 60% points at pipeline or scope, not lazy weeks.
- Above 80% across a whole agency usually means somebody is absorbing hours nobody logged.
Then set a target utilization rate per role rather than one agency number. Delivery roles, project managers and directors each need their own target utilization band. Around 70 to 90% suits delivery roles.
Project managers who split their week between client work and internal duties sit lower. A director at 40% is not underperforming.
A single agency-wide capacity utilization figure hides all of that. That is why capacity planning tools for agencies report by person. Write each target utilization number down, tell the people it applies to, and review it quarterly.
A target utilization figure nobody has seen is one you miss for reasons nobody can name.
2. Automate Repetitive Admin and Reporting Tasks
Automating admin and reporting tasks starts with breaking non-billable time into categories. Look for any category costing more than four hours per person per week. That total is your non-billable utilization.
Time entry, invoicing, status reporting and data collection all qualify, and each one quietly eats into billable capacity. The test is simple:
- If the task follows the same rules every time and repeats weekly, automate it.
- If it needs judgment, leave it alone.
This matters more than it used to. Allocating time and billable expenses is now the top internal team challenge at marketing agencies, named by 28%. Employee burnout and upskilling tie for second at 15%.
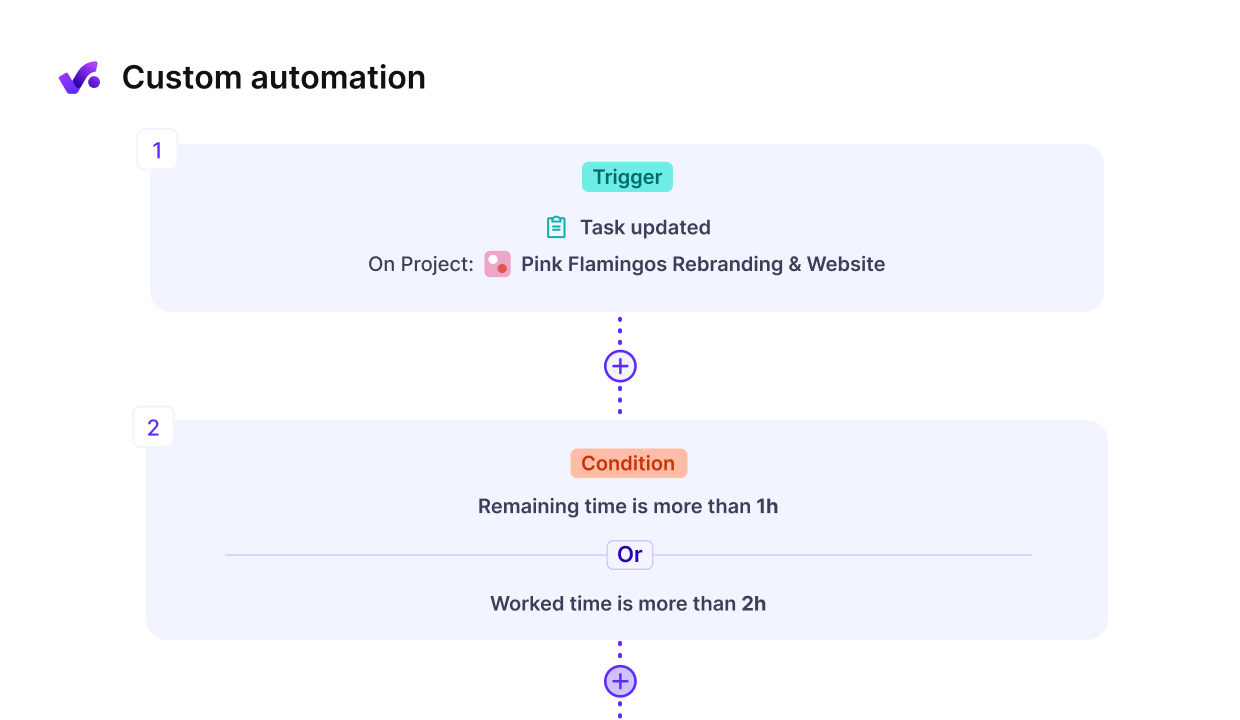
Use Productive’s no-code animations or create AI agents with custom skills
3. Make Realistic Estimates
Realistic estimates come from comparing what you quoted against what the work took. Bad estimates look like a utilization problem and are not one.
Open your last five closed projects and put estimated hours beside actual hours. If three of the five ran more than 20% over, your scoping is the thing to fix. Everyone looks overbooked when work was priced at two-thirds of what it takes.
The same comparison shows project managers when projects go off track and which risks repeat. Run it after every project rather than once a year, so the actuals are worth comparing.
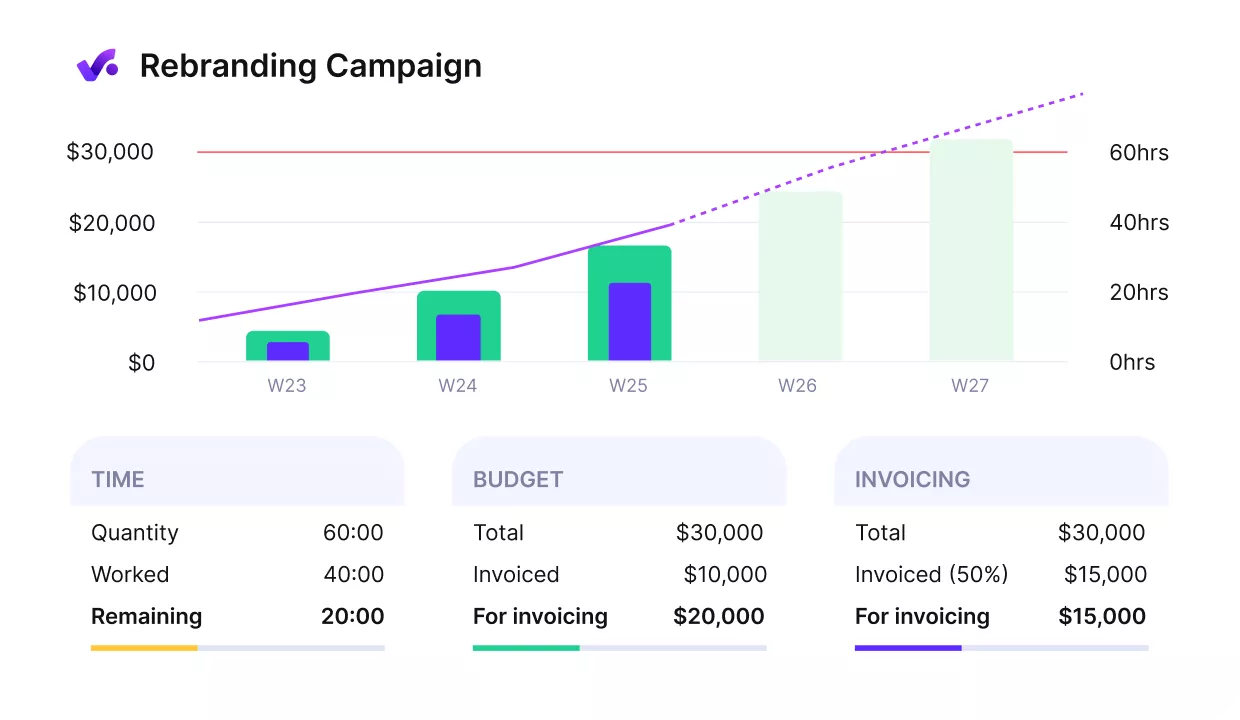
Get early warnings of budget overruns and margin hits.
4. Find a Utilization Tool for Analysis and Forecasting
Finding a resource utilization tool means testing it against analysis you have already done. Most project management and resource management platforms look identical in a demo.
Any resource management software you shortlist has to handle four things:
- Billable hours tracking
- Time off and holiday calendars that feed the denominator
- Workforce schedules you can move people around in
- Financial forecasting and scenario analysis built from that schedule
Now test it. Rebuild last month’s resource utilization report inside the trial and check the number against the one you reported. A tool that cannot reproduce a closed month without a manual export will not forecast the next one either.
Whatever you pick, the resource management side has to report money as well as hours. A tool that schedules people but cannot say what the schedule earns splits capacity planning from margin.

When it came to gathering financial utilization data, we took a lot of rough estimates from Asana and Google Sheets, which led to many inaccuracies and distrust of the data. If even one metric was off, it could throw off the entire calculation, essentially making the data completely useless. We really needed an all-in-one tool.
Why Does Utilization Tracking Belong in One System?
Utilization tracking belongs in one system because logged hours and the money they earn share one record. Most agencies keep time in one tool, budgets in a spreadsheet, and the schedule in a third. Every figure is then a reconciliation of three exports, out of date by the time anyone acts.
Our business decisions are never made on an inner feeling or intuition. Productive gives you answers to questions like what’s the profit, how much are the expenses, what’s the projected revenue, what’s the utilization? That entire set of key metrics is what gives management a basis to move forward.
Keep logged hours, booked capacity, and budgets where the work is delivered. The billable share becomes a by-product of delivery, and resource utilization stops being a monthly exercise somebody dreads.
The same history then does the forward work. You price the next engagement off hours people really spent. Resource planning for next quarter runs off bookings that already exist, not a best guess. A project budget stops being a number you defend and becomes one you can see moving.
Resource management and financial management in one system means nobody rebuilds resource utilization each month. You read it in the week the work happened, while there is still something you can change.
Book a demo to see how Productive calculates and reports utilization.
Connect With Agency Peers
Access agency-related Slack channels, exchange business insights, and join in on members-only live sessions.
