Customer Profitability Analysis: Formula, Steps, Forecast

Customer profitability analysis sets what each client pays you against what it costs to serve them.
In practice it breaks on the cost side. Hours get logged late and overhead never reaches the client record. The retainer that looks healthy on the invoice absorbs your senior capacity.
This guide includes the definition and the formula worked through with real numbers. Then what a client ranking changes about your pricing and staffing, and the benefits that follow.
We cover the six steps, a monthly forecasting method, and the three challenges that slow the work. We close on the levers that lift every account and what to do with clients costing you money.
What Is Customer Profitability Analysis?
Customer profitability analysis (CPA) is a client-level accounting practice that ties revenue to the cost of delivering the work. It measures what each account brings in against what it costs to serve. One company-wide figure hides which relationships are subsidizing the rest. Services firms call it client profitability analysis. Product profitability analysis applies the same logic to a product line.
Why the Cost Side Works Differently for Services Firms
The cost side is built from timesheets, and timesheets move every week. Two accounts on identical fees can land far apart. The gap comes from who does the work and how many hours get logged. Unbilled scope the team absorbs widens it further.
A senior-heavy delivery mix costs more per hour than a junior one. That is one of the key drivers of agency profitability.
The arithmetic runs like this. Billable hours at cost rate, plus non-billable account management and rework, plus an overhead allocation. Set that total against invoiced revenue for the same period.
How to Calculate Customer Profitability? Customer Profitability Formulas
You calculate customer profitability by subtracting the cost of serving a client from what you invoiced them. Divide what is left by that revenue to get a percentage.
Pull the invoice total for the period. Price the logged hours at each person’s fully loaded cost rate (salary, benefits, and payroll taxes). Add subcontractor fees and a share of overhead. Which costs you subtract depends on what you sell.
- Professional services: the invoiced fee, minus logged hours at internal cost rates, minus subcontractor invoices and allocated overhead.
- SaaS: lifetime revenue from one account (Customer Lifetime Value), minus the cost of winning it (Customer Acquisition Cost).
- Manufacturing: what the customer paid, minus materials, factory labor, and machine time. That is product profitability analysis.
Worked Customer Profitability Example
Take a brand agency client billed $12,000 for a website build.
- The team logs 80 hours at a fully loaded cost of $85 per hour.
- Delivery costs $6,800, gross profit is $5,200, and the gross margin is 43%.
- Overhead adds $820 at $10.25 an hour, so net profit is $4,380 and the net margin is 36.5%.
Both figures belong in your agency profitability metrics.
At 43% gross on a fixed fee there is not much room left. Model the same job at 110 hours. Delivery cost rises to $9,350 and gross margin falls to 22%.
Read that figure next to utilization and the other agency KPIs. It tells you whether the cause is your price or your hours.
A spreadsheet handles this fine for five clients. Past that, hours, cost rates and invoices sit in separate files that someone refreshes weekly. Every figure you quote is already out of date.
Budgeting in Productive holds the rate card per client and tracks time and costs as work runs.
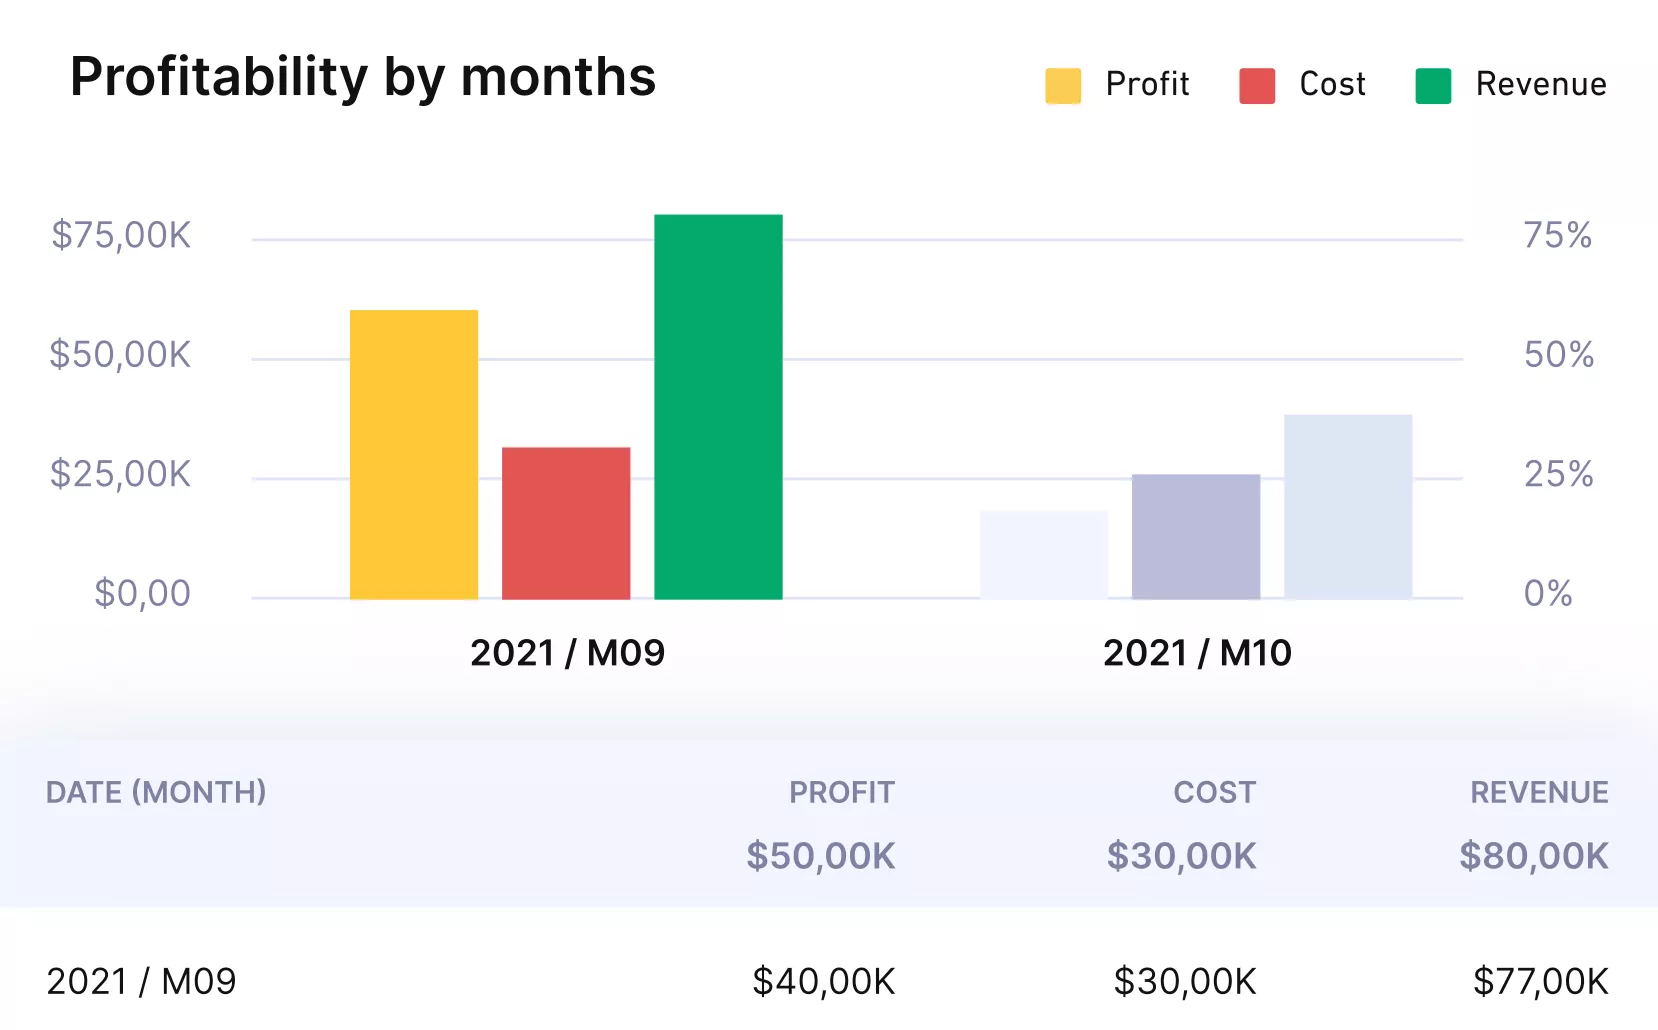
Get instant client profitability reports with Productive.
Two formulas do the work. Delivery costs are logged hours at fully loaded cost rates, plus subcontractor and expense costs.
- Gross margin % = ((invoiced revenue – delivery costs) ÷ invoiced revenue) × 100
- Net margin % = ((invoiced revenue – delivery costs – allocated overhead) ÷ invoiced revenue) × 100
Automate Your Customer Profitability Analysis
Use Productive’s built-in profitability and overhead tracking to see your margins in real time.

What Should You Do With Your Profitability Results?
With your profitability results, sort every client from highest to lowest margin. Then work the two ends of that list. At the bottom sit the accounts earning below your target. Reprice them, change who delivers the work, or drop them.
At the top sit the accounts that already fund the business. Those get protected staffing and the next upsell conversation.
- Move routine work down a level on the weak accounts. Resizes, monthly reporting, and status decks go to junior staff, while senior hours stay on concept and strategy.
- Use the ranking when you staff the week. If two projects want the same designer, they go to the higher-margin one. That is how you improve cost efficiency without cutting anything.
- Set a monthly hour ceiling per low-margin client. Agree the cap with the account manager and review anything logged above it.
- Take renewal and upsell talks to the top of the list first. Those relationships already cover overhead, so their delivery dates come first when you are scheduling resources across multiple projects.
What Are the Benefits of Understanding Customer Profitability?
Understanding customer profitability gives you a margin ranking, better-informed marketing spend, and sharper service line decisions. It also shows where costs come from, strengthens retention, and produces a year-end number you can defend.
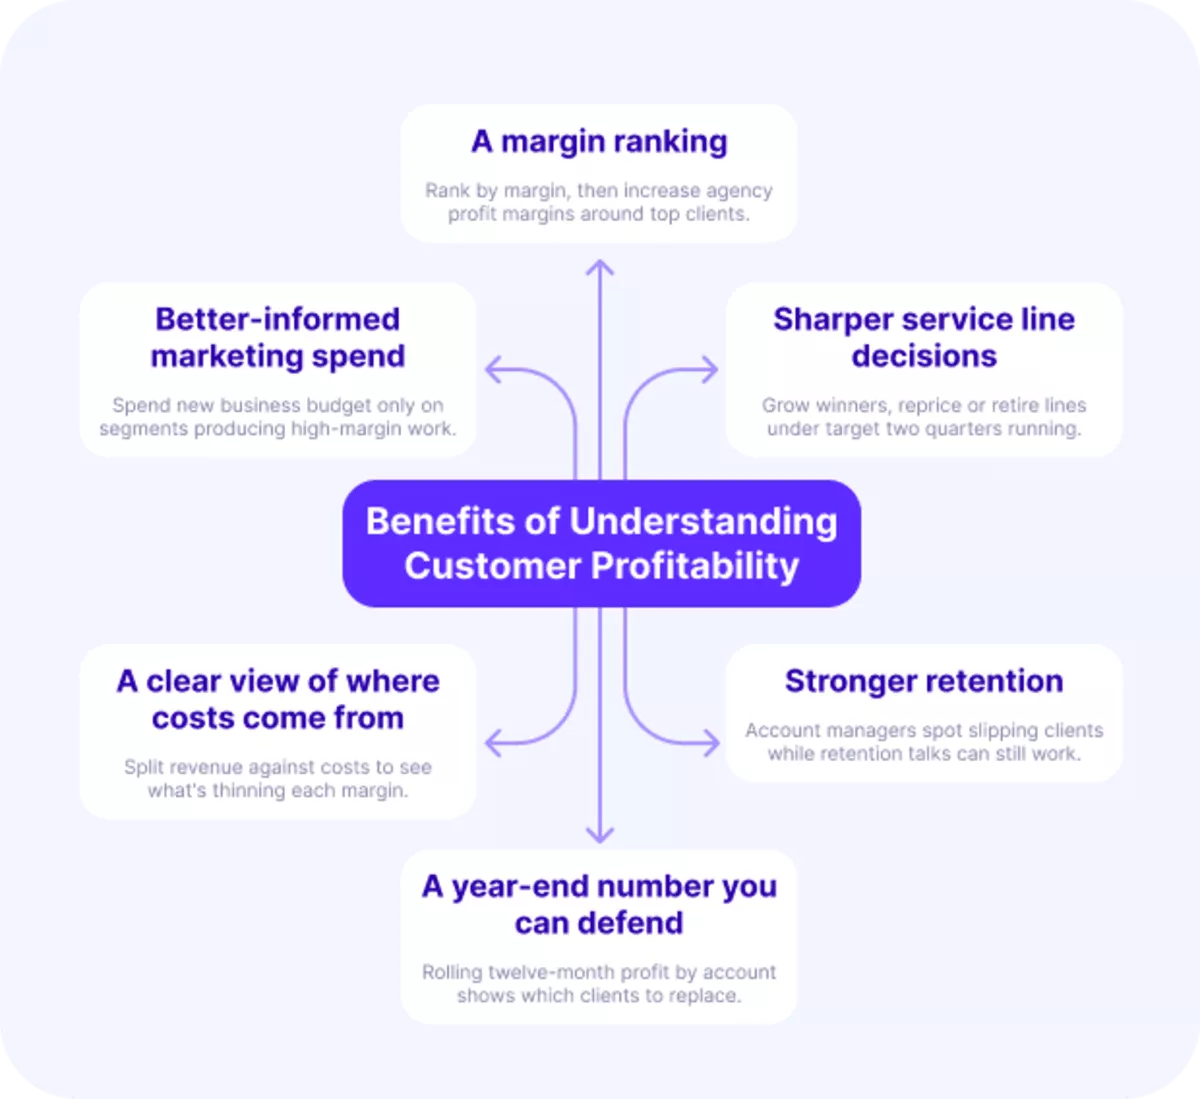
Each one changes a different decision, from who you pitch next to who you staff first.
- A margin ranking: Sort by margin. A $200,000 client at 9% falls under an $80,000 client at 45%. Build around the leaders when you increase agency profit margins.
- Better-informed marketing spend: Learn which industries and service types convert into high-margin work. Aim your new business budget at those segments only.
- Sharper service line decisions: Margin by service line shows which offers to grow and which to price up. A line under target for two quarters gets repriced or retired.
- A clear view of where costs come from: Split revenue against logged hours, contractor invoices, and allocated overhead. The split tells you whether a thin result came from underpricing, over-servicing, or too senior a team.
- Stronger retention: Account managers who see which relationships pay the bills know where to spend review time. A client slipping for two quarters gets a retention conversation while there is still time.
- A year-end number you can defend: Rolling twelve-month profit by account names the clients to replace this year. That is the number your board asks about.
What Are the Main Steps for Customer Profitability Analysis?
The main steps are: collect data, assign costs, calculate margins, segment clients, plan actions, and review quarterly. Below, we break down the whole process in steps you can replicate.
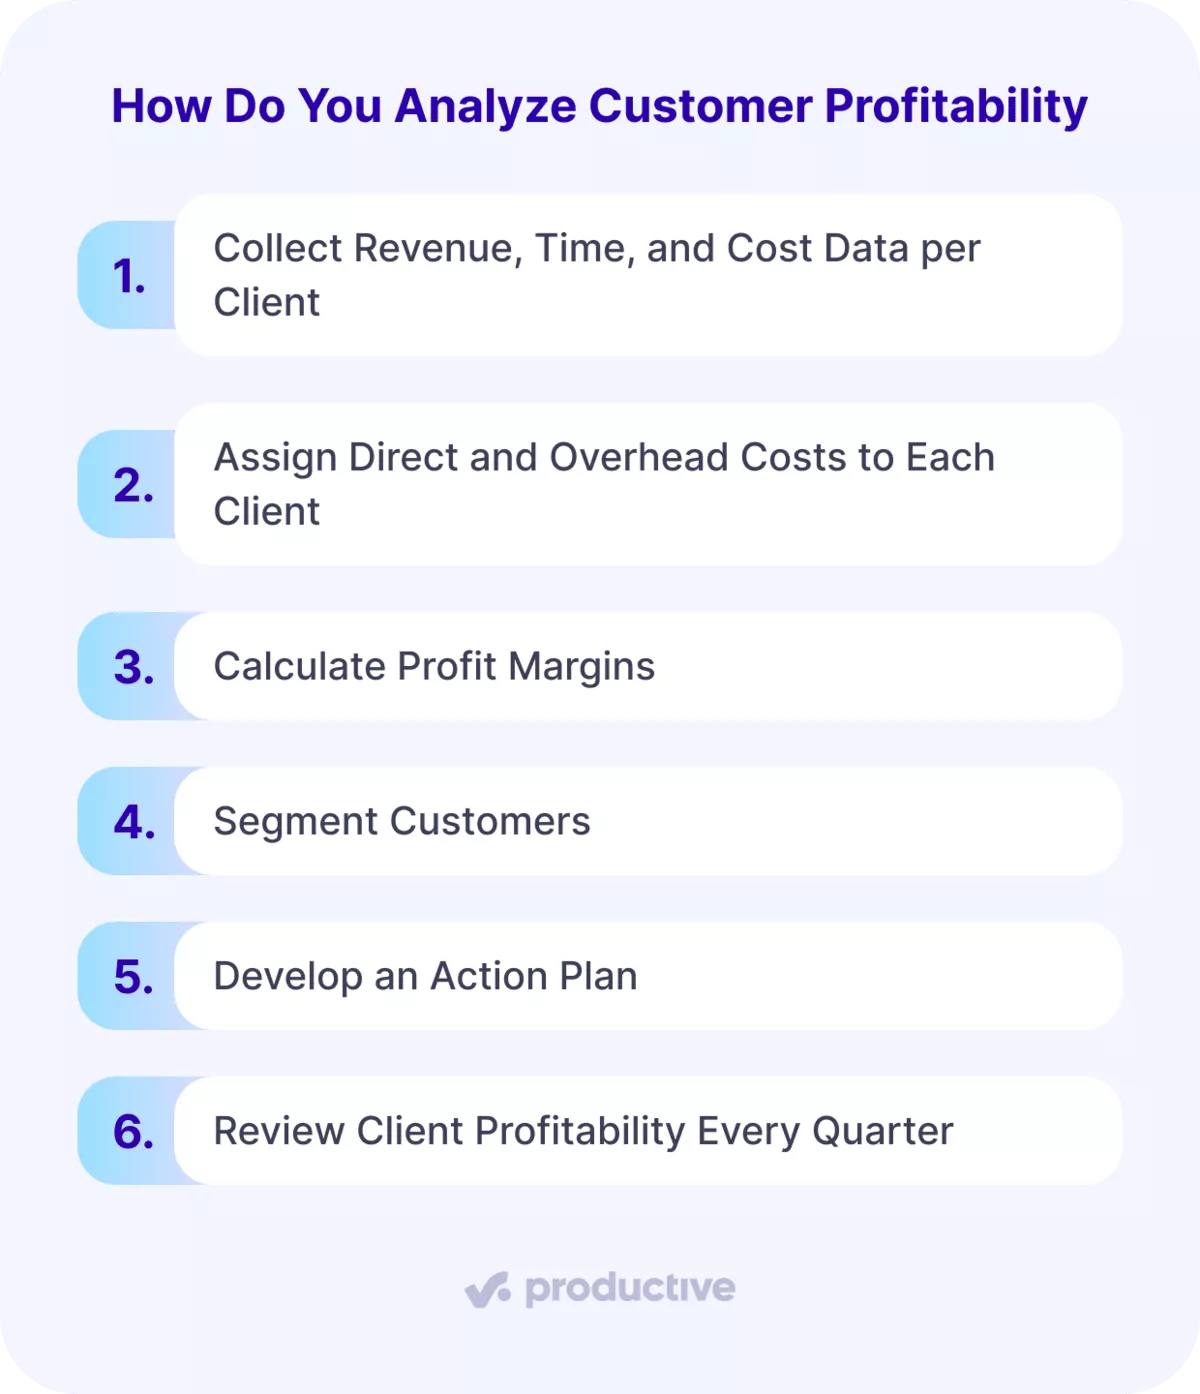
1. Collect Revenue, Time, and Cost Data per Client
Export three files covering the same 90 days. Invoiced revenue per client from billing, logged hours per person per client, and subcontractor invoices. Add each person’s cost rate as a column on the hours file.
You are done when no week of time is missing. Chase the gaps with the people who own them before you calculate anything. A spreadsheet someone refreshes by hand dates every figure you quote.
2. Assign Direct and Overhead Costs to Each Client
Price each person’s logged hours at their fully loaded cost rate. Split overhead across total hours worked so no account carries another’s rent. A $5,000 monthly facility cost across 488 worked hours adds $10.25 to every logged hour.
Calculating agency overhead covers what belongs in that pool. Apply the same per-hour figure to every account, including the small ones.
3. Calculate Profit Margins
Subtract delivery costs and allocated overhead from invoiced revenue for the same period. Divide the result by revenue. Run it per client and per month. A 90-day average lets a bad March hide inside a good quarter. Set the flag line at your own target margin and mark every account under it.

From a managerial point of view, the main benefit of the tool is seeing your profitability in real time. It’s there. We don’t have to calculate it or ask for financial reports from our accountant.
ENKI is a small team that runs profitability without a finance report.
4. Segment Customers
Sort the list into four groups by revenue and margin, high and low in each. That gives you four boxes: high-high, high-low, low-high and low-low. High revenue with low margin is the box that costs you most.
The fee is large enough that nobody questions the hours behind it. Name the accounts in each group before you go further.
5. Develop an Action Plan
Give each flagged account one owner, one dated action, and a target margin for the next review. Record five fields in one sheet. Client, current margin, target margin, the change agreed, and the date it happens.
An action with no named owner and no date will not survive a busy month.
6. Review Client Profitability Every Quarter
Put the next review in the calendar for the same week next quarter. Re-run the three exports before it. A flagged client that has not cleared your target in two quarters means the action was wrong. Pick a different one.
How Do You Forecast Client Revenue and Margin by Month?
You forecast client revenue and margin by month by pricing the hours you have already booked. Multiply each client’s planned hours by role against agreed billing rates. Subtract the cost rates of the people booked, then spread overhead across those months.
Carry the website build forward. Its 80 hours split across two months, 48 in July and 32 in August. The senior concept work lands first. At $150 an hour the client is billed $7,200 in July and $4,800 in August.
July costs more to deliver. Those 48 hours run at a $95 average cost rate, so delivery costs $4,560 and overhead adds $492. July nets $2,148, a 29.8% margin. August runs at $70 and nets $2,232 on smaller revenue, a 46.5% margin.
Same client, same fee, two months that look nothing alike. A quarterly average would have shown 36.5% and hidden both.

Forecast your profits and get early warnings of budget overruns and margin hits.
Unsigned work enters at its win probability (the chance you assign a proposal before it closes), not full value. You hold the four inputs it needs: project schedules, staffed hours by role, agreed rates, and your overhead allocation.
Productive shows forecasted profit per budget and converts your pipeline by date. A thin month appears while you can still move people onto it.
Top Challenges in Customer Profitability Analysis
The top challenges of customer profitability analysis are getting timely data, saying no to scope creep, and forecasting accurately. Below we cover each challenge, how it manifests and how to solve it.
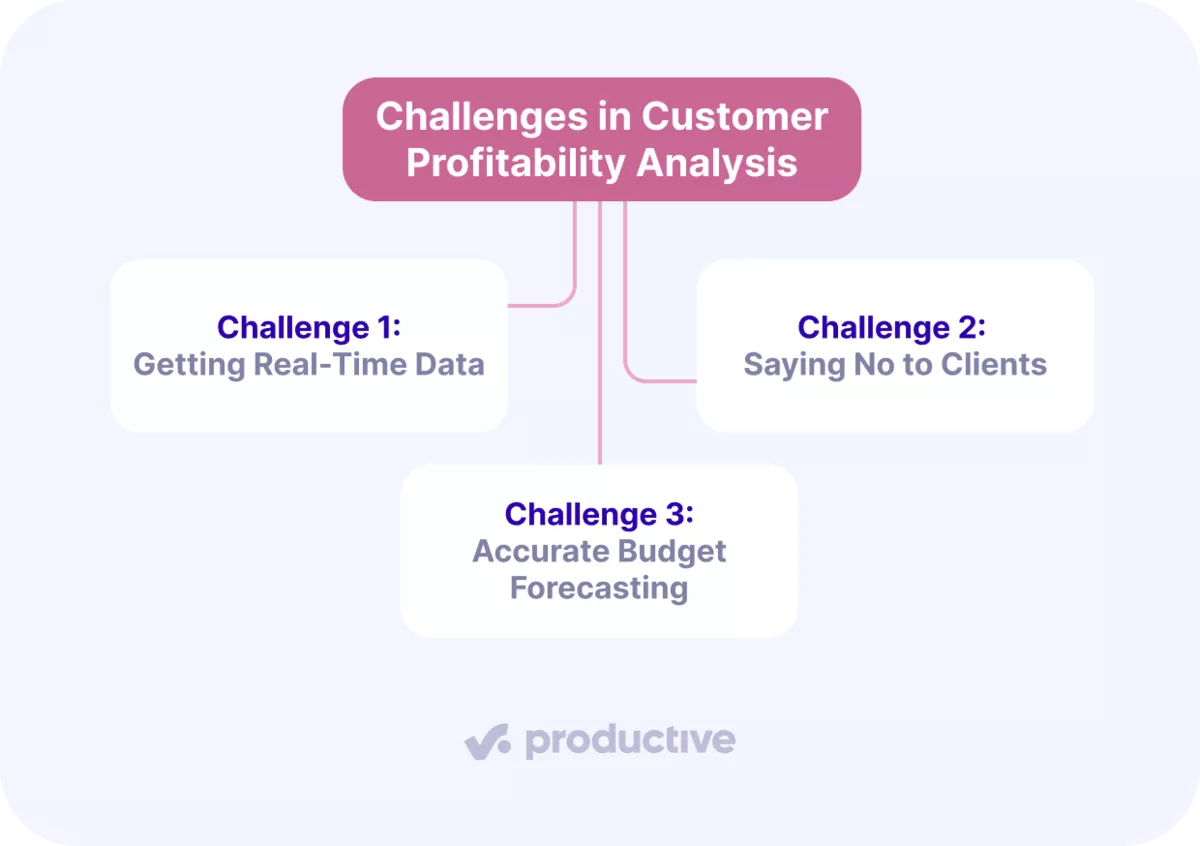
Challenge 1: Getting Real-Time Data
Getting real-time data breaks on the join. Hours live in your time tracker and invoices in your accounting tool. The two exports rarely share a client ID.
So somebody rekeys the match by hand each month, and the figures land describing a month that already closed. Fix the join before you fix the reporting. Agree one client identifier that both systems write to, and export on that key.
Then set one test for whatever setup you land on. A per-client margin figure should take minutes to produce, not a day of exports. Anything slower and nobody has the number in front of them at a renewal call.
Challenge 2: Saying No to Clients
Saying no works when the account manager has a written trigger to point at. Without one it stays a judgment call made under pressure, and the answer is usually yes.
Over-servicing, meaning unpaid work you absorb outside the agreed scope, reaches the margin long before anyone names it. Agree an hour threshold per client per month. Four hours is a workable starting point on a retainer.
Anything above it goes back as a change order naming the hours, the price, and the new delivery date. Log the requests you absorb anyway against that client. Hours nobody logs disappear into non-billable time, and the margin reads fine while the team works late.
You know the trigger works when change orders start arriving. If a quarter passes without a single one, the threshold sits too high or nobody is watching it.
Challenge 3: Accurate Budget Forecasting
The hard part of forecasting a client budget is the cost side. It keeps moving after you have committed to the price. Salaries rise mid-year, a senior stands in for a junior who left, and a subcontractor quotes high.
A fixed fee agreed in January can lose four points by June with no extra hour logged. Re-run the cost rates in your forecast whenever payroll changes.
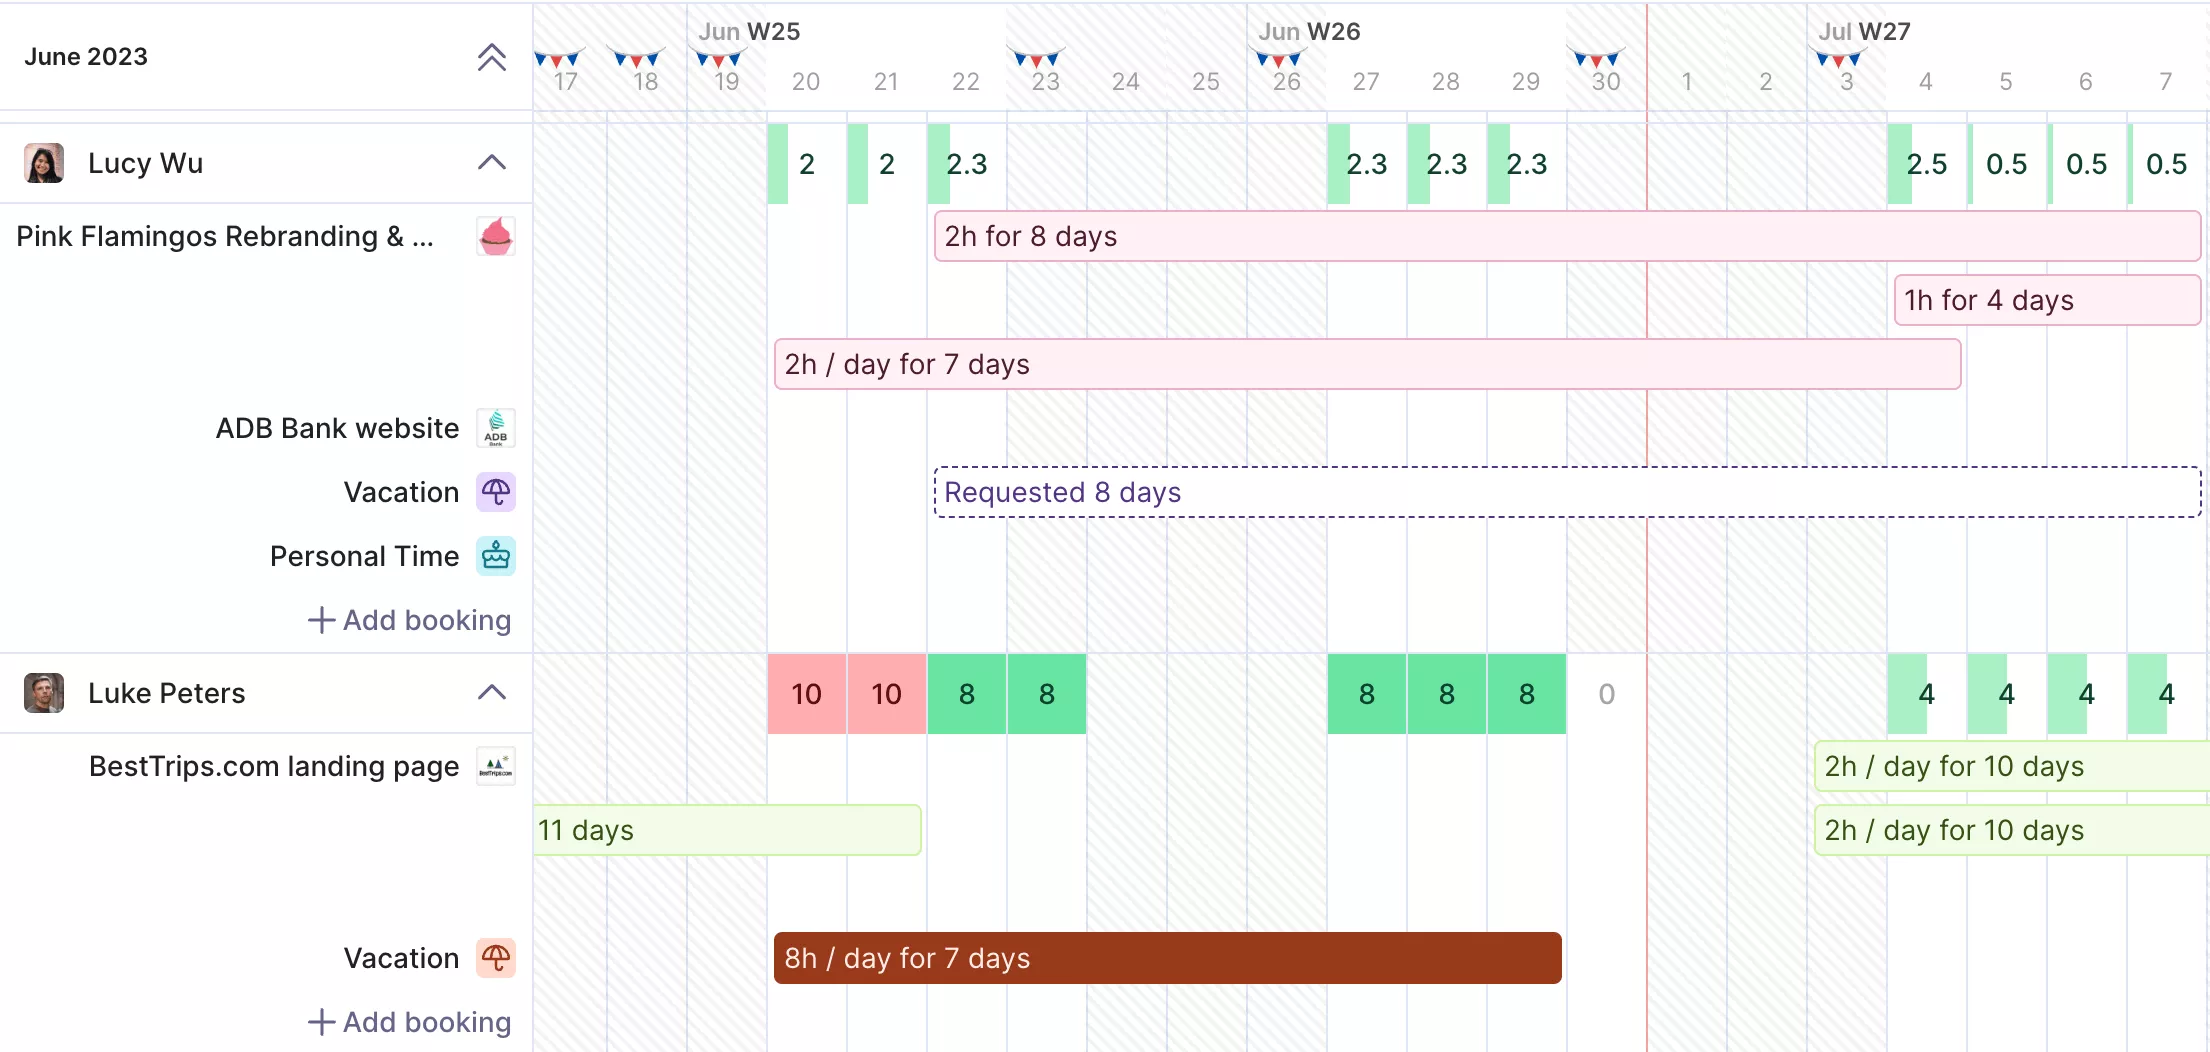
Productive forecasts key business metrics based on your resource scheduling
How Can You Improve Customer Profitability?
You improve customer profitability by changing how the business prices and delivers work. Ranking your clients fixes one account at a time. These levers change the inputs that set cost and price across all of them.
- Match the pricing model to the work. Fixed fee suits scoped projects, retainers suit ongoing work, productized services suit anything you deliver the same way twice.
- Refresh your rate card every year. A rate set three years ago erodes what you keep while salaries and software costs rise.
- Cut the rework that never reaches the client. Count the hours going into revisions and repeated handoffs, then fix the brief or the approval step causing them.
- Keep the people who know the accounts. Each departure adds recruitment fees, ramp-up time, and senior hours spent covering live work.
- Start renewal reviews 60 days out. Check the account’s numbers and its scope before the client raises the subject, so the conversation starts from data.
What Should You Do With Unprofitable Clients?
With unprofitable clients you have three moves: renegotiate scope and price, cut delivery cost, or offboard the account. Flag any client sitting below your target for two quarters, then pick one move and give it an owner.
Renegotiate when the fee stopped matching the work. Say a retainer has held at the same monthly fee for two years while the deliverables doubled. Bring the logged hours and the original scope to the renewal call. Show what the fee now buys, then propose a higher fee or a smaller scope.
Cut delivery cost when the fee is fair and the team is too senior for the job. Move reporting, resizes and production work to junior staff, and keep senior hours on strategy. The account comes off your flag list once it clears target for two consecutive quarters. The same test works one level down, at project profitability per job.
Offboard when neither of the first two moves closes the gap. Give the notice your contract requires and hand over files and access in writing. Book the freed hours to the accounts at the top of your ranking.
Final Thoughts
A client ranking is only worth building if something changes on the accounts at the bottom of it. The work that pays comes next. The repricing call, the different delivery mix, the notice you finally give.
Rank your clients this quarter, pick one move per flagged account, and check the same list next quarter. If you want those numbers without three exports and a rekey, Productive keeps them in one place.
Book a demo and start today.
Connect With Agency Peers
Access agency-related Slack channels, exchange business insights, and join in on members-only live sessions.
