Resource Capacity Planning – Formulas, Steps & Strategies

Resource capacity planning compares the work you have committed to against the hours your team can actually deliver. If you run it over a quarter you’ll find out whether current commitments fit. If you run it over a year and the answer is what to hire, and when.
This guide covers both calculations, the strategies for closing the gap, and how to check the plan is working.
Key Takeaways
- The output of resource capacity planning is one number: the hours you have minus the hours you owe. Everything else feeds into it.
- Lead, lag and match are the three ways to close that gap. Lead hires ahead of demand, lag waits for it, match adjusts in small steps.
- Check the plan against billable utilization. SPI Research put the 2024 industry figure at 68.9%, below its optimal threshold of 75%.
- When capacity sits in one tool and budgets in another, the two stop reconciling. The gap you calculated is then wrong in a way nobody can see.
Free Capacity Planning Template
Download our template to schedule time for billable vs non-billable tasks, track workloads, and get insights into utilization with preset formulas.

What Is Resource Capacity Planning?
Resource capacity planning is the process of measuring what your team can deliver against what you have already sold.
- Capacity is the hours your people have left after leave, admin and internal work.
- Demand is the hours your committed and likely projects will consume.
The difference between them is the capacity gap. That number decides who you hire, what work you turn down, and which deadlines move.
In manufacturing, capacity management means machines and materials, usually handled inside enterprise resource planning software. In an agency, capacity means people. Two team members with the same title rarely have the same usable capacity.
Resource Capacity Planning vs Resource Planning
Resource capacity planning measures your total supply of hours against your total demand for them. Resource planning allocates named people to specific tasks on specific dates. The first produces a number. The second produces a schedule.
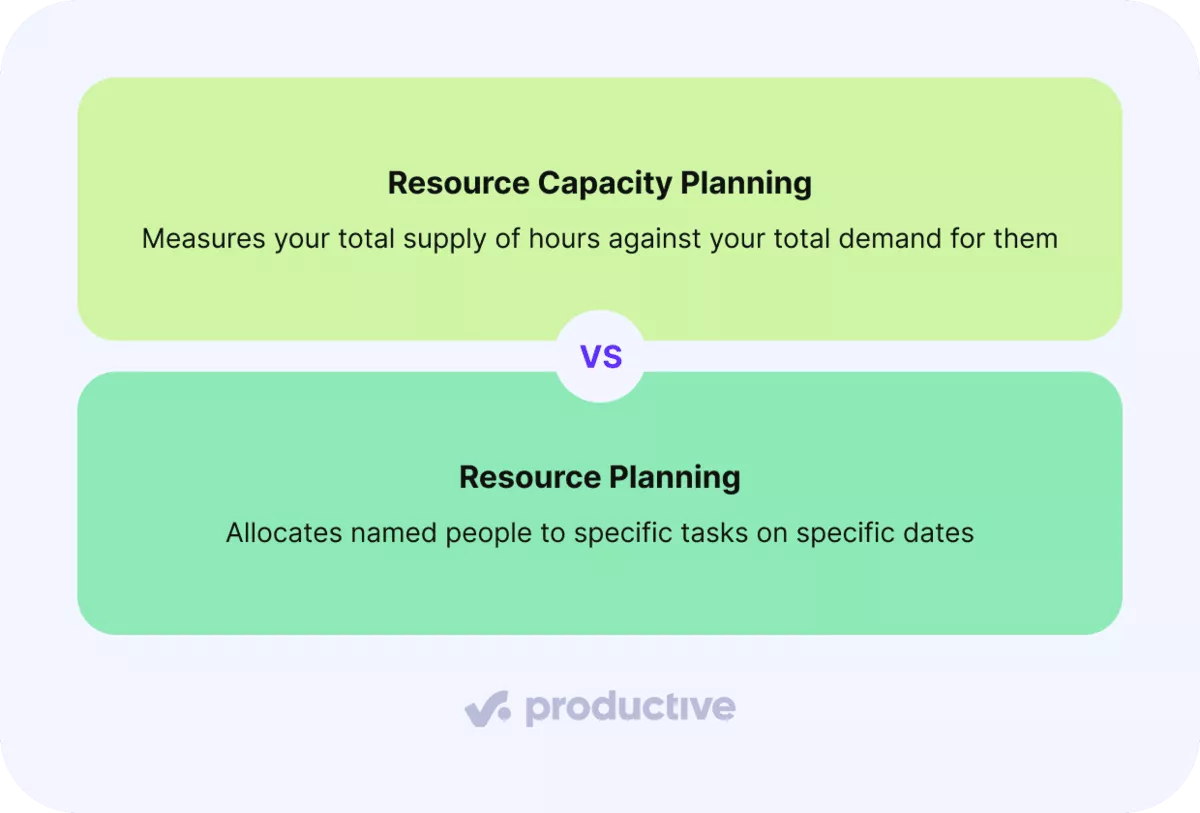
A twelve-person studio runs the capacity calculation in March, before pitching for a summer retainer. Resource planning happens in May, once the retainer is signed and somebody has to be booked.
Tools built for capacity planning model the March calculation. Project management tools mostly model the May one.
Who Owns Capacity Planning in an Agency?
Under fifteen people, the delivery lead owns capacity planning. They rebuild it monthly in a spreadsheet, one row per person and one column per week. It works because they already know what their team members are carrying without looking it up.
Between twenty and sixty people, resource management becomes a named job rather than a shared habit. A resource manager runs it weekly, against booked hours rather than memory.
This is where agency management roles get formally split. Above sixty, that role keeps the hours and finance takes the money. The two have to reconcile monthly.
Manage your capacity with Productive
How to Calculate Resource Capacity and Demand?
You calculate resource capacity in hours, calculate demand in the same hours, and subtract one from the other. The remainder is the only number this process produces.
Everything below works each side of the resource capacity planning calculation through one twelve-person studio, across a single month. Our three steps to calculating resource capacity covers the same ground in more depth.
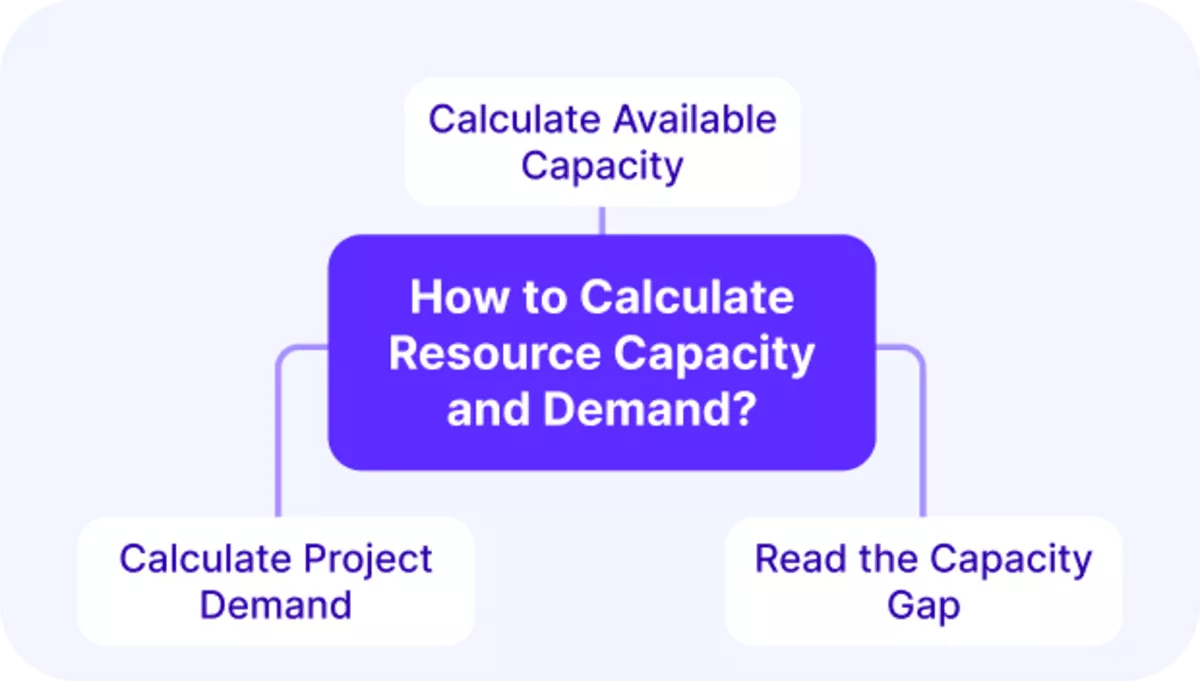
1. Calculate Available Capacity
The main typStart with resource availability, which comes from your timesheet export and your leave calendar rather than from headcount.es of resources in agencies include:
Available capacity = contracted hours – leave and holidays – internal and non-billable time
Ten of the studio’s twelve people are billable resources, at 160 contracted hours each in a four-week month. That is 1,600 hours. Three of them take a week off and one public holiday falls in the month, removing 200.
Standups, admin, line management and pitch work take another 280. Available capacity is 1,120 hours.
Check that figure before trusting it. 1,120 of 1,600 means 70% of contracted time is available for client work. That is a plausible split of billable and non-billable time for an agency this size. If your own numbers come out at 85%, you have missed a deduction.
If you start instead from a published utilization benchmark, do not also subtract leave and admin. The benchmark already contains them.

Productive gives you instant utilization reports.
2. Calculate Project Demand
Demand = committed hours + weighted pipeline hours
Committed hours come off signed scopes and retainers. The studio’s signed work for the month totals 1,050 hours.
Pipeline is where most agencies get this wrong. Unsigned work is not worth zero, and it is not worth its full value either. Weight each proposal by how likely it is to land. A 300-hour proposal at 70% counts as 210 hours, a 200-hour proposal at 30% counts as 60. Weighted pipeline is 270, so demand is 1,320 hours.
3. Read the Capacity Gap
Capacity gap = available capacity - demand
1,120 minus 1,320 is -200 hours. A negative gap means you have sold more than you can deliver. A positive gap means you are paying for hours you cannot sell. Most agencies find capacity gaps only after a date has already slipped.
Size it in people. Each person in this studio delivers 112 usable hours a month, so a 200-hour gap is nearly two people short.
That is a hiring or subcontracting decision. Below roughly one person’s worth, a gap disappears into slipped dates and unpaid overtime.
That is a cost rather than a decision.
Check the number against a report on past capacity before acting on it. If last quarter also came out negative and nothing broke, the demand estimates are inflated. The capacity is not the problem.
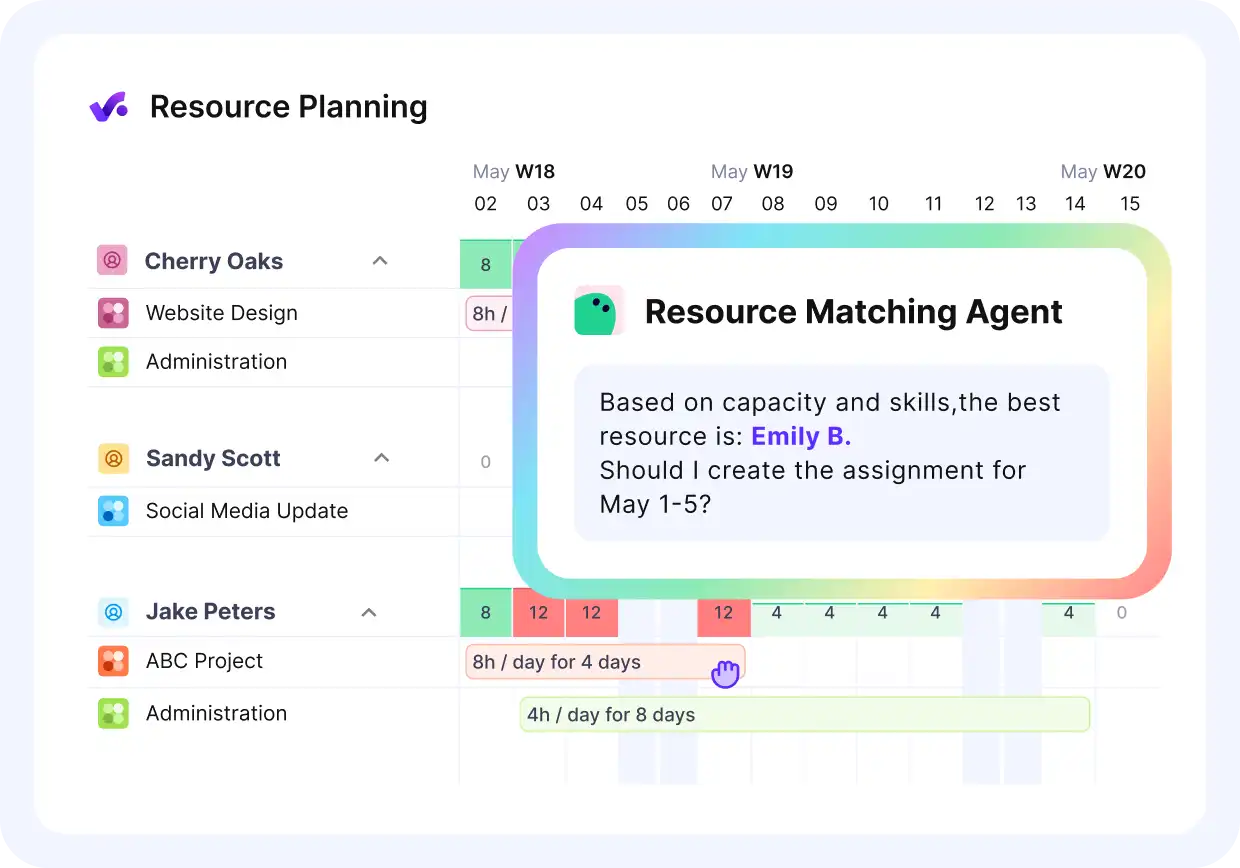
Ask Productive’s AI resource matcher who’s available to take on extra work.
The Resource Capacity Planning Process (Step by step Guide)
The resource capacity planning process produces a capacity plan. That plan is a rolling view of the hours you have against the hours you have sold. Rebuild it monthly. Review it weekly against what actually happened, because the plan goes stale fastest in the first two weeks.
Step 1: Name and Identify Your Resources
Start from your payroll list and mark every person who delivers client work. Contractors count if they are booked. Open roles do not count until someone has signed. Record contracted hours, skill sets and booked leave per person for the period.
Ask team leads to confirm the leave before you trust the calendar. If the list carries more names than your last invoice run had timesheets, it is wrong.
Skill sets matter as much as hours, and a plan can balance in total while failing on one discipline. Planning headcount and skills together prevents that.
Step 2: Forecast Demand
Demand forecasting breaks when every project is treated as equally certain and equally important. Take your signed scopes and your pipeline. Give each one a probability and a priority tier from one to three.
Tier one is the work you would keep if you could staff only half the book. If more than a third of projects land in tier one, nothing has been prioritized. Weight pipeline hours by probability before they enter the total.
Resource forecasting is only as good as the probability you attach to each proposal.
Step 3: Run the Capacity Analysis
Gap analysis is one subtraction, run per discipline rather than across the whole agency. A studio can sit at plus 40 hours overall while its only senior developer is 60 hours short.
Split capacity and demand by role, subtract within each role, and record every negative line separately.
A single agency-wide figure hides the exact shortage that will break the schedule. Splitting by role is how skill gaps surface before dates slip. This is the step that usually gets skipped when planning resources across several live projects.
Step 4: Choose a Strategy and Allocate
Four answers close a negative line: hire, subcontract, move the date, or cut scope. Assign one to each line, with a name against it and a date by which it has to be decided. Resource allocation comes last. Book people against the work, discipline by discipline, starting with tier one.
A tier that never changes staffing decisions is decoration. A gap with no owner and no decision date will still be open next month.
Step 5: Monitor and Adjust
A capacity plan is out of date within two weeks. Re-check three numbers every week: hours logged, hours still booked, and any new signed work. Anything more than 10% off the plan gets reallocated that week rather than at month end.
A late reallocation costs a missed date. An early one costs a busy week. Scope changes are the most common reason the plan moves at all. Long-range planning runs on a different clock, and planning capacity a year ahead is a quarterly exercise.
Match Your Capacity and Margin with Productive
Bookings, tracked time and budgets live on the same records in Productive, so the resourcing number and the profit number come from one source.

What Are the Best Capacity Planning Strategies?
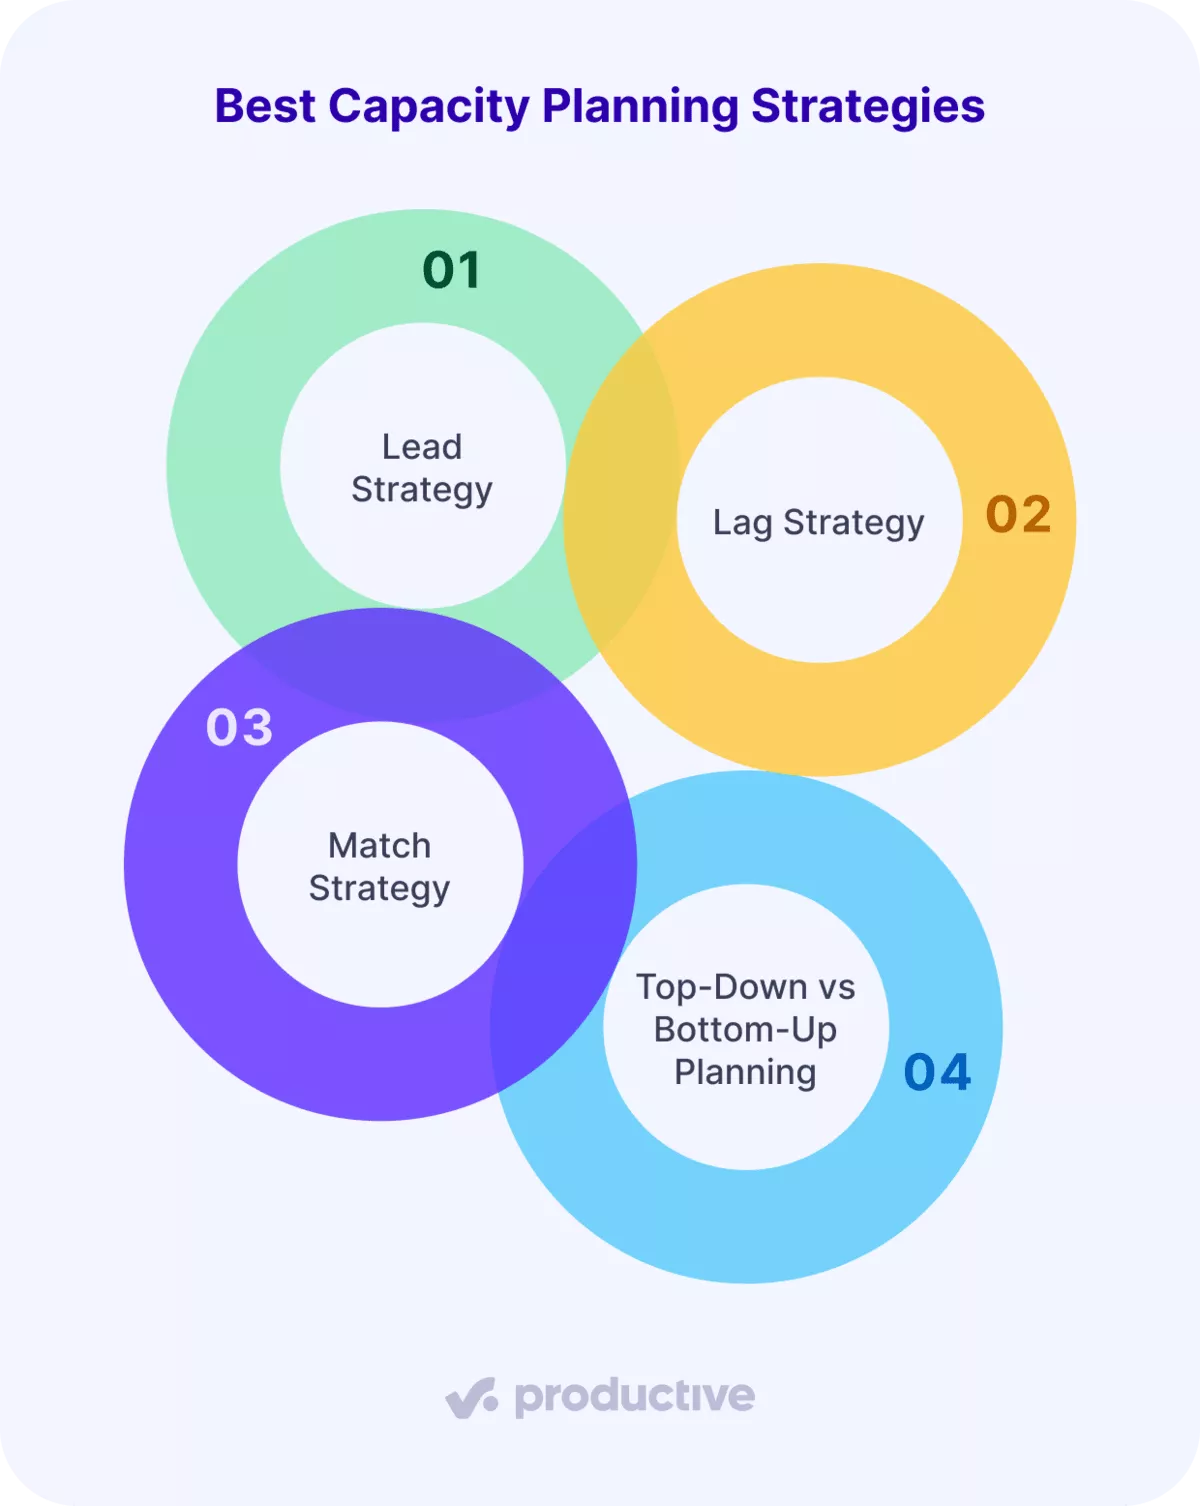
The best capacity planning strategies are lead, lag, and match. They differ in one thing, which is when you add people relative to when you need them. The cost implications follow from that. Lead pays for idle time, lag pays in missed dates.
1. Lead Strategy
Lead means adding capacity before the demand arrives. It is a proactive approach to staffing. It suits agencies with a steady pipeline and roles that are hard to hire for. A senior hire can take three months to find and longer to become useful.
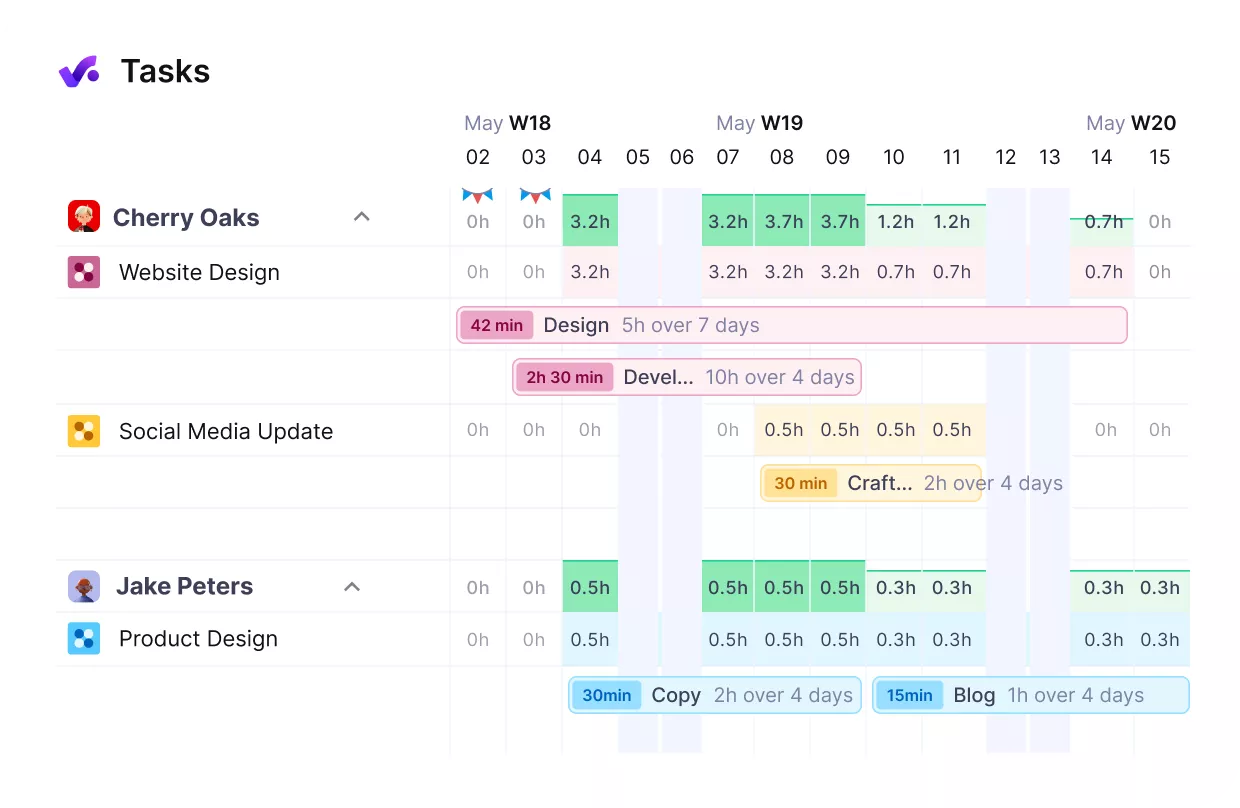
To run it, book unsigned work into the plan as tentative before you sign it. Then hire against the gap that appears. In Productive, a placeholder person stands in for a hire you have not made yet. Give them a cost rate and a working capacity, and you can see what utilization looks like once they start.
The cost is idle time. If the pipeline slips a quarter, you are paying salaries for work that never arrived. The shortfall has turned into hours you cannot sell.
Avoid idle hours and overbooking.
2. Lag Strategy
Lag means adding capacity only after the gap is real and measured. It suits agencies with an unpredictable pipeline, tight cash, or work a freelancer can pick up quickly.
Lag only works if you can move people quickly, because the shortfall is already real by the time you act. Productive’s Resource Planner flags overloaded people and underused people in the same view. You can move work the same week.
The cost is delivery. Lag agencies miss dates and burn their best people first. The fastest way to cover a gap you have already hit is to ask someone to absorb it. Lag only works with contingency plans agreed before the gap opens.
3. Match Strategy
Match means adding or moving people in small steps as the forecast changes. It sits between lead and lag. Most agencies above about thirty people end up here. At that size, one hire is a small enough change to make every quarter.
It only works if you trust the forecast. Productive’s Resource Planner can count tentative bookings towards capacity. You see what a person’s week looks like if the unsigned work lands.
That is how a shortfall shows up in week one rather than week six.
The cost is attention. Match rewards scenario planning, because you are choosing between small moves rather than large ones. It needs a weekly re-check and a monthly decision. Without that rhythm, you are running lag with extra steps.
4. Top-Down vs Bottom-Up Planning
Top-down and bottom-up describe where the numbers come from rather than which strategy you pick. Top-down starts with the agency’s revenue target and divides it into the hours needed to hit it.
That is quick, and wrong in the details. Bottom-up adds up the estimate on every project, which is slower and stays accurate until the estimates go stale.
Under thirty people, bottom-up is affordable and worth it. Above that, most agencies run top-down for the year and bottom-up for the quarter.
What Metrics Show Your Capacity Plan Is Working?
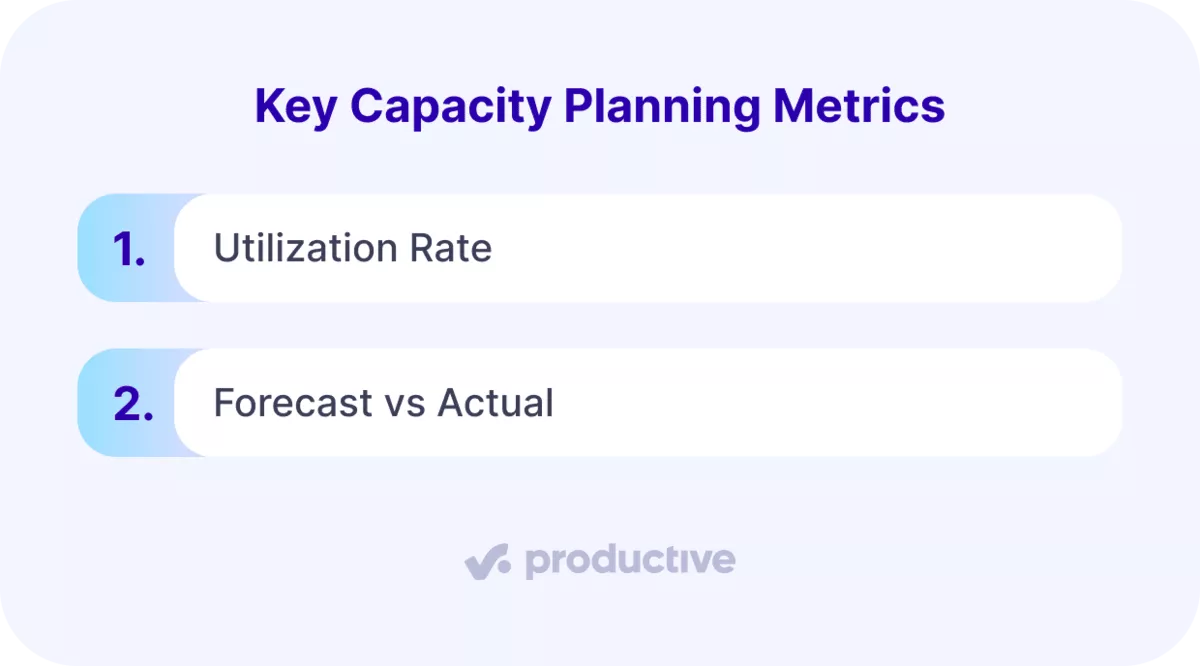
Two metrics show whether a capacity plan worked: utilization rate, and forecast against actual. The first measures whether the hours you had were used. The second measures whether the plan was right in the first place.
1. Utilization Rate
Utilization rate = billable hours / available hours
Track team utilization per person and per discipline, monthly. An agency-wide figure moves too slowly to act on, and it hides the case where one team carries the average. Resource tracking only helps when booked and logged hours sit in the same system.
SPI Research’s 2025 Professional Services Maturity Benchmark measured billable utilization at 68.9% across 403 firms. That is below the 75% threshold SPI treats as healthy, and the top quartile reached 76.2%.
Utilization rates vary more by firm size than most agencies expect, so read that against your own size before panicking. The same study put firms under ten people at 64.3% and firms of 101 to 300 at 72.4%.
A six-person studio at 65% is sitting on its own benchmark, not the headline one.
2. Forecast vs Actual
Compare booked hours against logged hours, per person, per month. That variance measures the plan rather than the team. Most agencies never look at it, and it rarely appears in the metrics worth tracking on capacity.
Variance that size moves project timelines long before it moves margin:
- Under 10%, the estimate was fine and the week was unusual.
- Above 20% in the same direction for two months, the estimating is wrong, meaning that every capacity plan built on it is wrong too.
What Are the Common Resource Capacity Planning Challenges?
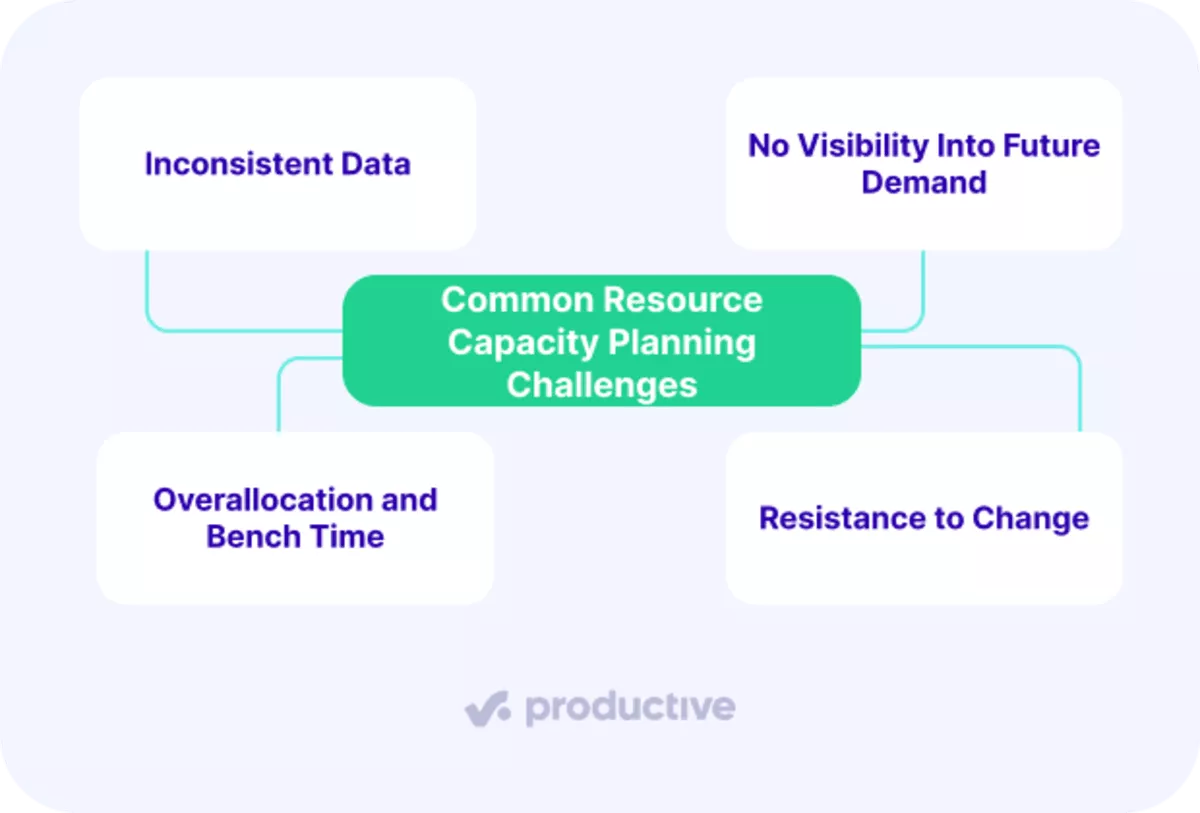
The most common resource capacity planning challenges are inconsistent data, no view of future demand, overallocation, and resistance to change. Each has a cost you can measure and a resource capacity planning fix you can start this week.
Our guide to the challenges of planning service capacity covers more of them.
1. Inconsistent Data
Inconsistent data means your booked hours and your logged hours describe different weeks. The cost shows up at invoicing. You bill 60 hours against a project you booked 90 for, and nobody can say where the other 30 went.
How to solve it. Reconcile one month before you trust any capacity planning figure. Export bookings and time entries for the same month and match them per person. List every line that differs by more than 10%.
If more than a quarter of your people show a gap that size, the problem is how time gets logged. Keeping bookings and time in one agency management system removes the reconciliation step.
2. No Visibility Into Future Demand
You cannot see future demand when the pipeline sits in one place and the plan sits in another. The cost is hiring late. By the time the resource shortfall is obvious, the person you need takes three months to find.
How to solve it. Put weighted pipeline hours into the same view as booked hours and refresh it every Monday. Set one trigger number in advance. If weighted demand beats capacity two months running, you start recruiting.
A pipeline review that never changes a staffing decision has not been used for capacity planning.
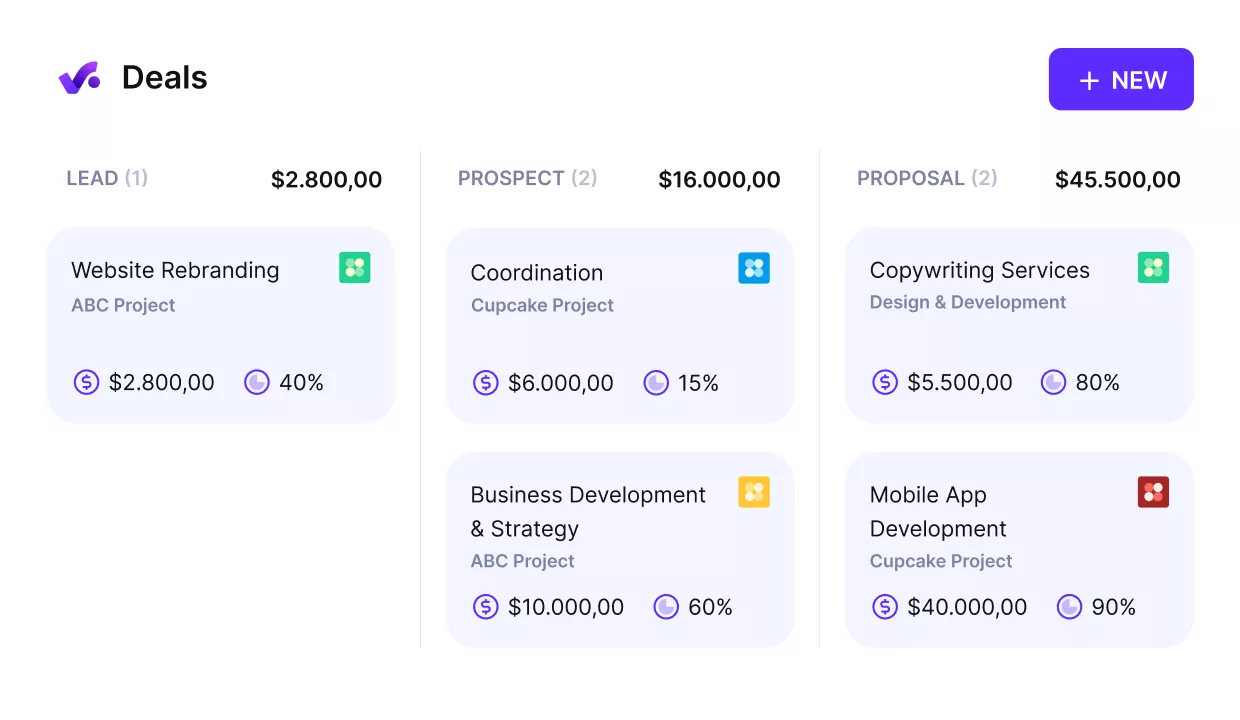
Factor in future work and won deals in the pipeline.
3. Overallocation and Bench Time
Overbooking and bench time are the same failure pointing in opposite directions. Bench time means paid hours nobody is buying. Overbooking costs you people, and employee burnout is the expensive end of it.
The ones who absorb it quietly are the ones who leave.
Bench time costs you margin, and it hides better, because nobody complains about a quiet week. Resource constraints are easier to argue about than to measure.
How to solve it. Track both against one number. Anyone above 100% booked for three weeks running is overallocated. Anyone below 60% for a month is on the bench.
Check how billable utilization is measured before setting those thresholds. A team counting internal work as billable hours looks healthy at both ends.
4. Resistance to Change
Resistance to change usually means somebody senior does not believe the numbers. The cost is a capacity planning process that exists and gets ignored. That is worse than having no plan, because it looks like control.
How to solve it. Run a monthly risk assessment on the two largest gaps. Name the two people who have to agree before the plan means anything. That is usually whoever owns delivery and whoever owns the money.
Get them to sign off the same capacity figure once a month. If that sign-off takes more than fifteen minutes, they are still arguing about the data. Fix the data first.
How to Choose the Best Resource Capacity Planning Software?
Choose resource capacity planning software on one test: whether the numbers it produces match the numbers you already trust. Capacity planning tools differ less on features than on how they count. Most teams start from project management software with resource planning and find it models tasks rather than hours.
What to Look For in a Capacity Planner?
Rebuild your last two months of resource planning inside the trial, using real people and real bookings. Then compare the tool’s resource utilization figure against the one you calculated by hand. If they disagree by more than a few points, the tool is modelling your agency wrongly.
Three things usually cause that gap. The tool counts holidays differently, treats part-time contracts as full weeks, or counts internal projects as billable. Ask about all three before you compare anything else.
Only then check whether it handles tentative work, placeholders and time off. Those are what make a plan survive a real month.
Spreadsheets vs Dedicated Software
A spreadsheet is the right answer below about fifteen people and ten live projects. At that size you can hold the exceptions in your head. Resource management tools cost more in setup than they save at that size.
What breaks above that is not the arithmetic. It is version control. Two people edit different copies on the same Tuesday, and neither knows which one the hire decision came from.
That is the point to move to workforce planning software or a dedicated resource management platform. Missed dates show up as client satisfaction problems long before they show up in churn.
Productive keeps bookings, tracked time and budgets in one place. The resource utilization figure and the margin figure come from the same data, so they cannot quietly disagree.
Know Your Capacity Gap Before You Sell the Work
Productive puts booked hours and available capacity in the same view, so you can see the shortfall while there is still time to act on it.
Frequently Asked Questions
What are the steps in capacity planning?
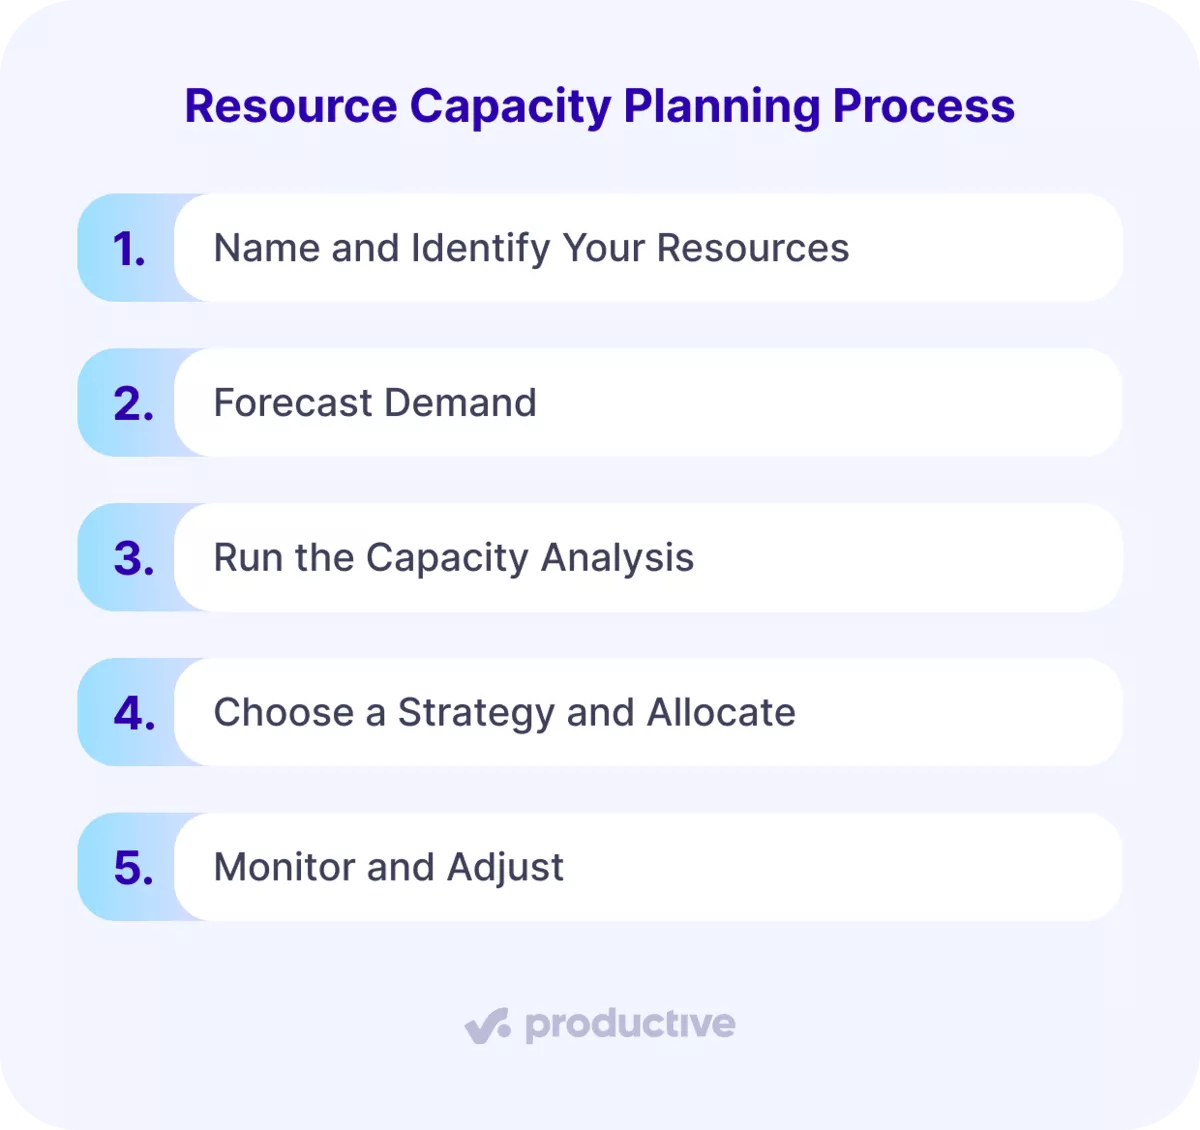
Resource capacity planning has five steps: identify your people, forecast demand, compare the two, choose a strategy, monitor the result. Each step produces a number that feeds the next. The output is a capacity gap measured in hours.
What does resource capacity mean?
Resource capacity is the total amount of work your team can deliver in a period, measured in hours. It is contracted hours minus leave, holidays and internal work. It is always lower than headcount multiplied by working hours.
What are the three types of capacity planning?
The three types of capacity planning are lead, lag and match. Lead adds people before demand arrives. Lag adds them after a shortfall appears. Match adjusts in small steps as the forecast changes.
What is the difference between capacity planning and resource planning?
Capacity planning measures whether you have enough hours in total. Resource planning decides which person does which task, and when. Capacity planning produces a number, resource planning produces a schedule. Most agencies need both, in that order.
How often should you redo capacity planning?
Redo resource capacity planning monthly and review it weekly. The monthly rebuild catches new signed work and changed leave. The weekly review catches the reallocations that stop the month slipping.
Can you do capacity planning in a spreadsheet?
Yes, and for a small agency it is often the right call. Below about fifteen people, the exceptions fit in your head. The problem above that size is version control, because several people end up editing different copies of the same file.
Final Thoughts
Your resource plan lives in one tool. Your budgets live in another. Both look right, and neither is checked against the other.
That is how an agency staffs a quarter on assumptions that were accurate when somebody typed them in. By the time the work starts they are wrong, and nothing in either system says so.
An all-in-one platform for project management, resourcing and finance closes that distance. Bookings, tracked time, costs and margin all come off the same records. A bad number surfaces in the schedule and the profit report at the same moment.
If you want to see that against your own bookings and budgets, book a demo.
Connect With Agency Peers
Access agency-related Slack channels, exchange business insights, and join in on members-only live sessions.
