How to Calculate ROI for a Project – Formula, Steps & Example

Learning how to calculate ROI for a project takes one line of math: return minus cost, divided by cost.
ROI, or return on investment, shows that result as a percentage of what you spent. The hard part is the inputs, because the estimate rarely gets checked against the real return.
Here’s we’ll cover the ROI calculation: five steps, formula, worked example, a template and a break-even check that flags trouble early.
Key Takeaways
- ROI is profit divided by cost, times 100. Because the ROI formula divides by cost, your result is only as reliable as your cost figures.
- Cost client work at cost rate, plus overhead and pass-through spend. Hours priced at billable rates add up to roughly the fee, so the ROI comes out near 0%.
- Every unplanned hour lowers the return. In the worked example, 60 extra hours cut a project’s ROI from 50% to 17.07%.
- Annualize before you compare projects longer than a year. 60% over 2 years works out to 26.49% a year, which beats 90% over 4 years at 17.41%.
What Is Project ROI?
Project ROI is the profit a project returns, expressed as a percentage of what it cost. In project management, return on investment rests on time rather than purchases. Most of the investment is people’s hours, so you build the cost side from them.
Read it beside the other metrics worth tracking per project, because a strong return can hide a missed deadline.
Anticipated ROI uses estimated hours and costs, before the work is approved. It belongs in the business case or ROI plan you present for sign-off.
Actual ROI uses logged hours and real costs, at milestones and again at close.
Keeping both figures pays off because the gap between them shows which estimate broke. When one type of work keeps overrunning its estimate, the gap drives business decisions such as quoting it higher.
What Is the ROI Formula for a Project?
The ROI formula for a project subtracts cost from return, divides by cost, and multiplies by 100.
ROI = (Return − Cost of investment) ÷ Cost of investment × 100
The return, also called financial value, is the fee for client work. For internal work, it is the money value of the benefits. Cost of investment is every cost the work consumed. Return minus that cost is net profit, also called net gain or net benefit.
The ROI formula in project management is the finance formula unchanged, with hours as the main cost.
| Measures | Formula | Divides by | Result on a $10,000 return from $7,000 of cost |
|---|---|---|---|
| ROI | Profit ÷ total cost × 100 | Cost | 42.86% |
| Profit margin | Profit ÷ return × 100 | Revenue | 30% |
| Benefit-cost ratio | Return ÷ total cost | Cost | 1.43 |
The same work reads 42.86% or 30% depending on the denominator, so say which one you report. If you report margin rather than return on cost, start with measuring profitability by client and project.
Return on assets and return on equity describe the whole company, so they never stand in for this formula.
How Do You Calculate ROI for a Project?
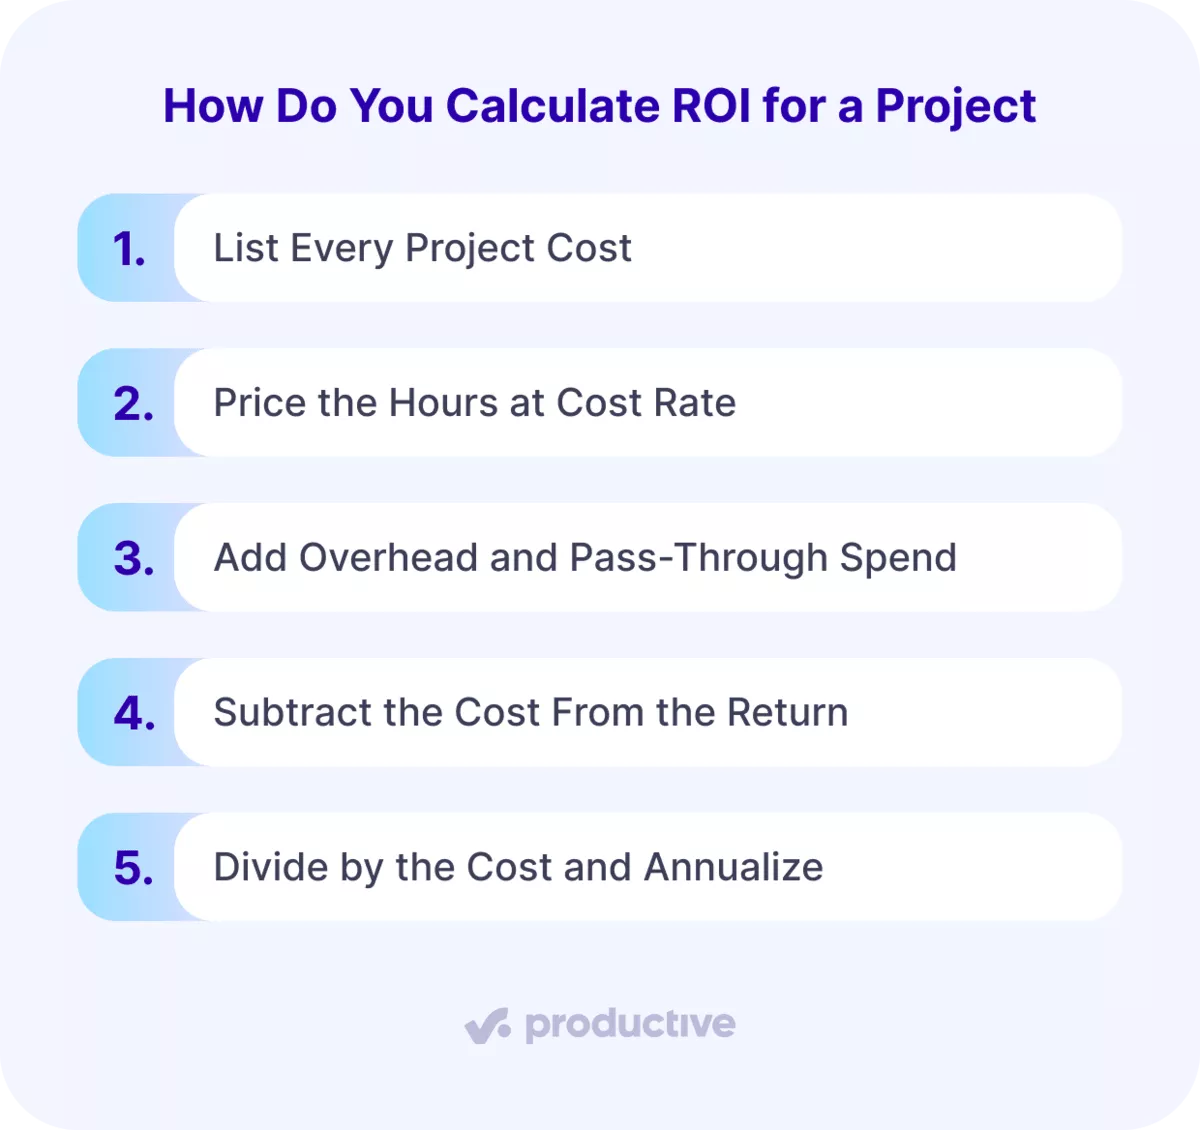
You calculate ROI on a project by listing costs, pricing hours at cost rate, adding overhead, subtracting and dividing. The return is usually known before you start, so ROI calculations rise or fall on the cost side.
Step 1: List Every Project Cost
List every hour by role and every purchase as its own line, using the estimate or statement of work. Pull purchases from the expense log or purchase orders, including anything bought only for this work.
For an internal project, add hardware costs, capital equipment and the support costs that keep running after launch.
Check: every estimated hour and purchase appears in your list of project costs. If the list holds only the fee, the ROI has no real cost side.
Step 2: Price the Hours at Cost Rate
Price each hour at cost rate (what one hour of a person costs you), never the billable rate. The cost rate is annual salary plus benefits, divided by available hours. Example: $96,000 ÷ 1,600 hours = $60 an hour.
When several roles share the work, use a blended rate across them.
Check: hours priced at the billable rate put the cost near the fee and the ROI near 0%.
In Productive, each person’s cost rate sets an hourly cost. Their time entries priced at cost rates then add up to the labor cost of each project.
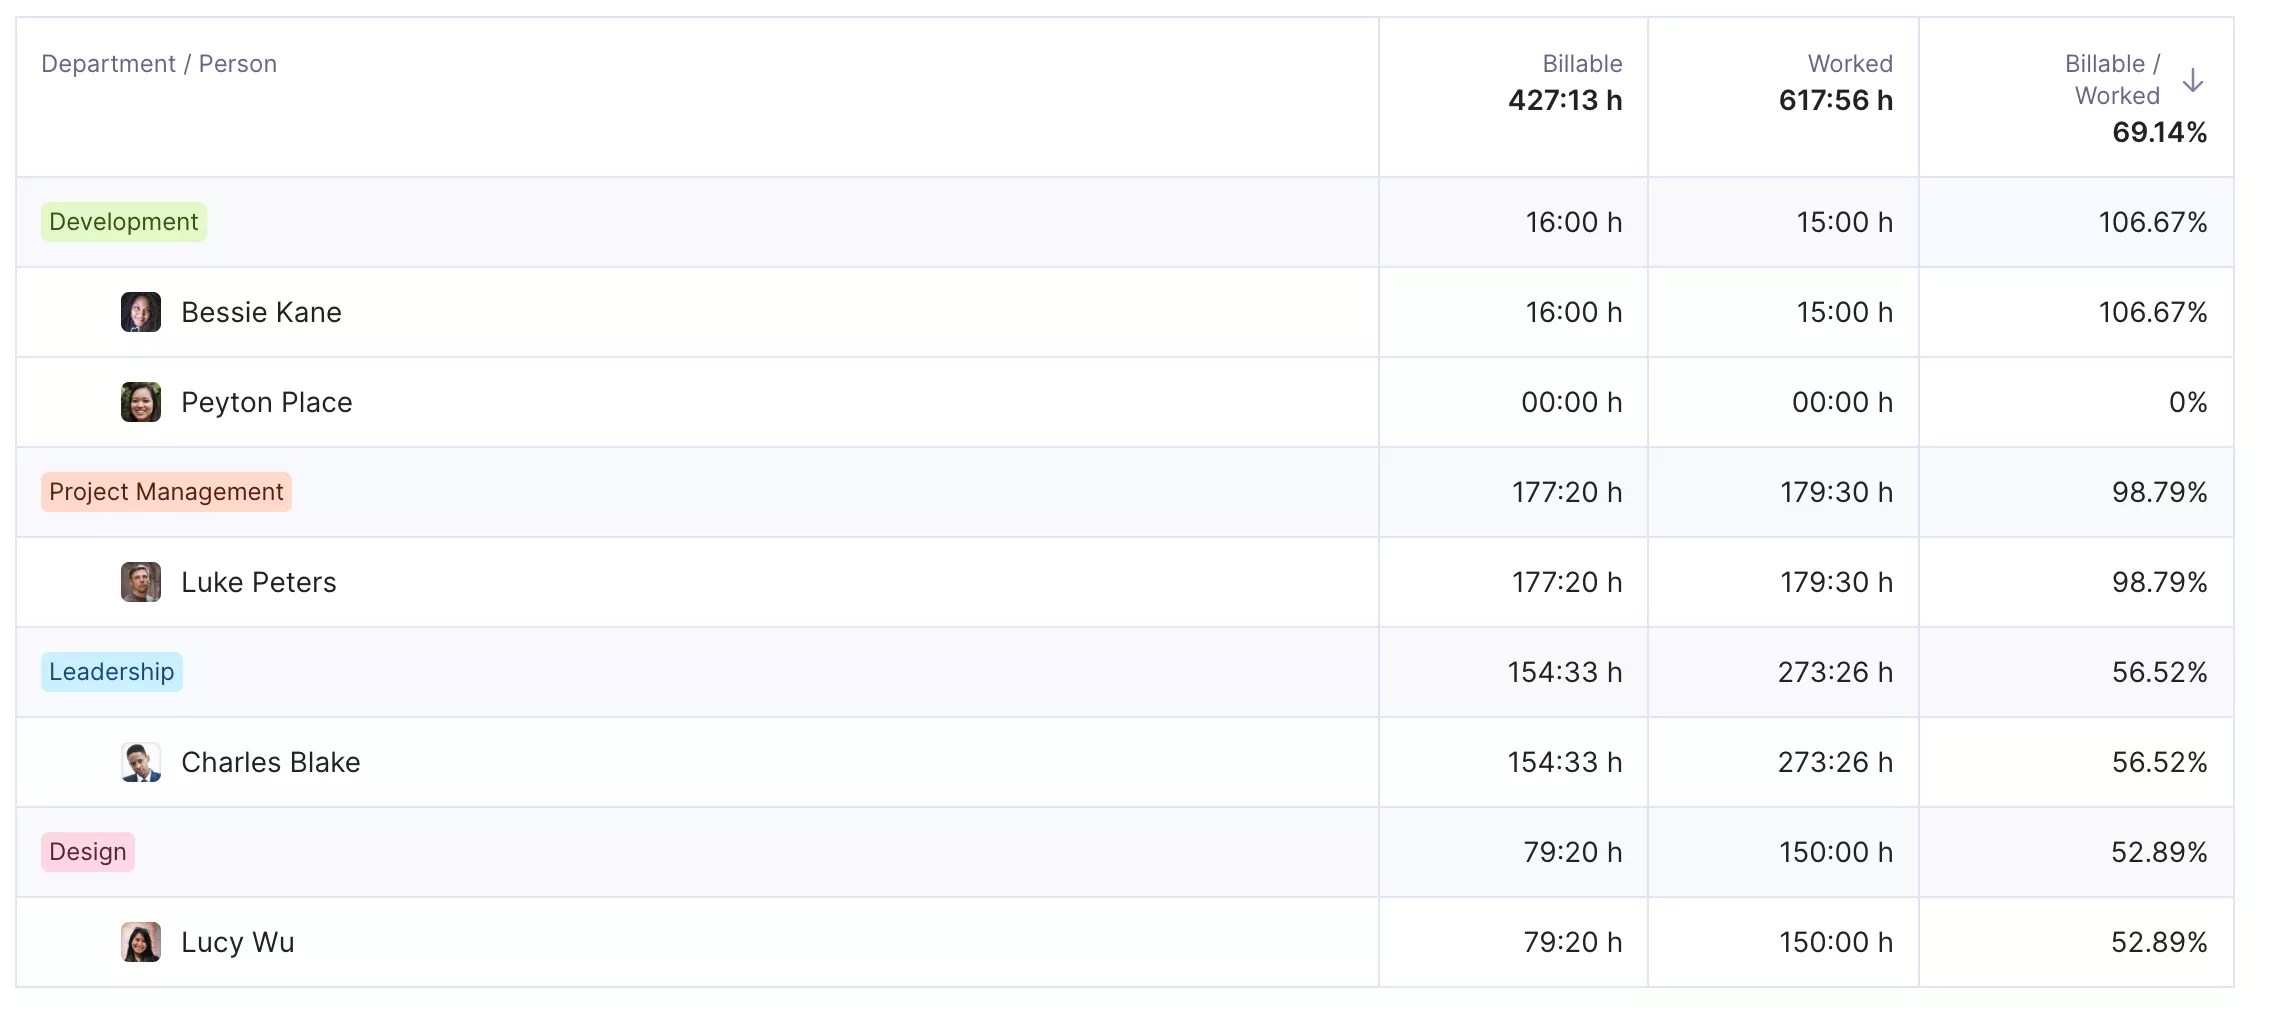
See each person’s cost rate and utilization.
Step 3: Add Overhead and Pass-Through Spend
Add overhead to every hour, then add pass-through spend at what you paid. Overhead is the operating expenses no client pays for directly, such as rent, software and non-billable salaries.
Divide monthly overhead by monthly delivery hours, which is the same as working out an overhead absorption rate.
Example: $30,000 ÷ 2,000 hours = $15 an hour.
Pass-through spend covers stock assets, licenses or media bought for the project. Check: overhead costs appear as their own line in the cost list. If they’re missing, every project’s ROI is overstated.
In Productive, enabling overhead adds a fraction of your total overhead cost to each hour a person logs.

Get early warnings of budget overruns and profitabilty hits.
Step 4: Subtract the Cost From the Return
Subtract total costs from the return to get net profit, which can be negative. On client work, the return is the fee.
On an internal project, the return is the dollar value of its total benefits. Common benefit types are increased revenue, cost reduction, cost savings, cost avoidance and capital avoidance.
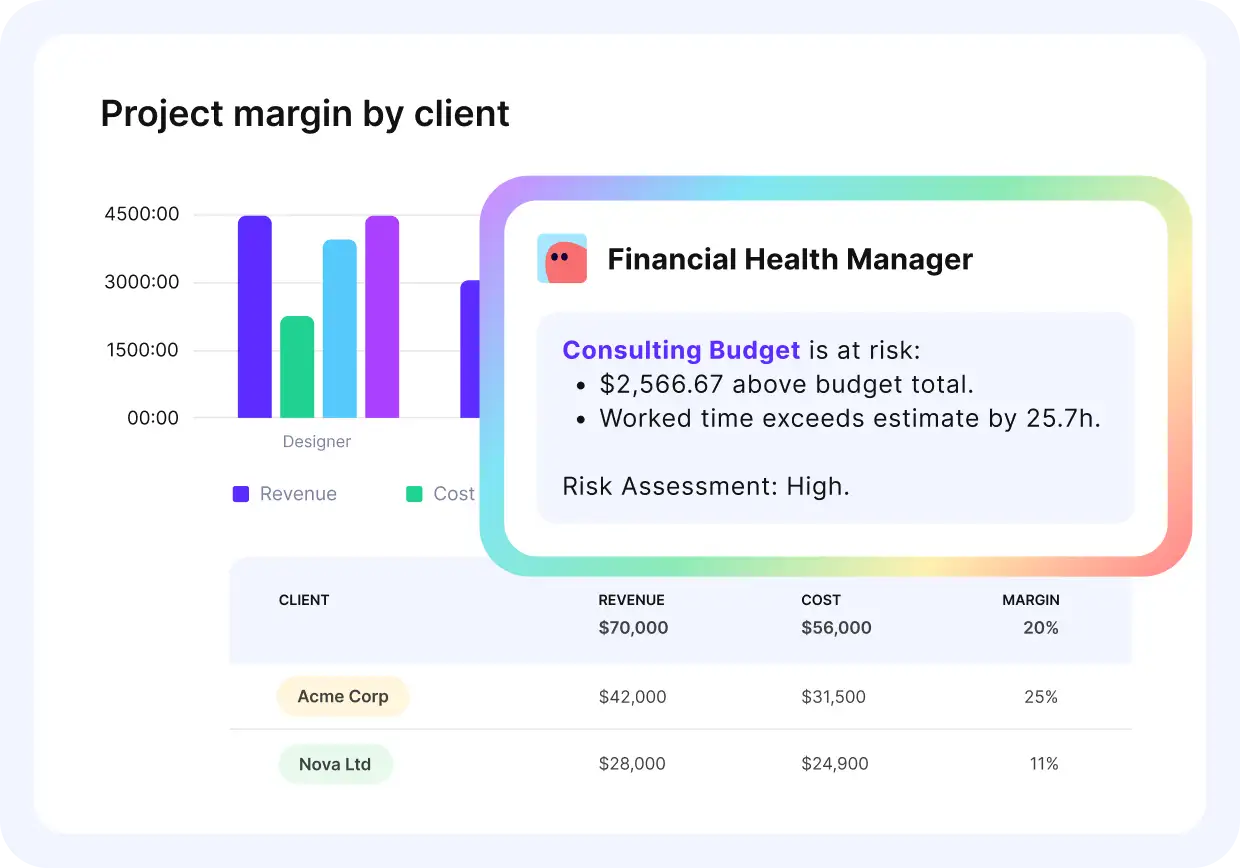
Ask the AI assistant in plain language how much the project will make.
The last two cover a hire you no longer need and equipment you no longer buy. Efficiency gains count too: price the hours saved at cost rate.
For a marketing campaign, the return is the expected revenue it brings in.
Check: every benefit in the return has a dollar figure and a stated basis. A benefit you can’t price stays out of the ROI and gets recorded by name instead.
Step 5: Divide by the Cost and Annualize
Divide that result by the cost of investment, then multiply by 100 to get ROI. Some teams call this denominator the total investment; it is the same number.
Annualize when you compare projects of different lengths and one runs longer than a year.
Annualized ROI = (1 + ROI) to the power of (1 ÷ years), minus 1
Example: 60% over 2 years is 26.49% a year, while 90% over 4 years is 17.41% a year. The smaller total wins once time is counted.
Check: for project prioritization, rank multi-year work on annualized figures, never on totals.
See Your ROI Slip While the Project Still Runs
Productive’s budget profitability view counts cost as tracked hours × cost rate, with overhead added when you enable it.

Project ROI Calculation Template
This project ROI calculation template turns the five steps into lines you can copy into a spreadsheet.
| Line | What to enter | How to work it out |
|---|---|---|
| Delivery hours | Estimated hours before approval, logged hours after delivery | Sum the hours by role |
| Cost rate per hour | Blended cost rate of the people doing the work | Annual salary plus benefits ÷ available hours |
| Labor cost | Calculated | Delivery hours × cost rate |
| Overhead | Overhead rate per hour | Overhead rate × delivery hours |
| Subcontractor services | Freelancers or partners you pay for this work | Their invoices or quotes |
| Supplies & materials | Licenses, stock assets, hosting or media | Expense log or purchase orders |
| Total cost | Calculated | Sum of the four cost lines |
| Rreturn | The fee, or the dollar value of internal benefits | Contract, invoices or benefit estimate |
| Net profit | Calculated | Return − total cost |
| ROI | Calculated | Net profit ÷ total cost × 100 |
| Project length in years | Months of delivery | Months ÷ 12 |
| Annualized ROI | Calculated, for comparisons only | (1 + ROI) to the power of (1 ÷ years) − 1 |
Copied into a spreadsheet with the third column as cell formulas, it works as your own ROI calculator.
Worked Example: Anticipated vs. Actual Return on a Client Project
A team delivers a website redesign for a client on a $24,000 fixed fee, estimated at 200 hours. Hours are priced at the $60 cost rate plus $15 of overhead, with $1,000 of pass-through spend.
| Line | Anticipated | Actual |
|---|---|---|
| Delivery hours | 200 | 260 |
| Labor at $60 an hour | $12,000 | $15,600 |
| Overhead at $15 an hour | $3,000 | $3,900 |
| Pass-through spend | $1,000 | $1,000 |
| Total cost | $1,000 | $20,500 |
| Fee | $24,000 | $24,000 |
| Net profit | $8,000 | $3,500 |
| ROI | 50.00% | 17.07% |
The anticipated ROI of 50% fell to an actual ROI of 17.07%. The cause was 60 unplanned hours of revisions the fee didn’t cover. That is over-servicing: hours delivered beyond what the fee covers, visible in billable hours versus actual hours.
Each extra hour cost $75 fully loaded, $60 of labor plus $15 of overhead. So 60 × $75 = $4,500, the exact drop in net profit.
The number to watch during delivery is the break-even point. Take the fee minus pass-through spend, $23,000, and divide by $75: net gain hits zero at about 307 hours.
So this project still made money at 260 hours, but every hour past 307 pushes the ROI under zero. For project performance, track logged hours against the break-even count, not only against the estimate.
What Is a Good ROI for a Project?
A good ROI for a project beats two marks: your hurdle rate and what similar past projects earned. A hurdle rate is the minimum return your company accepts before it funds the work.
- Negative ROI, under 0%, means the project lost money.
- Zero is break-even.
- Positive ROI, over 0%, means a net gain.
The benefit-cost ratio breaks even at 1.0 instead, so keep the two scales apart. The ROI of a project can be positive and still too low, if it trails the hurdle rate.
To set an ROI threshold, list the final returns of your last ten closed projects of one type. The median becomes your floor, and work quoted under it gets repriced or rescoped before you accept it.
That floor also guides resource allocation: people go first to projects that clear it. One shared floor keeps financial decisions consistent from one account lead to the next.
The share of projects clearing it each quarter is a quick read on financial health and business performance.
When to Use Payback Period, IRR or NPV Instead
Use payback for speed, NPV for returns spread over years, and IRR to compare against a known rate. NPV is net present value, and IRR is the internal rate of return. Both price in the time value of money, which ROI ignores.
Example: an initial investment of $1,000 returns a $400 cash flow each year for 3 years. Its ROI is 20% over the three years, which says nothing about timing.
Payback tells you when an investment pays for itself: here, after 2 years 6 months. It suits equipment purchases and cash-tight decisions, but ignores everything that arrives afterward.
NPV divides each future amount by (1 + discount rate) to the power of its year. Add those up and subtract the investment. At an 8% discount rate, the example’s NPV is $30.84, so it clears that rate with little to spare.
IRR is the discount rate at which NPV equals zero: 9.70% for the example. Compare it with your hurdle rate, and see working out IRR for a project for the method.
By keeping a precise record of all expenses, businesses can ensure their ROI analysis remains grounded in real numbers. An incomplete or inaccurate cost assessment risks overestimating or understating the impacts of a project.
Challenges of Measuring a Project’s Return
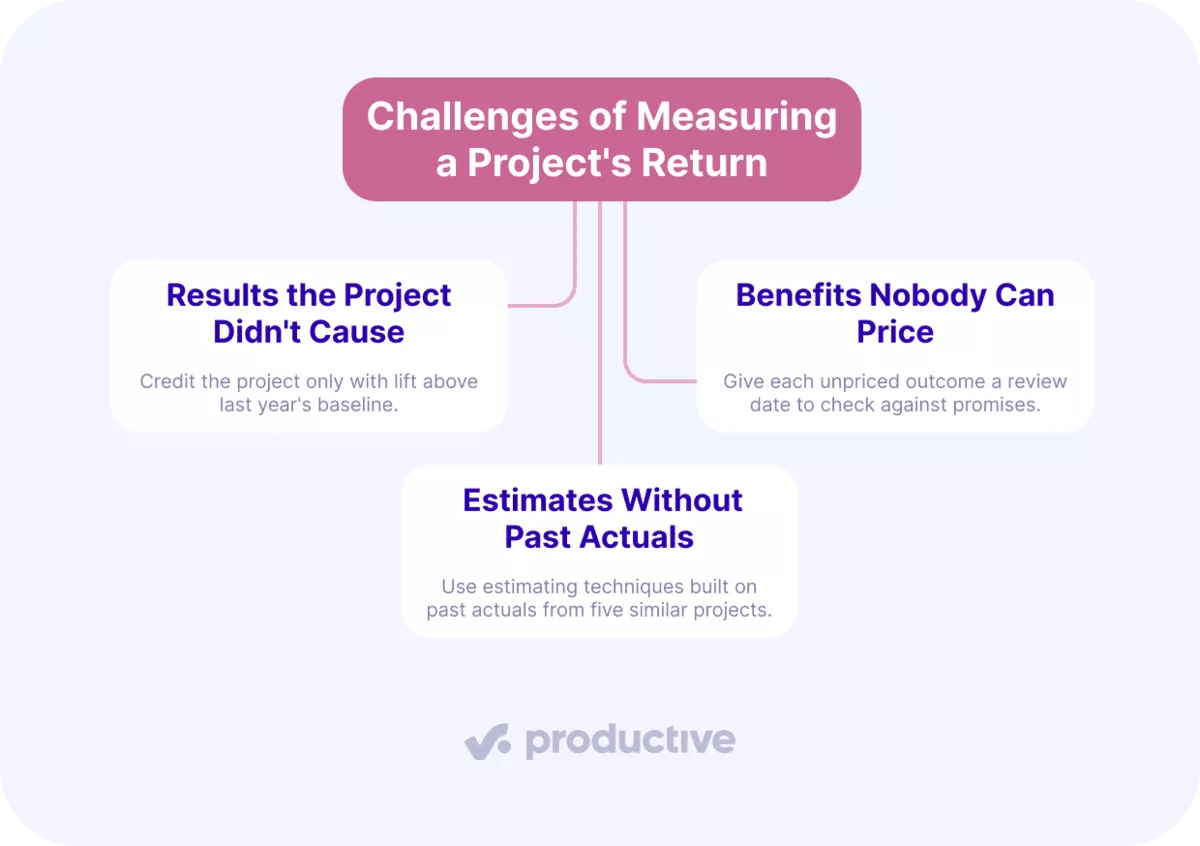
A project’s return gets distorted by results it didn’t cause, benefits nobody can price, and estimates without past actuals. None of the three is solved by better formulas; each needs a project management habit.
1. Results the Project Didn’t Cause
A marketing campaign or seasonal peak can lift results while the project runs. ROI calculations then credit the work with all of it.
How to handle it: before you calculate ROI, compare against last year’s same period or an untouched group. Credit only the lift over that baseline, and note any marketing campaign that overlapped.
2. Benefits Nobody Can Price
Training programs and skill building pay off, but rarely in a number you can defend. Benefits realization often lands well after delivery, when the ROI calculations are already reported.
How to handle it: give each unpriced outcome a review date, then check it against what was promised.
3. Estimates Without Past Actuals
An anticipated return is only as good as the hour estimate under it.
How to handle it: build the estimate from the logged hours of your last five similar projects. That way project performance data sets the number, using estimating techniques built on past actuals.
Each closed project then sharpens the next quote, which is where better estimates show up in business performance.

Compare project progress against key financial metrics.
Frequently Asked Questions
What Is the ROI of a Project Management Tool?
A project management tool’s ROI weighs what it saves against what it costs to run. On the cost side, count software costs, implementation costs, training costs and support costs.
On the return side, price efficiency gains as hours saved × cost rate, plus cost reduction from retired tools.
How Often Should You Recalculate ROI in Project Management?
Recalculate actual ROI at each milestone, monthly on projects longer than a quarter, and once at close. ROI in project management earns its keep mid-project, and the close version feeds a post-project analysis.
In Productive, budgets that update as hours are logged show project performance in profit terms as the work runs.
Is a Project With a Negative Return Ever Worth Doing?
Yes, when strategic alignment justifies it, as with training programs or a first project for a new client. Treat that negative ROI as a planned cost of business growth, with an end date and target result.
How Is an ROI Analysis Different From the Calculation?
An ROI analysis is the study around the calculation, which only runs the formula on one set of numbers. It adds cost analysis, risk assessment and what-if analysis across scenarios, as part of a wider financial analysis.
Run an ROI analysis when a decision is large enough that ROI calculations on a single estimate feel risky.
Can a Spreadsheet Do the Job of a Calculator?
Yes, the template makes a spreadsheet a project ROI calculator, but it is only as current as its inputs. Every ROI calculation in it waits for someone to retype the hours, so it lags the work. Financial tools that keep hours, costs and budgets together beat a spreadsheet ROI calculator, since nothing gets retyped.
Final Thoughts
Project ROI is only as reliable as its inputs. When hours, costs and budgets are spread across tools, someone fills the gaps with assumptions. An all-in-one project management tool keeps that data in one place.
Then ROI, project performance and the estimates behind next year’s plans all rest on actual numbers. If you want that view of financial health for your own projects, book a demo with Productive.
Retire the ROI Spreadsheet You Retype Every Month
Productive keeps time entries, cost rates and budgets together, so ROI comes from logged hours instead of estimates.