Time to Market (TTM): Definition, Formula, Examples, KPIs

Time to market (TTM) is the calendar time between approving a new product or service and launching it. Your launches slip on approvals that wait a week, scope added after sign-off, and specialists booked elsewhere. Few teams track those waits, so the same delays repeat on the next launch.
In this guide, we show you how to calculate TTM with a worked example and which KPIs to track. We also cover three real launches, the challenges behind most delays, and four practices that shorten the cycle. Run the calculation on your last launch as you read, and you will see which phase took longest.
Key Takeaways
- TTM counts calendar days across the product development cycle. Fix the start date and the market launch date before you measure.
- Split TTM into working, waiting and rework days. In the worked example, waiting took 31 of 60 days.
- The biggest delays come from scope added after sign-off, unowned approvals and dates promised before capacity checks.
- Agile methodologies cut rework only when reviewers answer within the sprint, so book their review time upfront.
- Mark which phases block which before you overlap them. Productive’s project management tools draw each dependency as an arrow between tasks in the Gantt layout.
What Is Time to Market?
TTM, or speed to market (STM), is the calendar time from a product’s first approved idea to its launch. The clock counts calendar days, not logged hours, so an idle week still adds to the total. You use it to compare one launch against the last.
Most new product development splits into four phases worth measuring separately:
- Ideation, where the product concept is written up and approved
- Design, where scope, specs, and the build plan are fixed
- Testing, covering internal QA, pilots, or client review
- Market introduction, from launch and promotional campaigns through to first sale
The same measurement works for services. A consultancy packaging a new compliance assessment starts the clock at internal approval. It stops the clock when the first client is billed. An agency launching a content service measures from sign-off to its go-live date, when clients can first buy it.
A TTM definition is only useful once you fix the two ends. Some firms start at project charter approval, and others wait until the project is fully staffed. The end point might be manufacturing transfer or first sale.
That choice moves the answer by months, so write both ends down before anyone quotes a number. The speed to market definition is identical: STM and TTM are two names for one measurement.
How Is TTM Different From Time to Value?
TTM stops at launch, and time to value (TTV) stops when the client gets the first result they bought. Example: the consultancy approves its compliance assessment on March 2 and bills the first client on May 11.
It delivers that client’s first assessment report on June 22. TTM is 70 days, and time to value is 42 days, counted from the sale.
Track only TTM and the launch looks finished on day 70. The client’s time to value still has six weeks to run, with nothing they can use yet. A Mind the Product article makes a case for prioritizing time to value, because it ties directly to retention.
For customer-facing products and product updates, time to value runs from release to a customer’s first result. If time to value runs long, check onboarding steps, missing client data and the first review date.
Record three dates on every launch: approval, first sale and first delivered result.
How Do You Calculate Time to Market?
You calculate time to market by subtracting the start date from the launch date, in calendar days.
TTM (calendar days) = launch date minus start date
The same days then split into three types, so you can see which one to cut.
TTM = working days + waiting days + rework days
Working days are days someone spends on the deliverable. Waiting days pass with no work possible, because a specialist is booked elsewhere or an approval is unsigned. Rework days go to redoing a deliverable after late feedback.
Count each day once.
Starting the clock at approval leaves out the fuzzy front end (the informal idea work before sign-off). On a new product introduction (NPI), you can start concept-to-launch time the day the product concept is approved.
The example uses approval as its start.
Example TTM Calculation
An agency approves a new SEO audit service on January 12, 2026. It treats the first invoice on March 13, 2026 as the product launch, so TTM is 60 calendar days.
| Phase | Working days | Waiting days | Rework days | Total | Main wait |
|---|---|---|---|---|---|
| Ideation | 3 | 7 | 0 | 10 | Partner sign-off on the service brief |
| Design | 8 | 6 | 2 | 16 | SEO specialist booked on another client |
| Testing | 7 | 8 | 4 | 19 | Pilot client reviewing the first audit |
| Market introduction | 5 | 10 | 0 | 15 | Contract terms waiting for legal |
| Total | 23 | 31 | 6 | 60 |
Each row total is that phase’s lead time. Waiting share is waiting days divided by total days: 31 of 60, or 52%. Waiting took more days than work, and market introduction alone waited 10 days. Fix that phase first on the next launch.
Run the same split on your last launch. Take working days from timesheets, waiting days from approval and booking dates, and rework days from reopened tasks.
Why Is Time to Market Important?
TTM is important because every week of delay is a week of revenue the launch never earns back. The market window and product lifecycle stay fixed, so a late launch sells for fewer weeks.
Market trends and competitor releases set when that launch window closes, not your plan.
A late product launch keeps the team booked, so the next launch in your product portfolio starts late too. Revenera’s 2024 survey of 418 technology leaders ranked delayed feature releases as the top barrier to recurring revenue growth.
Launching first wins the early customers, and their usage gives you market signals competitors cannot see yet. That lead is the first-mover advantage. It turns into a lasting competitive advantage only if product quality holds.
Teams that skip user needs for rapid market entry often struggle with customer satisfaction and retention.
A missed date costs brand reputation even when the work is good, because the client planned around it. In product development, shorter launches mean more release cycles a year, so product innovation reaches real customers more often.
What Are the Key Performance Indicators (KPIs) for Measuring TTM?
The KPIs for measuring TTM are total days, phase cycle time, waiting share, on-time delivery rate and change turnaround.
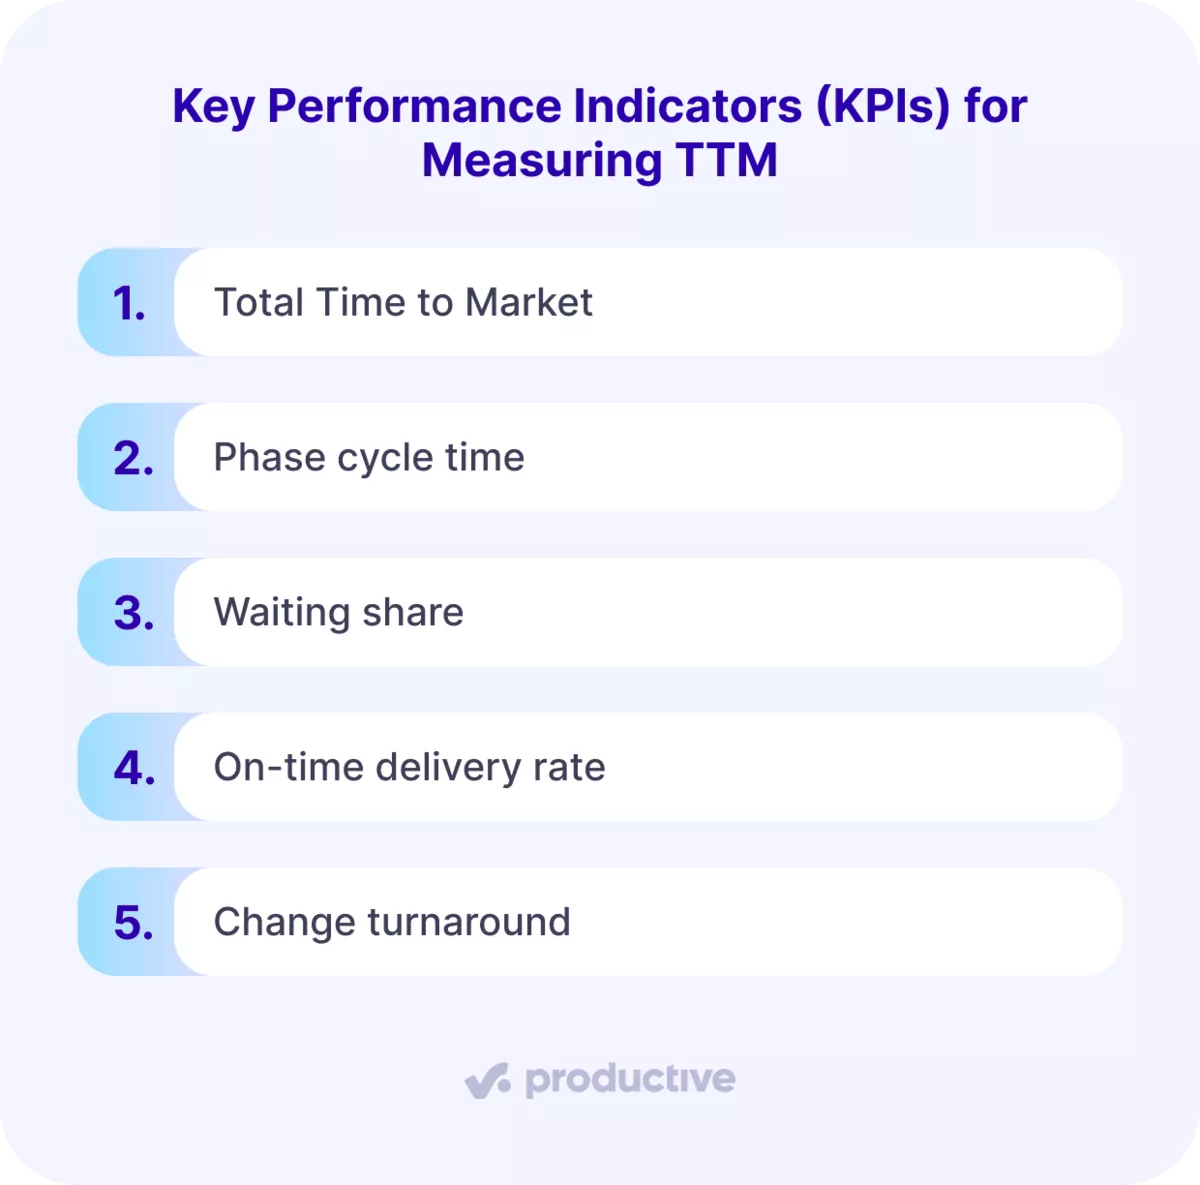
- Total TTM: calendar days from your start date to your launch date. Compare it launch to launch, on the same two end points.
- Phase cycle time: the lead time of each phase, from its start to its sign-off. Read it next to the waiting share, since a long phase may be mostly waiting.
- Waiting share: waiting days divided by total days. When it passes half, as in the worked example, fix approvals and bookings before asking anyone to work faster.
- On-time delivery rate: launches shipped on or before the promised date, as a share of all launches. When it falls, check how the missed dates were set before you check delivery.
- Change turnaround: days from a change request to a signed decision. Requests that wait longer than two working days stall the phase behind them.
Software teams can add sprint velocity: the work a team finishes per sprint (a fixed one- or two-week cycle). A falling sprint velocity warns you that the current phase will run long, before any date moves.
Compare KPIs only between launches of similar scope, such as two new product introductions, or the gaps mislead. TTM KPIs measure time; other delivery metrics worth tracking cover estimates, schedule variance and utilization.
Track every KPI of Time to Market with Productive
What Are the Factors Influencing TTM?
The factors influencing TTM are your development strategy, delivery method, team setup and resource allocation. Each one adds working, waiting or rework days to the calendar.
Resource planning and workflow fixes mostly cut waiting days, because they decide who is free and when.
Cross-functional teams cut waiting too, because a brief no longer queues at each department’s handoff. Book people for the dates you need them, so the launch timeline matches the plan.
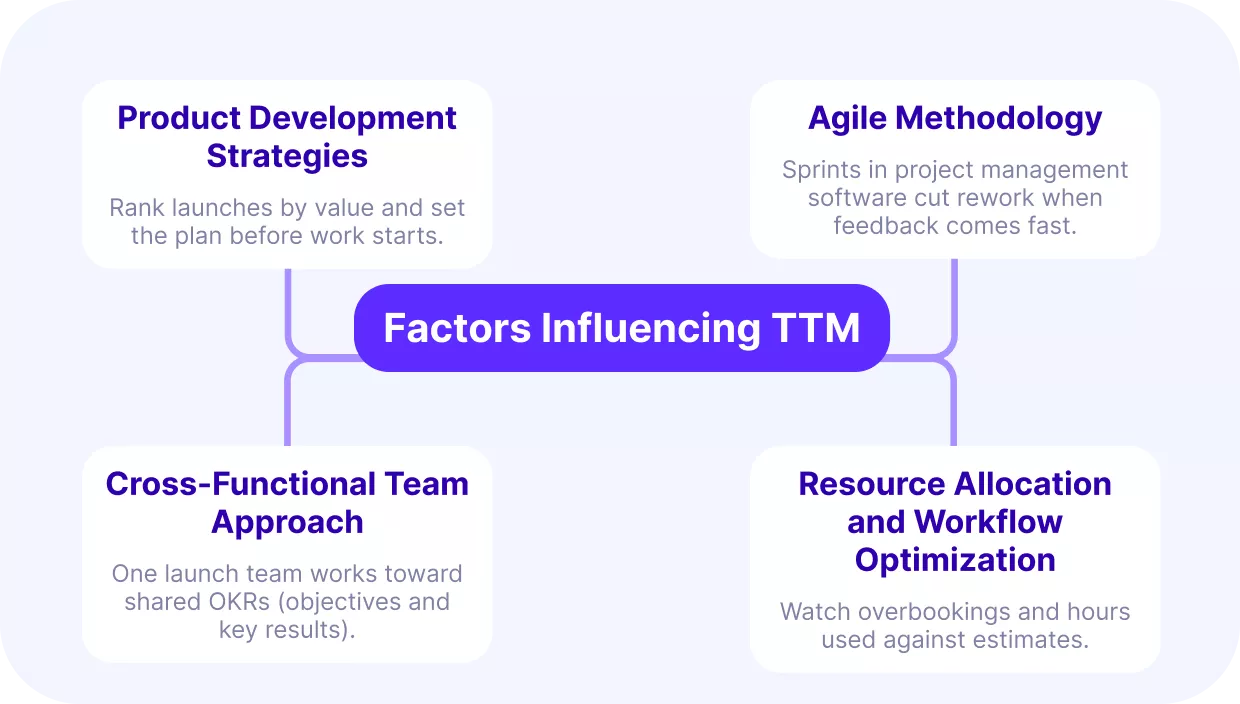
Product Development Strategies
Your product development strategy decides which market opportunities you chase and in what order. Fix it before the first task is assigned, so later changes arrive as decisions instead of surprises. Rank each launch against the rest of your product portfolio, so the most valuable one gets staffed first.
- Write a go-to-market plan that sets the product strategy, the market strategy and a target date for each phase.
- Use automation software and integrated systems to cut manual re-entry between legacy systems.
- Start with an MVP (the smallest version a client will pay for) to gather early feedback while development continues.
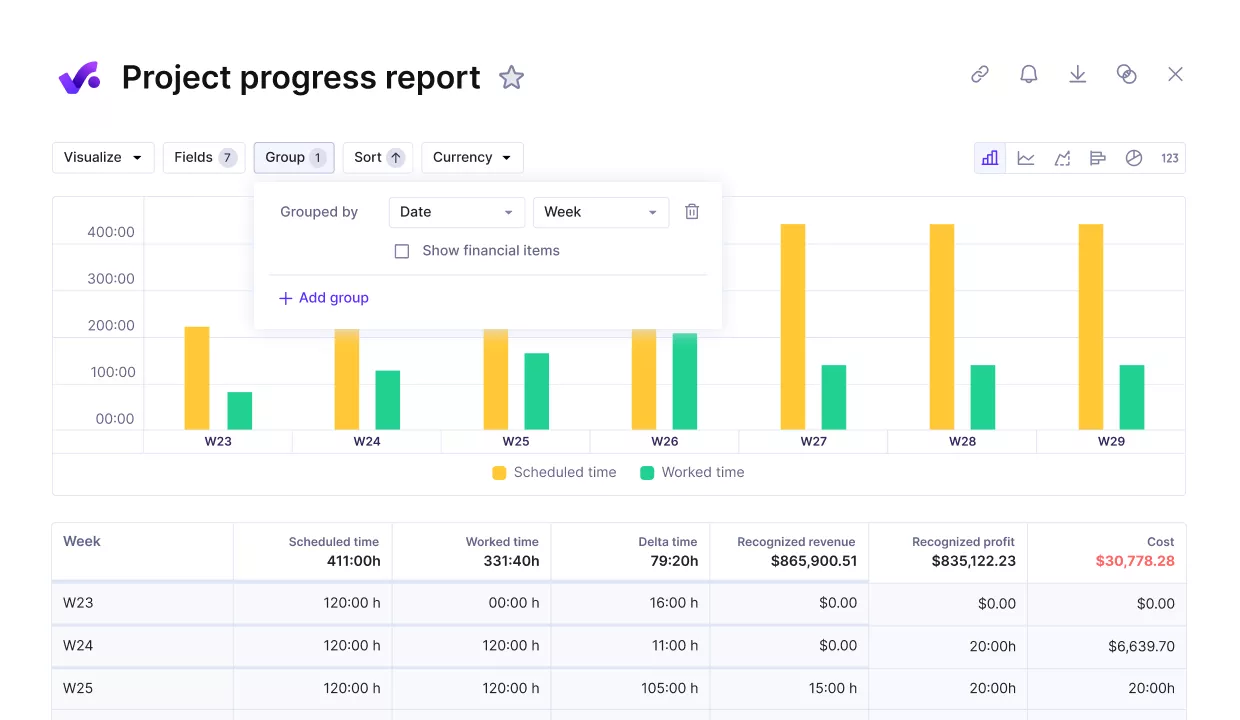
Project progress report comparing scheduled and worked time by week.
Agile Methodology
Agile methodologies cut rework by shortening the time between building something and hearing it is wrong. The saving depends on reviewers: an Agile workflow only helps if feedback arrives inside each sprint.
Agile working splits the development cycle into short releases, so problems show up within weeks. It does nothing for a client sign-off that waits in someone’s inbox, so track those waits separately.
Software teams can run the cycle in Agile project management software.
Cross-Functional Team Approach
The team approach puts design, engineering and legal on one launch team, so work stops waiting at handoffs. Clear objectives and one shared definition of done let people decide without escalating.
- Daily check-ins and one feedback loop with the client clear roadblocks before they cost days.
- Cross-training initiatives build understanding of other roles, so handoffs need less explaining.
- Shared tools: set OKRs (objectives and key results) and track progress against the same goals.
Name one tiebreaker for conflicting priorities, usually the launch owner from product management or account management. Without one, every conflict escalates and the phase waits for the answer.
Resource Allocation and Workflow Optimization
Resource allocation means deploying budget, people and tools against the plan, then watching two numbers that predict slippage. The first is who is overbooked next month. The second is how many hours a deliverable has used against its estimate.
Neither exists if nobody logs time. Without timesheets, you cannot show that a phase ran 30 hours over a 40-hour budget. You also cannot say who has capacity for the next client.
Three checks catch slippage early: bookings against capacity, logged hours against the estimate, and a dated scope sign-off. Miss one and the gap turns into calendar time you only see at the launch review.

Productive’s budget Time warning alerts the budget owner when billable hours reach the share of the estimate you set.
In Productive, the Resource Planner shows each person’s bookings next to their availability. A budget’s Time warning alerts the budget owner when billable hours reach a set percentage of estimated hours.
Track Time to Market With Productive
See each person’s bookings next to their availability, and get an alert as a phase’s hours near the estimate.

What Are the Real-World Examples of TTM?
Real-world TTM examples include Airbnb’s ten-month launch, COVID-19 vaccines in under a year and Rivian’s first electric pickup:
- Airbnb went from three air mattresses in October 2007 to a public launch on August 11, 2008. The founders tested the product idea first, with a simple website and three paying guests.
- Pfizer and Moderna had COVID-19 vaccines authorized in under a year, against a usual 10 to 15 years. Developers overlapped trial phases and manufactured doses at financial risk during phase 3, before regulatory approvals arrived.
- Rivian bought a closed Mitsubishi plant in Normal, Illinois, in January 2017 instead of building a factory. The R1T pickup was unveiled in 2018 and entered production in September 2021. It still reached the market with the first electric pickup, ahead of larger automotive industry rivals.
Each example removed a different kind of delay. Airbnb lowered the risk of rework by proving demand before the build. The vaccine makers cut waiting time by overlapping phases.
Rivian skipped factory construction, yet pandemic delays and a chip shortage still moved its date twice. Services follow the same clock. The agency SEO audit in the worked example had a 60-day time to launch, from approval to first invoice.
Physical products add waits from regulatory requirements, manufacturing processes and the supply chain, as the vaccines and Rivian show.
What Are the Biggest TTM Challenges?
TTM’s biggest challenges are scope added after sign-off, approvals with no named owner, and dates promised before capacity checks.
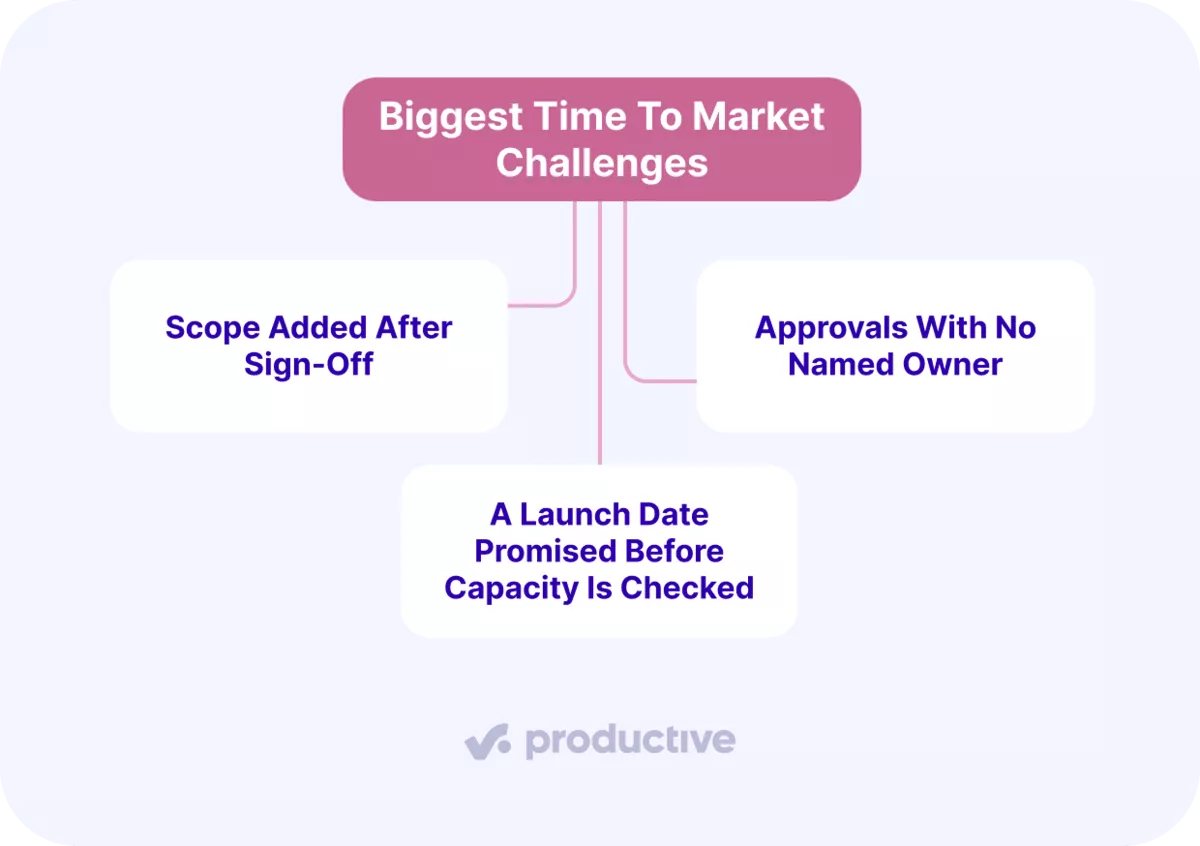
Scope Added After Sign-Off
Scope added after sign-off is work agreed mid-phase without moving the launch date. Each addition looks small, which is how scope creep builds up. Example: in a status call, the account lead agrees to one extra page, and design runs 30 hours over.
The account lead says yes to protect the relationship. The product requirements change, and nobody updates the estimate or the launch timeline.

Map Launch Dependencies in One Gantt Layout
Route every addition through a written change request with the added hours, added cost and revised launch date. The launch owner signs it before anyone starts the work.
If the revised date on the request matches the old one, the request is wrong and goes back.
Approvals With No Named Owner
An approval with no named owner waits until someone notices it. Every day it waits adds a calendar day to your launch when the next phase needs it. You send a brief to “the client team” or “legal”, and nobody there owns the reply.
- Write the approval workflow as one log, one row per approval: brief, design, client sign-off, legal review. Regulatory hurdles get their own rows, one per compliance check your regulatory requirements call for.
- Give each row one named approver and a response limit of two working days. Automation software can send any approval past its limit to the launch owner the next morning.
- A phase does not start while its row has no name or no due date. The log makes the bottleneck visible: one row past its date is one phase that cannot start.
A Launch Date Promised Before Capacity Is Checked
You promise a launch date while the deal is still in the CRM system, before anyone checks capacity. The specialists it needs are booked elsewhere, so the first phase waits for their first free week. Nobody sees the gap until kickoff, and by then the client has the delivery timeline in writing.
When a market deadline such as a trade show sets the date, a slip costs the client the event.
Before the date goes to the client, check bookings for every role the launch needs, phase by phase. List each role, the weeks it is needed, and its current bookings in those weeks. If any role is over 100% booked in those weeks, move the date or cut scope before sending it.
Tools that check team capacity can run this check for every deal.
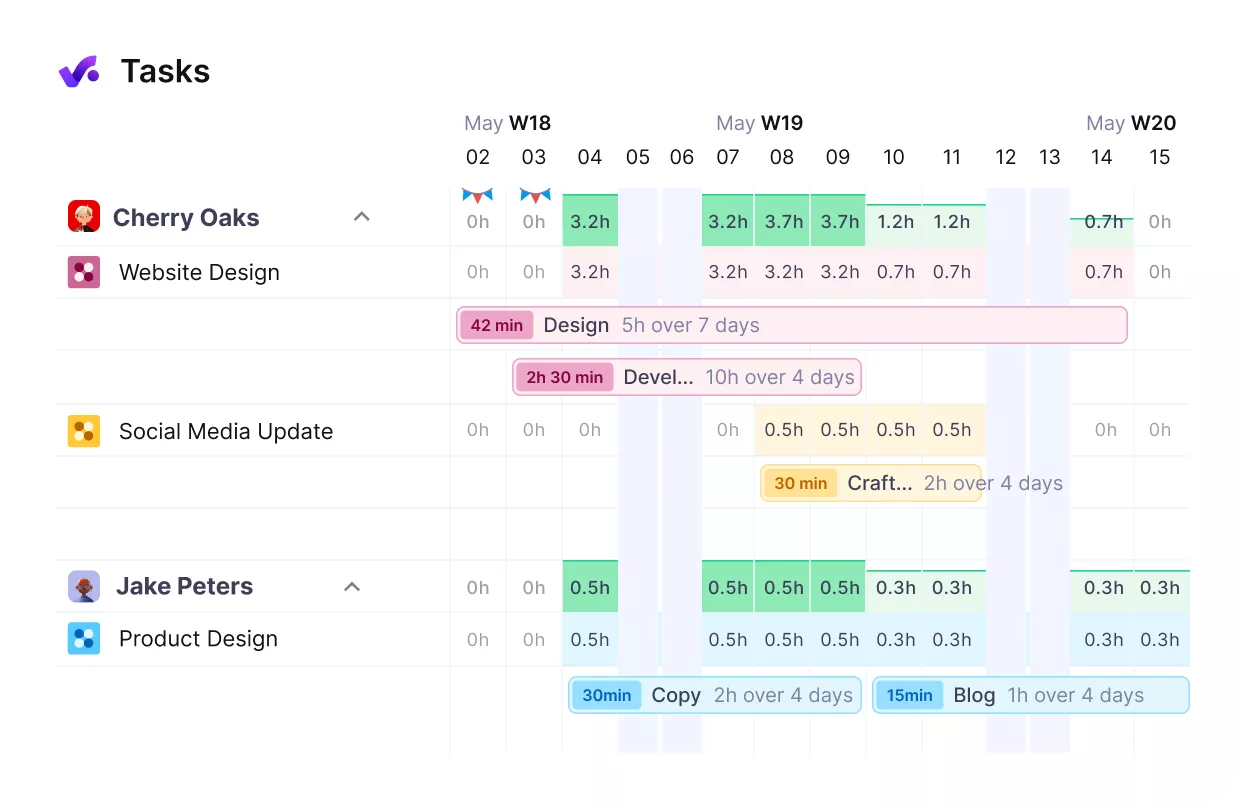
Plan launches with real-time capacity overviews.
That check is capacity planning done at the deal stage, when moving a date still costs nothing. Record which option you chose on the deal, so the next estimate starts from real capacity.
How Do You Reduce Time to Market?
For a faster time to market, ship an MVP, overlap phases, measure each launch, and track phase overruns. Each produces one artifact you can check: an MVP scope, a dependency list, a launch log, a phase report. For the fourth, start with our ranked list of PM tools.
None of the four needs Agile methodologies, though Agile teams will recognize the first two.
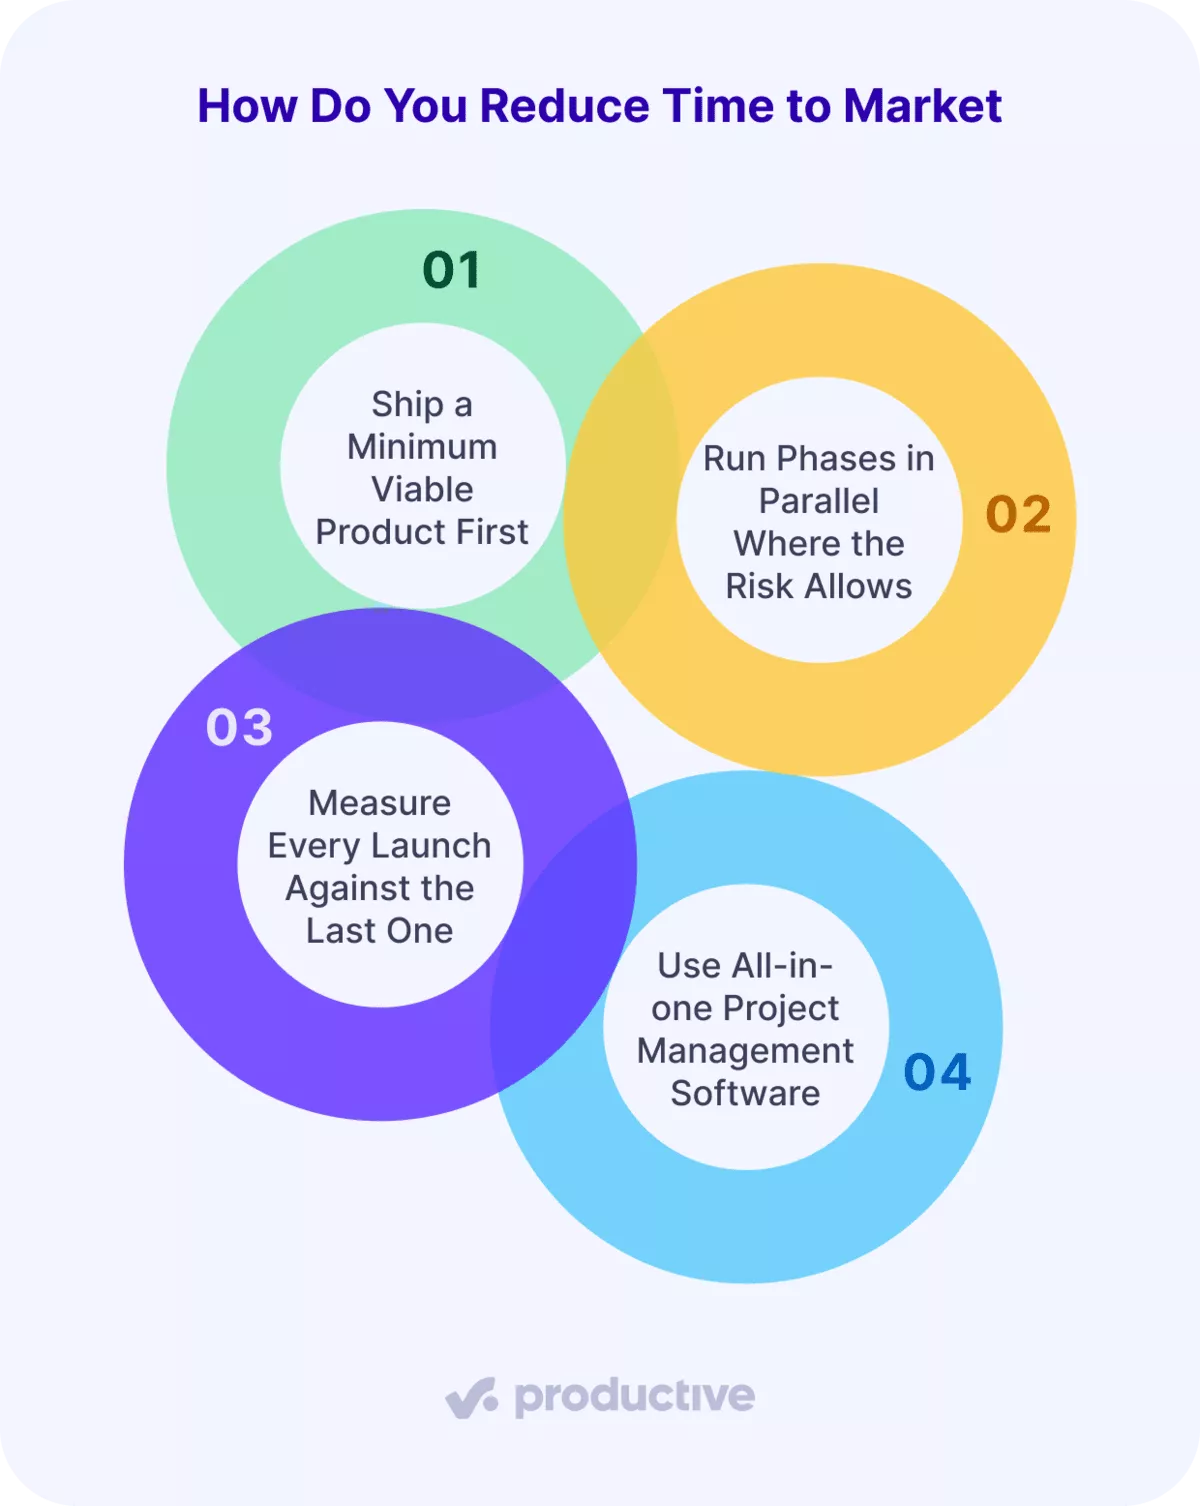
1. Ship a Minimum Viable Product First
Ship the MVP first: the smallest version of the offering that a client will pay for. Airbnb’s three paying guests were an MVP. For a service, features are deliverables: the SEO audit could launch with the report and add the dashboard later.
Write a one-page MVP scope that lists each feature next to the customer interview or signed request behind it. Set a cap for release one before anyone adds to it, such as five features or six weeks. A feature with no customer interview or request behind it moves to release two.
Customer feedback from release one sets the scope of release two. Put release two on the product roadmap with a date, so deferred features stay visible.
2. Run Phases in Parallel Where the Risk Allows
Phases can run in parallel whenever the later one does not need the earlier one’s finished output. The phase-gate model (also called stage-gate) runs each phase only after the last one passes review.
That default is safe, but each gate review adds waiting days to the launch cycle. Manufacturers call the overlap concurrent engineering, and it shortens the critical path (the longest chain of dependent phases).
Write a dependency list with one row per phase and the input it needs before it can start. For the SEO audit, the launch page needed only the approved price, so it could be drafted during testing.
A phase starts the day its named input exists, whatever the previous phase is doing. Agile working makes this easier, because short cycles produce reviewable output sooner.
The vaccine makers did this at scale, running manufacturing alongside phase 3 trials. Overlap only where an upstream change would cost less than a day of rework downstream. If an upstream change would throw away finished work, keep those phases in sequence.
3. Measure Every Launch Against the Last One
Measure every launch against your last one, using the same start date, end date and KPIs each time. Keep a launch log with one row per launch: start date, launch date, idea-to-launch time and waiting share.
Log quality assurance fixes as rework days, so a fast launch with heavy rework stays visible.
Treat project risk management as a phase-gate task: reassess risks at every gate, with key stakeholders in the room. Keep some slack in each phase for the risks you find. After each launch, a short Lean or Six Sigma review lists the three phases with the most waiting days. Lean methodology targets waiting, and Six Sigma targets rework, so use whichever matches your biggest column.
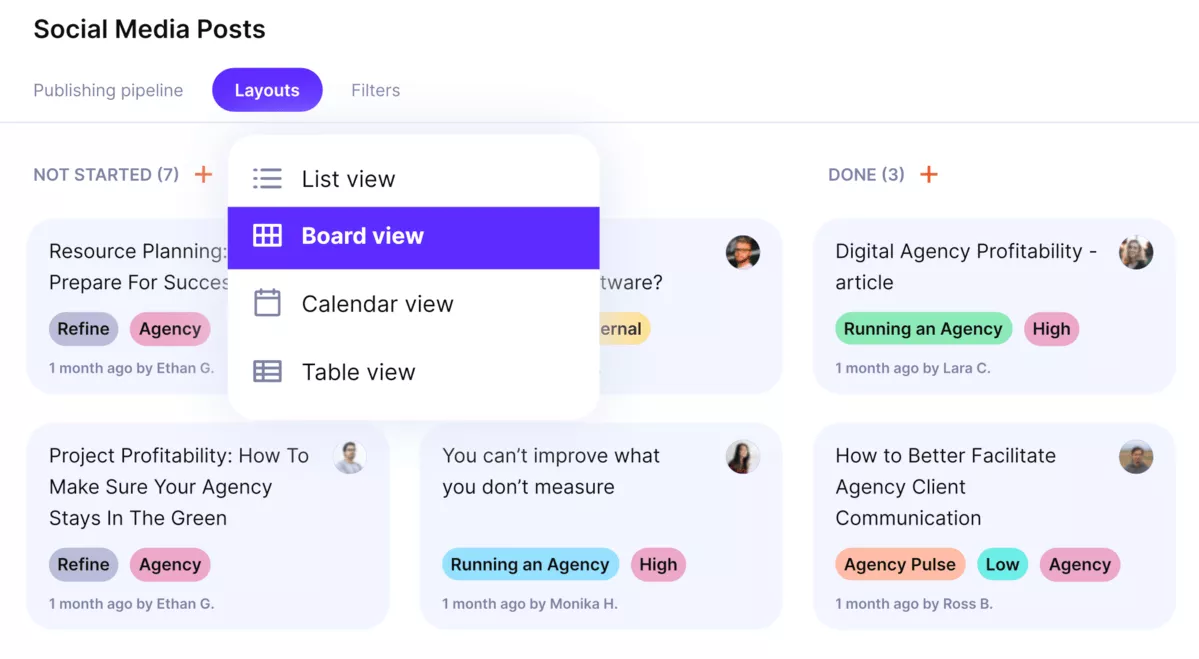
Plan and track sprints in Productive’s Kanban view.
Teams on Agile methodologies can feed sprint review notes into the same log. Read the log across your product portfolio to see which launch types run longest. Base the next estimate on what previous launches actually cost in days, not on what their plans said.
4. Use All-in-one Project Management Software
The software to look for logs hours per phase, shows overbooking, timestamps approvals and compares planned to actual days. Test each candidate with one phase report on product cycle time. A single screen should show which phase ran over, and by how many days.
In Productive, you can book a specialist tentatively on a deal before the client signs. The Resource Planner can count those tentative bookings in capacity, so the launch date is set against real availability.
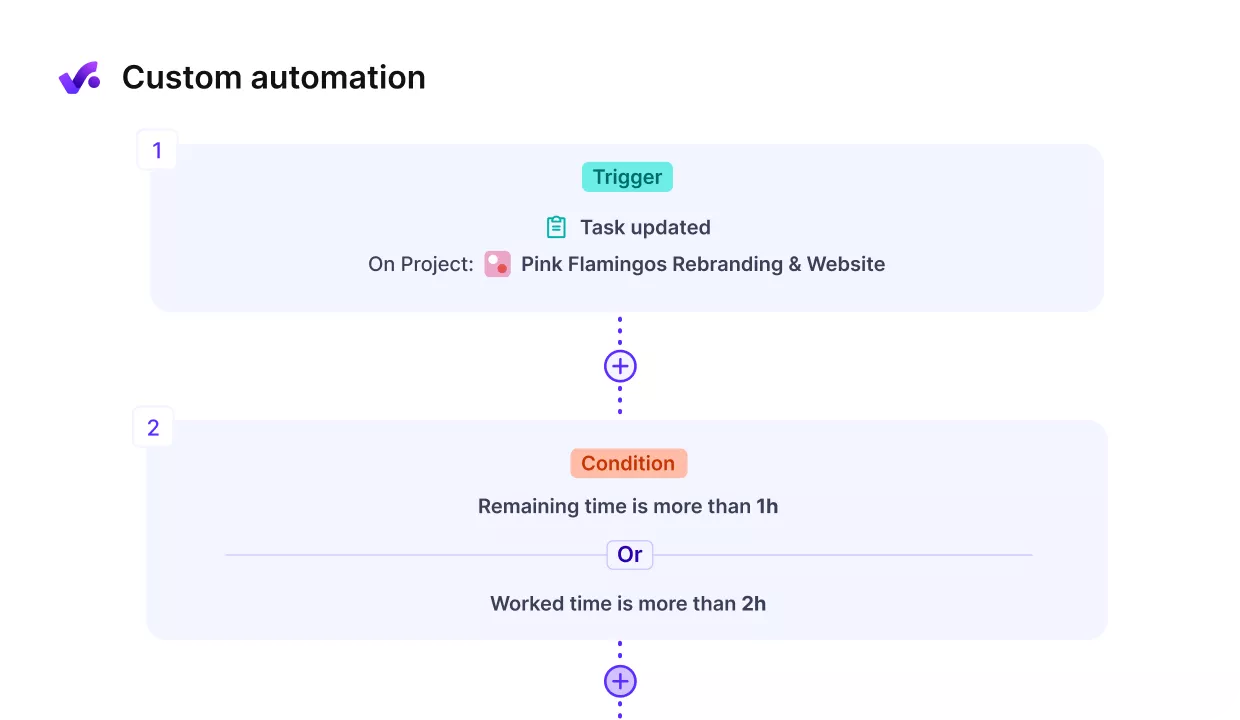
Send automated reminders for reports and phase checks.
Automation software should flag a phase as it passes its estimate, using real-time data rather than a weekly export. If phase data is split across legacy systems and spreadsheets, the waiting time you want to cut stays invisible.
Treat AI tooling as a bonus: it helps only when the hours and dates it reads are complete.
Final Takeaway
Speed and quality stop competing once the schedule shows what each phase costs in days. Name the standards you will not trade, usually a full QA pass and a dated scope sign-off. That is how you get a faster time to market without a rushed release cycle.
If your phase data is spread across several tools, book a demo or start a free two-week trial.
Catch Phase Overruns Before the Launch Date Moves
Productive’s budget Time warning alerts the budget owner when billable hours reach the share of the estimate you set.