Project Management Reports: How To Write + Best Practices

Project management reports turn progress, budgets, and resources into clear insights that guide real action.
In case your reporting eats up hours but still leaves leaders with more questions than answers, you’ve come the right place.
In this guide, we’ll teach you how to make your own reports, the best practices, how to solve the common challenges, and how to use tools to make this process smoother and automated.
Key Takeaways
- Project reports work when managers tie them to clear metrics and assign next steps to owners.
- Automated dashboards replace manual exports, cut errors, and give stakeholders live clarity.
- Utilization, variance, and profitability are the metrics that trigger the most valuable decisions.
- Sharing reports on a set schedule builds accountability, while naming owners makes actions measurable.
What Are Project Management Reports?
Project management reports are structured documents that track progress, budgets, resources, and risks so managers and clients can act. They scope project health across delivery, financials, and staffing, with a cadence set weekly or monthly depending on complexity.
Their readers are clients who expect clarity, executives who review profitability, and project teams who act on tasks and outcomes.
As an example, take a design agency that sends a weekly project reporting update. The project manager owns the report, flags utilization variance, and assigns tasks to team leads.
The client sees the same reporting in the project management context, keeping budgets and progress visible with no surprises. This mix of cadence, audience, and ownership keeps reports useful instead of busywork.
Why Are Project Management Reports Important?
Project management reports are important because they turn raw information into actions that teams and clients can trust. A utilization report shows when a team is stretched too thin. The project manager owns it and hires a freelancer to ease the load.
That single choice flows straight from a metric into a staffing action.
A variance report is another example. It highlights tasks slipping behind schedule. The account lead spots the gap and calls a replan with the delivery manager. They shuffle priorities and reset the project milestones with the client.
That decision keeps deadlines intact and trust in place. Reports matter because they point to the next move, with owners and outcomes clear.
What Are the Types of Project Management Reports?
Project management reports come in several types, including project status reports, utilization, profitability, risk, KPI dashboards, and custom client reports. These types give managers and stakeholders different views of the same project so they can act quickly.
Below are the main types and how to use them in practice.
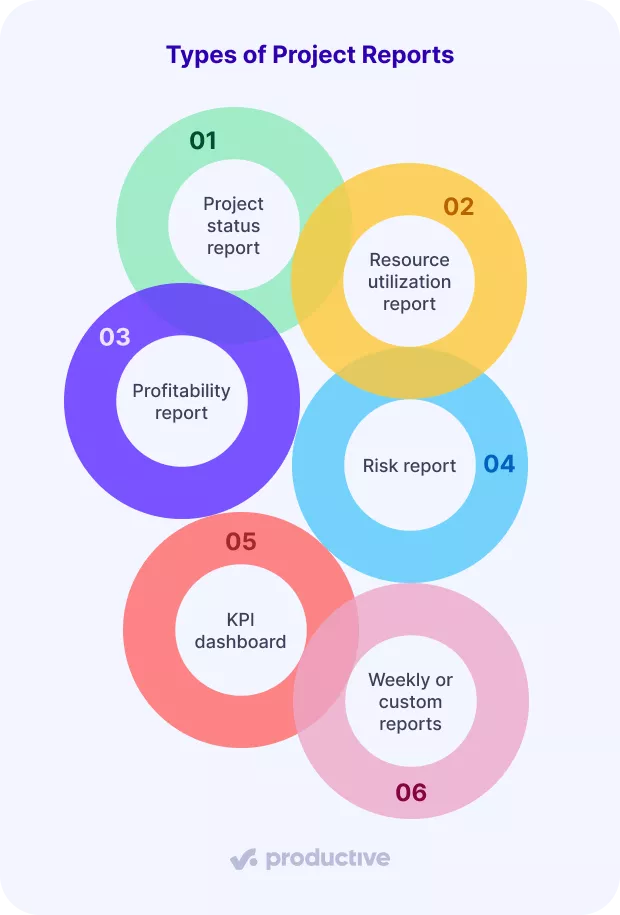
1. Project status report
Project status reports give a snapshot of project progress, blockers, and project milestones. They include completed tasks, open issues, and next steps. The project manager owns the report and decides what actions to escalate.
For example, late project deliverables trigger a replan with the client.
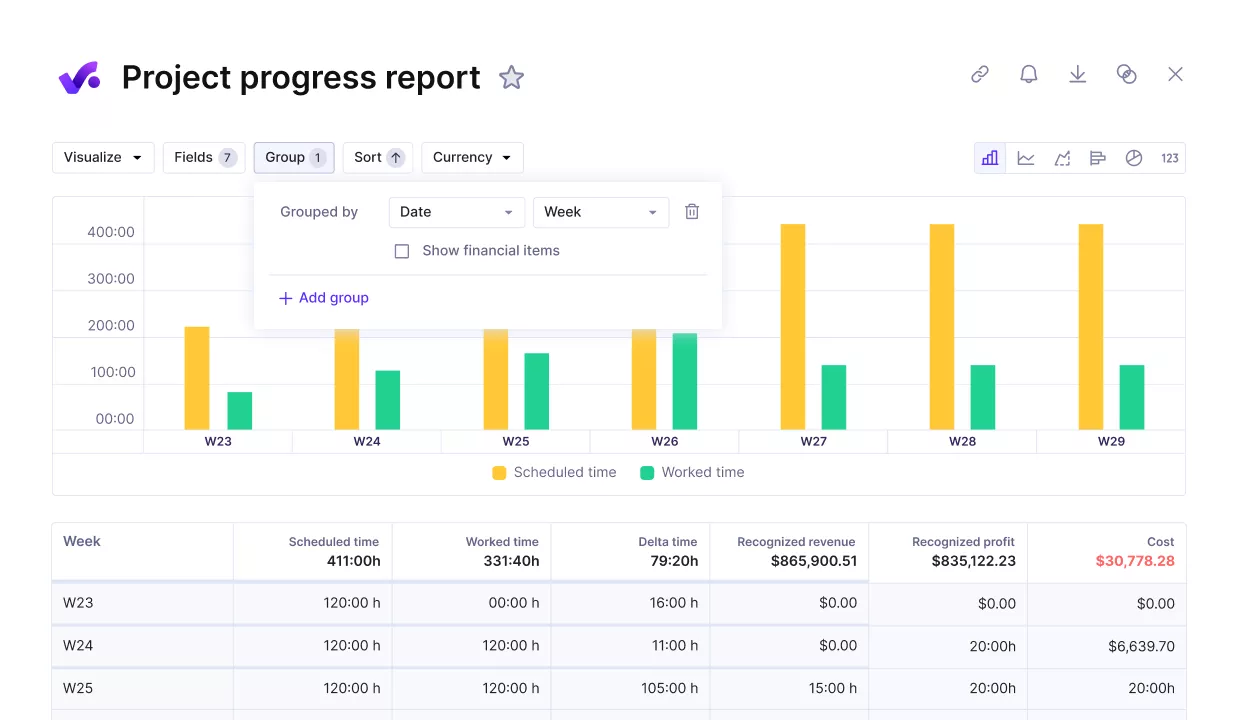
Get real-time reports on project progress against key metrics.
2. Resource utilization report
A resource utilization report shows how team hours match capacity. It includes billable and non-billable time split by role. The operations lead reviews utilization and decides to reassign tasks or hire a freelancer.
This decision protects timelines and prevents burnout.
See your actual capacity and employee utilization.
3. Profitability report
Project profitability reports track revenue versus cost at the project or client level. This cost-benefit analysis includes actuals, forecasts, and margins. Finance or account leads own the report and act by adjusting pricing or renegotiating scope.
This action keeps projects sustainable and clients informed.
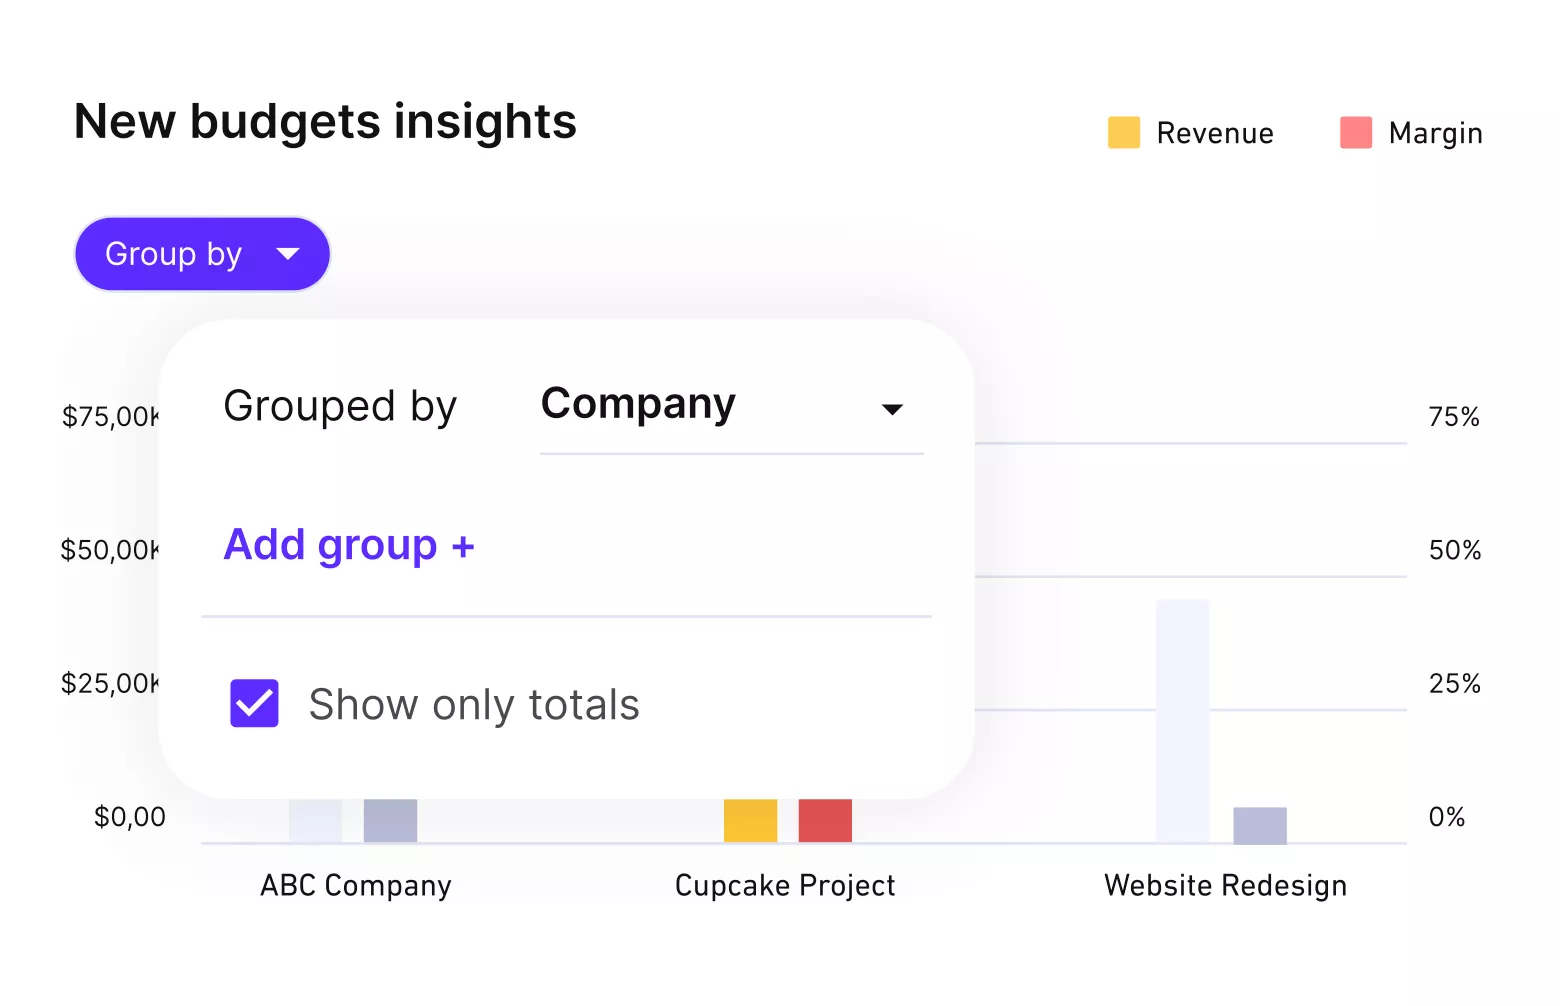
Get real-time budget updates and profitability reports.
4. Risk report
Project risk reports highlight potential threats with probability, impact, and owner. They include open risks, mitigation steps, and deadlines. The project manager owns the list and triggers mitigation plans.
For example, supplier delay risk prompts ordering alternatives early. We talk more about risks (and what to do with them) in our risk management guide.
See who’s overbooked and who’s available for more work.
5. KPI dashboard
Technically, a KPI dashboard is a tool feature; however, since it aggregates metrics like budget variance, schedule variance, and client satisfaction, it’s often used as a custom report.
It includes thresholds and targets for quick checks.
Executives own the dashboard and decide if intervention is needed. For example, low satisfaction KPI prompts a client check-in.
7. Weekly or custom reports
Weekly or custom reports summarize updates for clients or stakeholders. They include top metrics, completed work, and upcoming deadlines.
The account manager owns the project report and ensures delivery on schedule. For example, a custom financial report informs the client of budget health.
Automate your reporting with Productive
How Do Project Management Reports Drive ROI and Metrics?
Project management reports drive ROI because they connect metrics to outcomes that matter. A utilization metric of 90% shows a team is overbooked. The operations manager owns the data and brings in a contractor.
That action restores balance and protects profitability.
Schedule variance reports compare planned tasks with actual delivery. A ten-day variance shows a predictable delay. The project manager owns it and triggers a replan. Adjusted milestones keep the client’s trust and delivery predictable.
Budget variance reports compare forecasted costs with actual spending. A 15% overrun signals scope creep or underestimation. Finance owns the project profitability report and chooses to renegotiate the project scope or adjust rates.
That decision keeps margins safe.
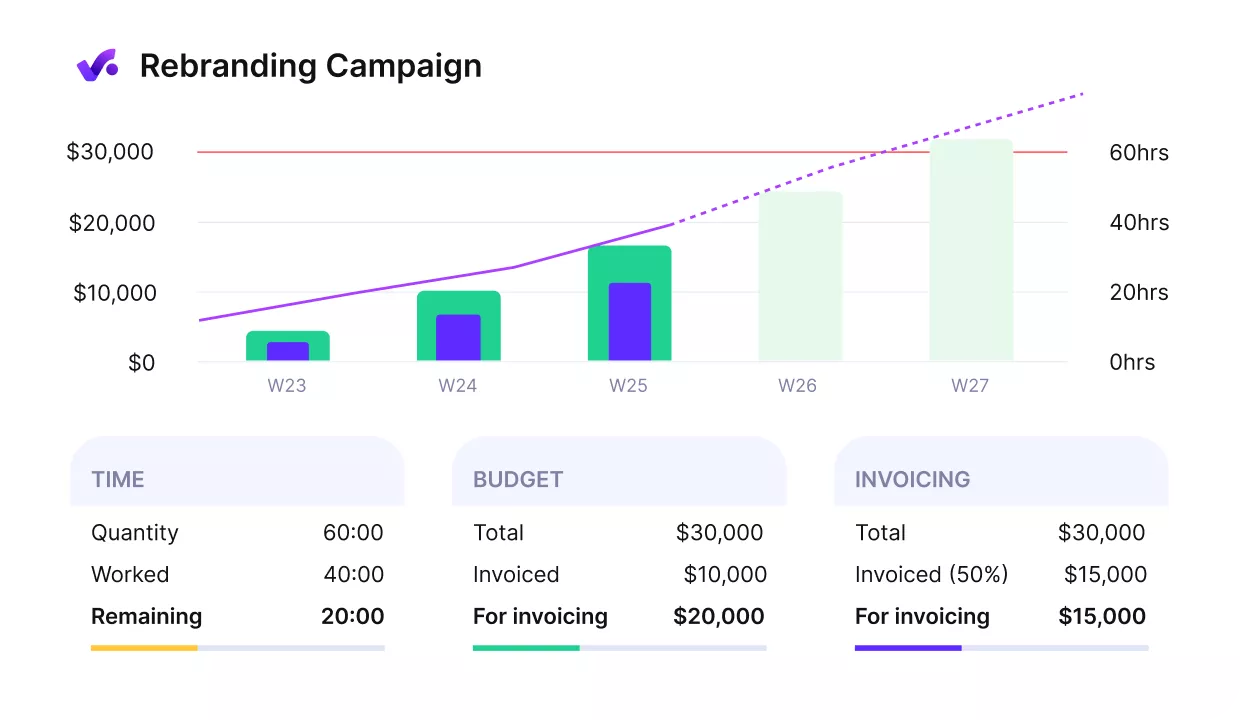
Productive gives you an early warning of budget overruns.
How Can Automation Improve Project Reporting?
Automation reduces time and errors by cutting manual entry and exports. Manual reporting means copying details into slides or spreadsheets. A project manager owns this process and risks mistakes. Stakeholders often wait days for the next update.
With real-time dashboards, data flows straight from tasks, budgets, and time tracking reports. The operations manager owns the setup and ensures information stays live. Productive dashboards show utilization, profitability, and project health instantly.
Executives and clients act on current numbers, not last week’s slides.
Use Productive’s integrated time trackers for seamless and accurate time tracking reports.
The contrast is simple: manual reporting delays action, while automated dashboards keep decisions fast and accurate. Owners know their role, actions link to metrics, and outcomes improve.
How Do You Write a Project Report Step by Step?
Project reports are written by following a clear process that defines purpose, audience, and next steps. The direct answer is that you write a project report by setting the scope, gathering information, and assigning owners for outcomes.
Here’s a checklist literally any team can use.
1. Define the goal of the project report and the audience.
For example, set whether it explains delivery to clients or profitability to executives. The project manager owns this step and ensures the project scope is clear.
2. Fix the timeframe of the report, weekly or monthly.
Link cadence to project pace (e.g., weekly for agile sprints, monthly for long retainers). The project manager owns the project schedule and signals consistency.
3. Confirm data sources like budgets, tasks, and time logs. Assign an owner to each source so information is accurate and current. For example, finance owns budgets, while team leads own task progress.
4. Select project KPIs and thresholds.
Choose three or four that link to action, like utilization or schedule variance. Executives own the thresholds and decide if intervention is needed.
5. Draft a simple outline with title, sections, and flow.
Keep sections tied to decisions, not filler. For instance, include a margin section only if account leads must adjust pricing.
6. Add visuals like dashboards or pie charts.
Use one chart per key point so meetings stay short. Operations or PMs’ own setup, ensuring stakeholders can read them in seconds.
7. Write the executive summary last.
Limit it to two outcomes and required actions. The account lead owns delivery to clients, highlighting what matters most.
8. List open risks, risk management decisions, and next steps. Assign owners and dates so accountability is visible. For example, add “John, by May 15” instead of a vague line.
9. QA the numbers, links, and formatting.
Have someone outside the project spot errors. This step protects trust with clients and prevents costly mistakes.
10. Share the report, store it in the same place, and schedule the next update.
Use one shared folder or platform so the team never hunts for information. Consistency makes reporting reliable.
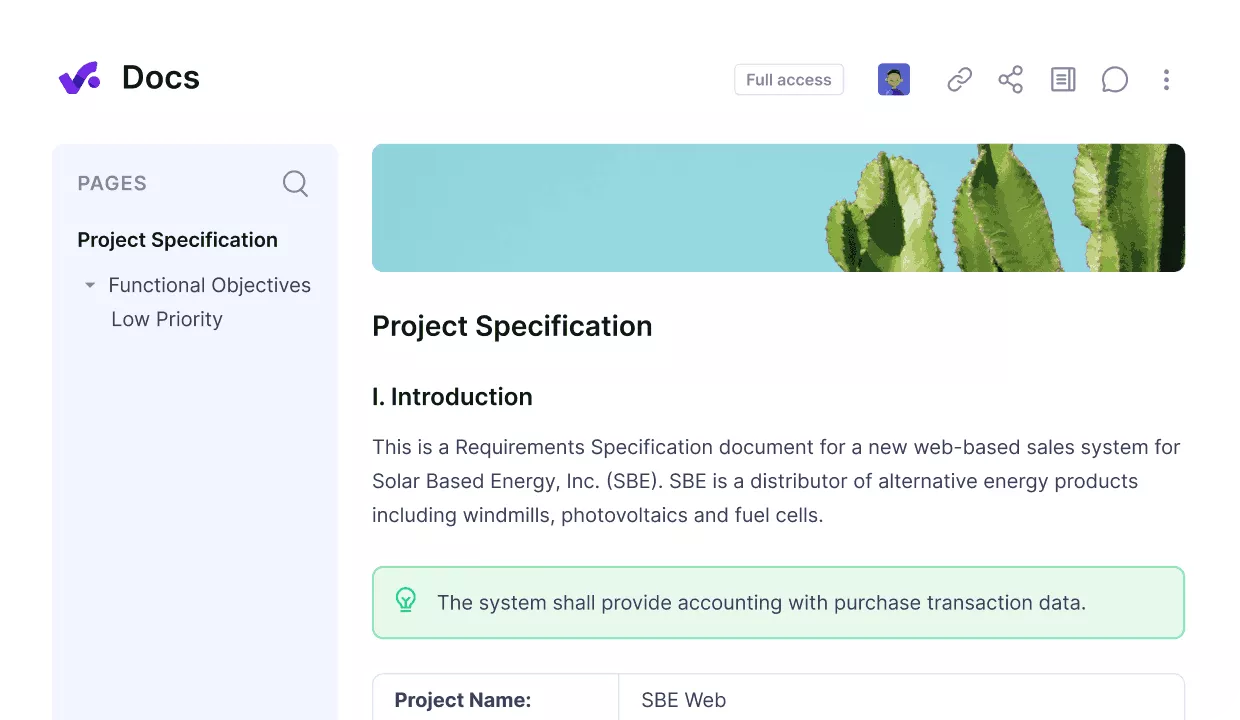
Use a single place to share, edit, and collaborate on documentation and reports.
What Are the Common Reporting Challenges? (+ How To Solve Them)
Common reporting challenges usually involve scattered information, unclear details, and misaligned team tasks across different areas. The fixes are practical when every issue has an owner, a clear action, and a measurable outcome.
Below is a breakdown of the most common problems and how to solve them in practice.
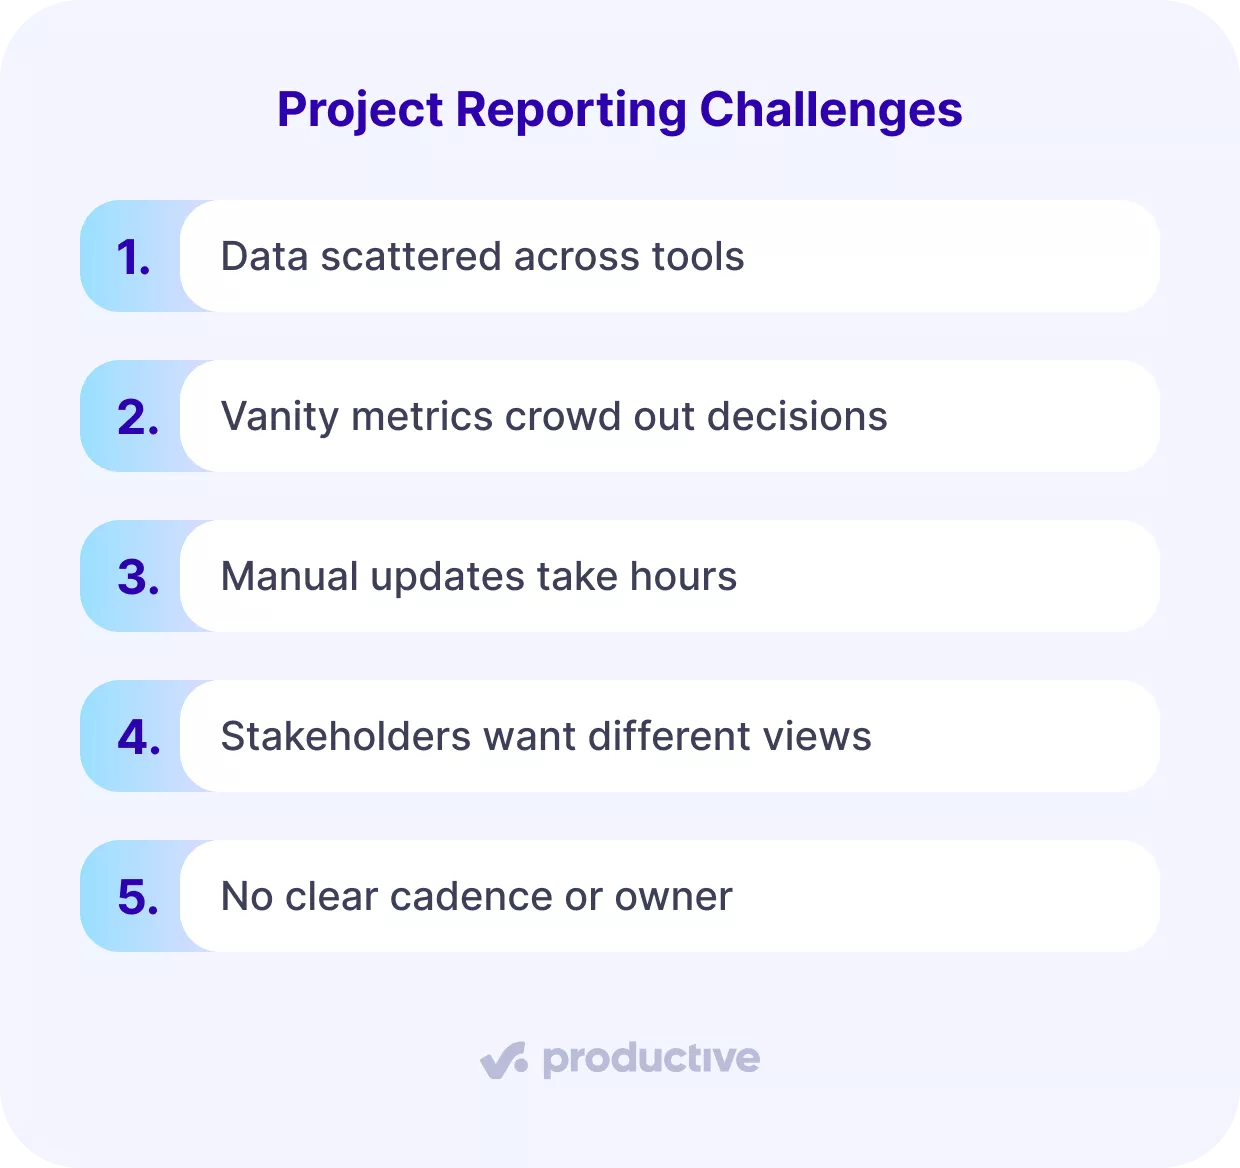
Challenge 1: Data scattered across tools
The problem is that project information sits across spreadsheets, chat apps, and disconnected tools. This causes delays, missing details, and frustration for the team. Reports become unreliable because owners pull from different sources.
How to solve:
Centralize data by moving budgets, tasks, and resources into one platform. Assign an operations manager to own integrations and automate data pulls. This action ensures that project reports are accurate, updated in real time, and ready for client or executive review.
Challenge 2: Vanity metrics crowd out decisions
The problem is that reports often highlight vanity metrics like total emails sent or hours logged without context. These details look busy, but do not guide action. Teams waste time reviewing numbers that never change outcomes.
How to solve:
Limit reports to three or five project KPIs that connect directly to business goals. Assign executives to approve metrics and project managers to update thresholds. This ensures every chart or table point leads to a decision, like repricing, hiring, or rescheduling.
Challenge 3: Manual updates take hours
The problem is that project managers often spend hours copying details into slides or spreadsheets. This slows down delivery and raises the risk of mistakes. Reports lose value when data is already outdated by the time stakeholders read them.
How to solve:
Automate reporting by connecting tasks, budgets, and time tracking directly to dashboards. Assign operations to own the setup, and the project manager to review outputs before sending.
This ensures every report is live, accurate, and ready in minutes instead of hours.
Challenge 4: Stakeholders want different views
The problem is that executives, clients, and teams often need different levels of information from the same report. One group wants details, another only wants highlights. This mismatch leads to frustration and wasted time.
How to solve:
Build role-based views using filters and permissions. Assign the project manager to prepare a high-level summary for executives and a detailed report for the team. Use the same data source so everyone works from one truth.
This way, each stakeholder gets what they need without duplication. We’ve packed bonus practical advice in our stakeholder engagement guide.
Use a single place to share, edit, and collaborate on documentation and reports.
Challenge 5: No clear cadence or owner
The problem is that reports are shared inconsistently, and no one is responsible for delivery. Teams lose trust when updates arrive late or not at all. Without ownership, actions from reports stall.
How to solve:
Assign a project manager to own the report schedule and delivery. Set a weekly or monthly cadence based on project pace, and add the timeline to calendars. Share the report in one agreed location so stakeholders know when and where to find it.
This creates accountability and ensures every report results in timely action.
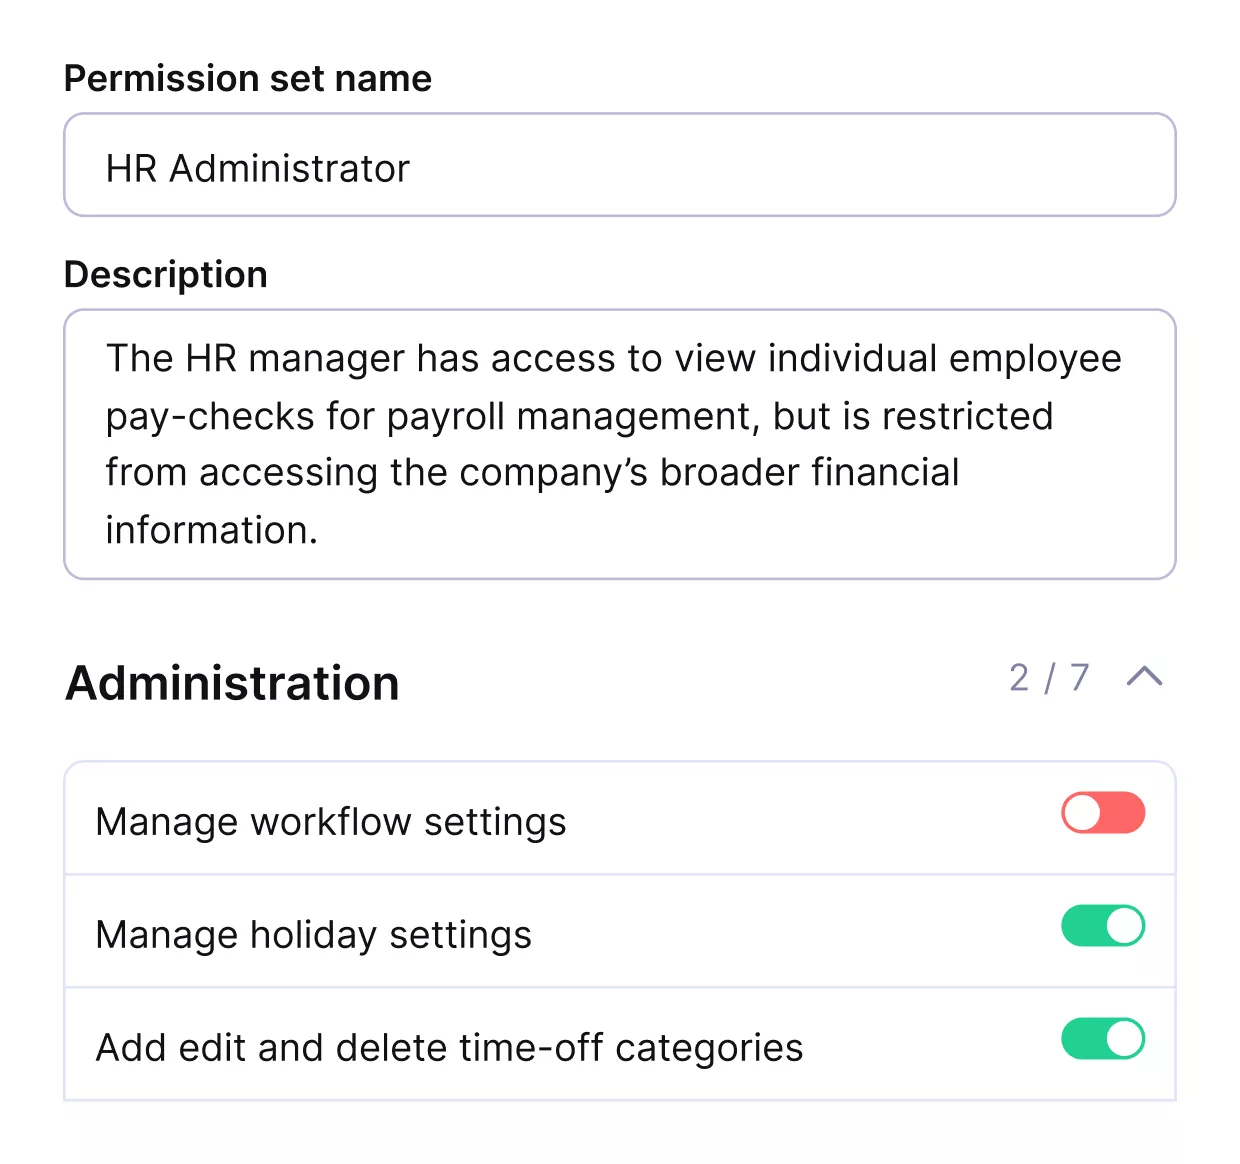
Easily add or revoke permissions.
What Are the Best Practices for Project Reports? (+ How To Implement Them)
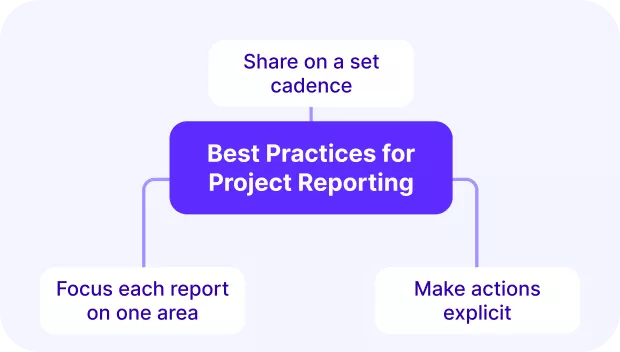
Best practices for project reports are to share them on a set cadence, focus each report on one area, and make actions explicit. These practices keep reporting simple, consistent, and tied to decisions. Below are the main practices and how to apply them in daily work.
Best Practice 1: Share on a set cadence
The practice is to deliver reports on a predictable schedule that matches the project’s pace. When cadence is unclear, stakeholders lose trust and miss signals. A steady rhythm means people know when to expect information and when to act.
How to implement:
Assign a project manager to own the schedule. Add the reporting cadence to shared calendars so no one misses it. For example, send a weekly update every Friday with progress and risks, or a monthly financial report by the first Monday.
The outcome is consistency: stakeholders know when reports arrive and can prepare decisions in advance.
Best Practice 2: Focus each report on one area
The practice is to keep each project report centered on a single focus, like budget, timeline, or resources. When reports mix too many areas, owners lose clarity, and actions stall. A narrow focus makes it easier for stakeholders to see the issue and act fast.
How to implement:
Pick one area per report, such as resource utilization for an internal review or profitability for a client meeting. Assign an owner to that area: operations for utilization, finance for profitability. Keep sections short and cut unrelated details.
The outcome is simple: reports become sharper, actions clearer, and accountability stronger.
Best Practice 3: Make actions explicit
The practice is to write reports so that actions are visible, assigned, and tracked. Without explicit actions, reports become summaries that no one owns. Teams lose momentum when the next steps are vague or missing.
How to implement:
End each report section with a line that names the action, the owner, and the deadline. For example, “Maria to deliver updated wireframes by April 20” is clear and trackable. The project manager reviews all actions before sharing the report, ensuring accountability.
This practice works because it turns information into commitments, making outcomes easier to follow up on.
Easily add or revoke permissions.
How To Choose the Right Tools for Project Reporting?
Project reporting tools should be chosen based on automation, customization, ease of use, and cost transparency. The right tool saves time, reduces errors, and gives managers reliable project management reports.
In case you want to save research time, there’s a best reporting tools list you should check out.
How Much Does a Project Reporting Tool Cost?
Typical costs range from $10-$30 per user per month for basic project dashboards. Advanced custom reports or enterprise setups can reach $50-$100 per user. Owners should also factor in hidden costs like manual reporting time, integration fees, and training.
These add up quickly if the tool is not well-matched to team needs.
Checklist for Choosing Tools
- Confirm automation covers tasks, budgets, and resources. The operations manager owns this.
- Check if dashboards and exports meet client needs. Account managers own client-ready views.
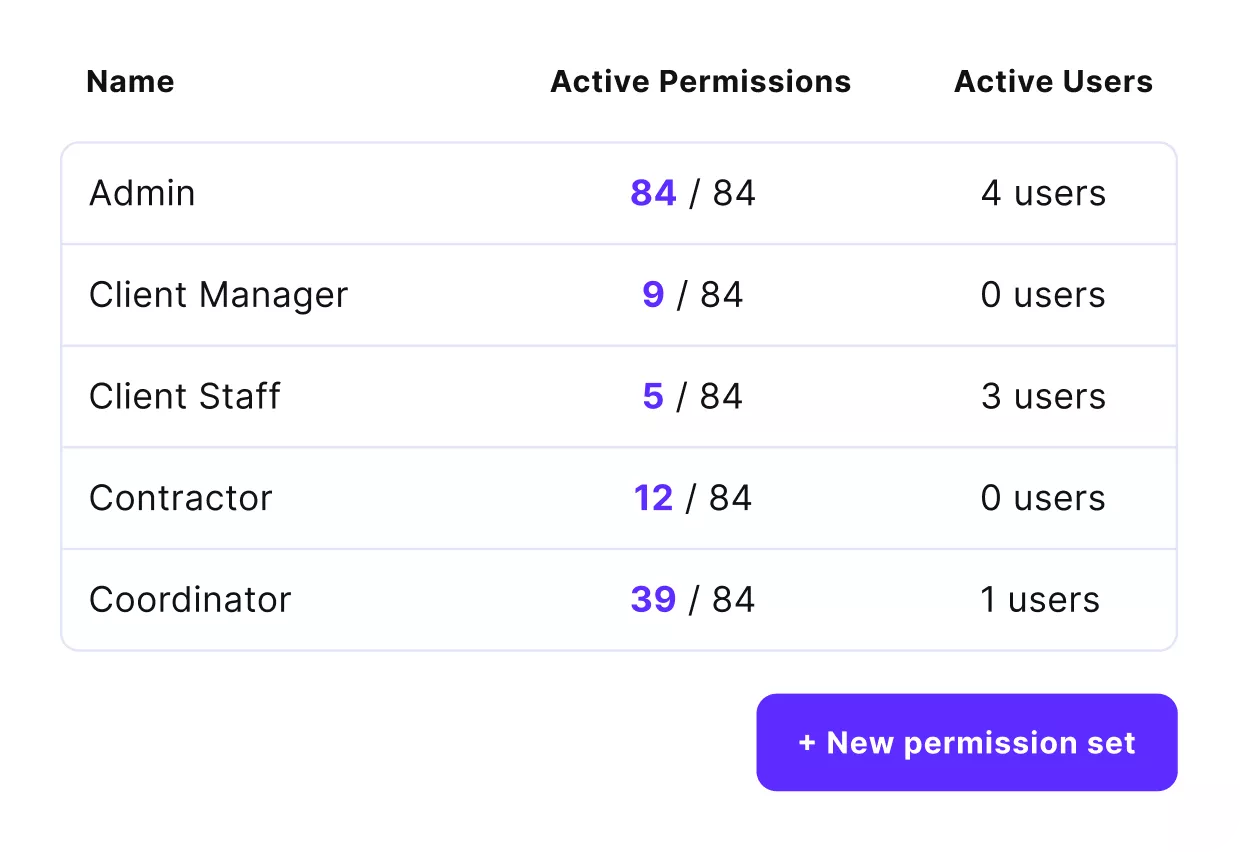
- Verify permissions and filters work for teams and executives. The project manager owns the setup.
- Review pricing tiers, hidden fees, and upgrade paths. Finance owns this step.
Productive combines reporting, utilization, and profitability tracking in one platform. This reduces overhead because data is already consolidated, and reports can be automated.
The outcome is less time spent building reports and more time for acting on them.
Closing Thoughts
Project management reports turn raw data into decisions and reduce wasted time through automation. Reports also cut overhead when automated dashboards replace static templates, making actions faster and clearer.
Don’t save money on an unreliable toolkit and centralize all data in a single platform. If you want one platform that connects budgets, time, utilization, and profitability reporting, you should check out Productive.
Book a short demo and get started today.
Get full visibility on utilization, variance, and margins in Productive
Connect tasks, time, and budgets to compare plan vs actuals, track saved costs, and monitor margins across projects.
