Top 10 Project Dashboard Software (Paid & Free) – 2026

If you’re looking for project dashboard software, the hardest part is finding a platform that shows the right project signals before budget, capacity, or stakeholder reporting problems turn into bigger delivery issues.
But hey, don’t worry. You’re at the right place.
This guide compares 10 project management software options with dashboard features, best-fit use cases, key features, user-based pros and cons, a buyer-focused comparison table, and practical advice for choosing and implementing the right setup.
What Is the Best Project Dashboard Software in 2026?
The best project dashboard software in 2026 is Productive, followed by Smartsheet, monday Work Management, ClickUp, Wrike, Teamwork.com, Kantata, BigTime, Accelo, and Adobe Workfront.
A Shortlist of the Best Tools with Dashboards
Project Reporting Tools Comparison: What Buyers Want to Know
Use this table to compare what each platform can actually help you see, not just whether it has a dashboard tab. The strongest project management software for your team depends on whether you need task status, budget burn, capacity, financials, stakeholder reporting, or a full-service business operating view.
| Tool | Best For | Data Covered | Budget Burn / Actuals | Financial Visibility | Resource Visibility | Internal vs Stakeholder Sharing | Skip If |
|---|---|---|---|---|---|---|---|
| Productive | Agencies and service businesses | Work, budgets, time, resources, invoices, profitability, reports | Strong fit for service teams tracking budget usage against delivery work | Strong | Strong | Supports internal dashboards, sharing, permissions, and client access | You only need simple task reporting without budgets, time, or resource planning |
| Smartsheet | Spreadsheet-based reporting | Sheets, reports, dashboards, forms, timelines, work data | Possible through structured sheets and reporting, but depends on setup | Moderate | Moderate | Good for internal and stakeholder reporting when permissions are configured well | You need native PSA-style profitability, billing, and resourcing in one system |
| monday Work Management | Visual reporting workflows | Boards, dashboards, tasks, timelines, workload, automations | Limited unless your budget workflow is configured around boards and columns | Light to moderate | Moderate | Good for visual stakeholder updates and internal project views | You need deep financials or service-business margin reporting |
| ClickUp | Customizable reporting views | Tasks, custom fields, dashboards, goals, time data, docs, workload | Possible with custom fields and time data, but setup quality matters | Light to moderate | Moderate | Good for internal dashboards and flexible team reporting | You want cleaner financial reporting with less configuration work |
| Wrike | Enterprise portfolio reporting | Work, portfolios, dashboards, reports, requests, workload, approvals | Better fit for structured portfolio tracking than deep PSA finance | Moderate | Strong | Strong for enterprise internal reporting and controlled stakeholder access | You need lighter reporting setup for a smaller service team |
| Teamwork.com | Client-facing reporting | Work, tasks, time data, reports, budgets, workload, client work | Good fit for tracking client work against budgets in delivery | Moderate to strong | Moderate | Strong fit for client-facing visibility | You need deeper profitability, utilization, and finance-led dashboards |
| Kantata | Professional services reporting | Delivery, resources, utilization, time data, financials, forecasts, reports | Strong fit for professional services planning and delivery control | Strong | Strong | Better for internal PSA reporting than lightweight stakeholder updates | You do not need PSA depth or a heavier services operations platform |
| BigTime | Financial reporting | Time data, expenses, billing, invoicing, utilization, budgets, reports | Strong fit when timesheets and billing data drive the dashboard | Strong | Moderate | Better for internal financial reporting than broad visual updates | You need broader visual project coordination or client collaboration first |
| Accelo | Quote-to-cash reporting | CRM, delivery, retainers, time data, billing, resources, reports | Good fit when work tracking is tied to client delivery and billing | Strong | Moderate | Useful for internal client-work reporting and some stakeholder visibility | You only need a focused reporting view, not a wider operations system |
| Adobe Workfront | Enterprise work management reporting | Enterprise work management reporting | Better fit for enterprise work tracking than service-business budget burn | Moderate | Strong | Strong for enterprise internal reporting and controlled access | You need lighter agency or service-business reporting without enterprise overhead |
How We Chose These Tools?
We chose these tools by evaluating product fit, dashboard relevance, review patterns on G2, and whether each platform helps teams run real projects rather than just display charts.
Just to be clear, this is not a BI dashboard roundup.
1. Productive – Best for Agencies and Service Businesses That Need Project, Budget, and Capacity Dashboards Together
Productive is best for agencies and service businesses that need reporting tied to the way client work actually runs: projects, budgets, time, resources, invoices, and profitability.
Instead of building reports from exported spreadsheets, teams can track delivery status, finance, capacity, and reporting from the same system where work is planned and updated.
See Where Each Project Stands Without Rebuilding the Report
Project management dashboards fall apart when status, time, budget, and resourcing are spread across separate tools.
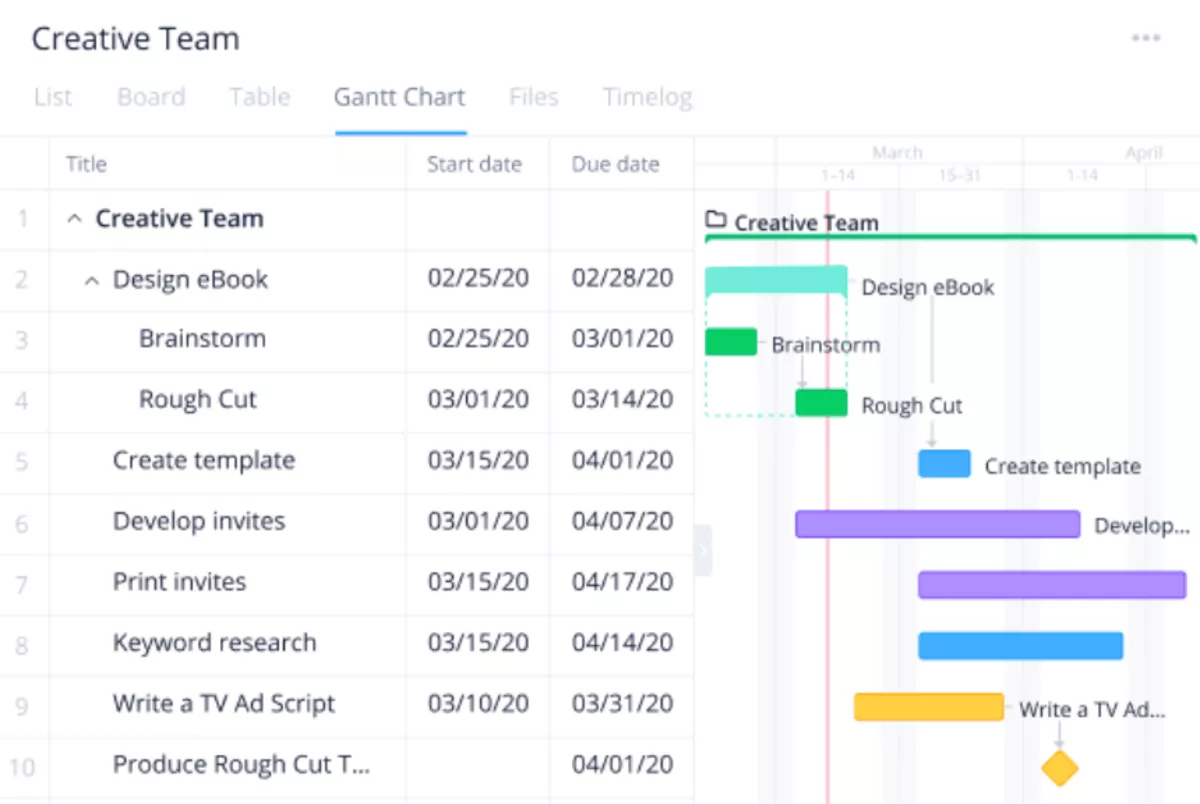
Productive lets teams add dashboard tabs inside projects, with layouts and widgets for data such as revenue, tasks, time off, finance, capacity, and notes.
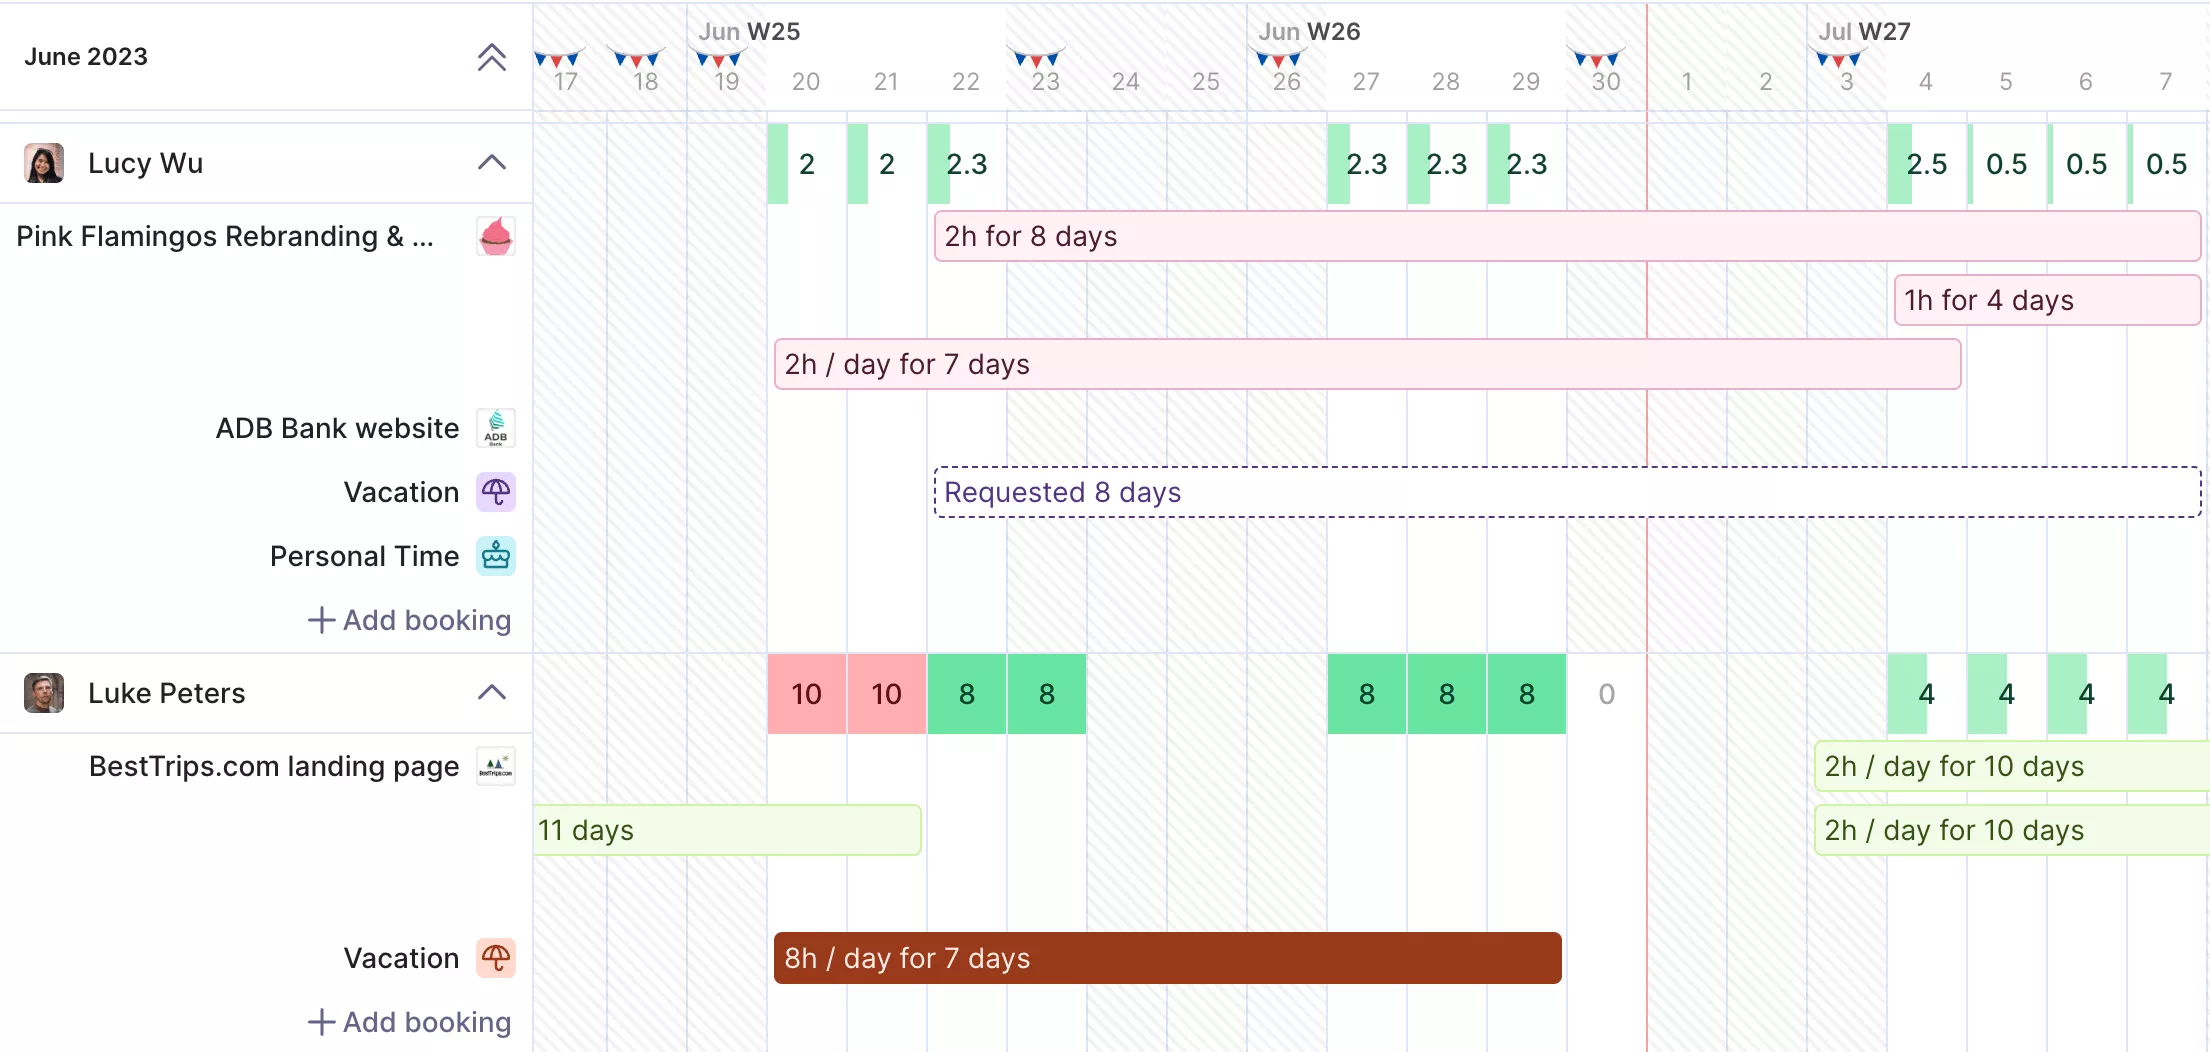
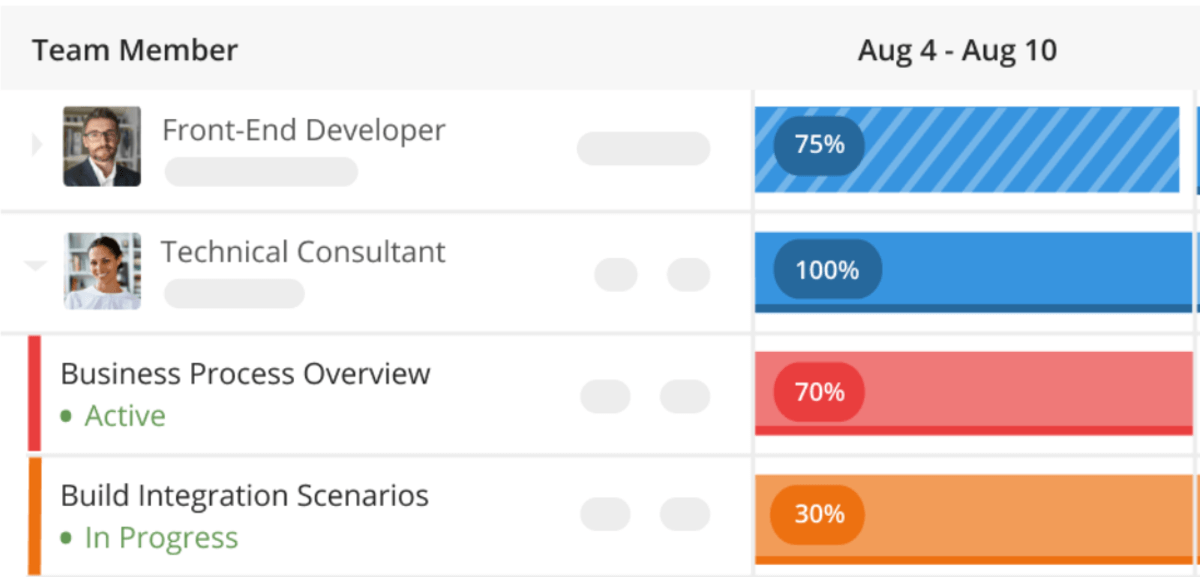
Get real time updates on team capacity, utilization metrics or free time.
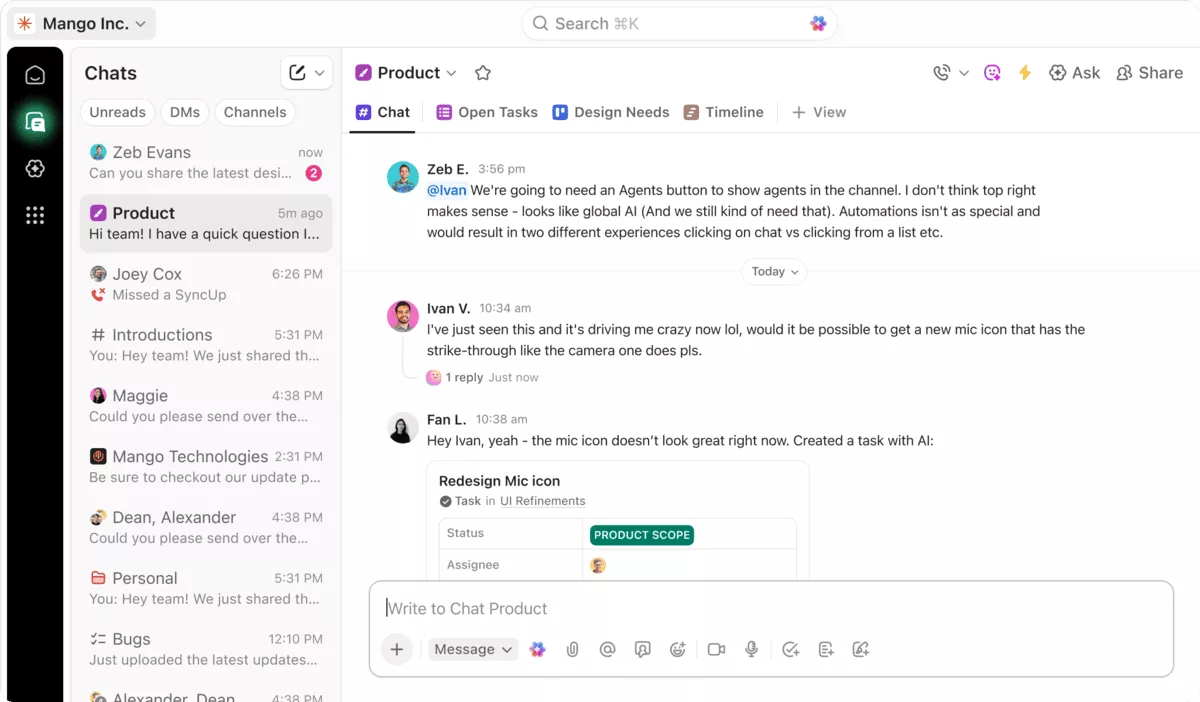
That matters when PMs need a quick read before a status meeting. They can check the work itself instead of waiting for someone to rebuild a report from scattered inputs. Productive’s project management workspace shows how delivery work, tasks, and updates stay connected instead of sitting in separate tools.
Catch Budget Pressure Before It Turns Into a Margin Problem
For service teams, a project can look fine on tasks while the budget is already under pressure. Productive connects tracked time, budgets, expenses, and profitability, so budget burn is not treated as a finance clean-up exercise after delivery happens.
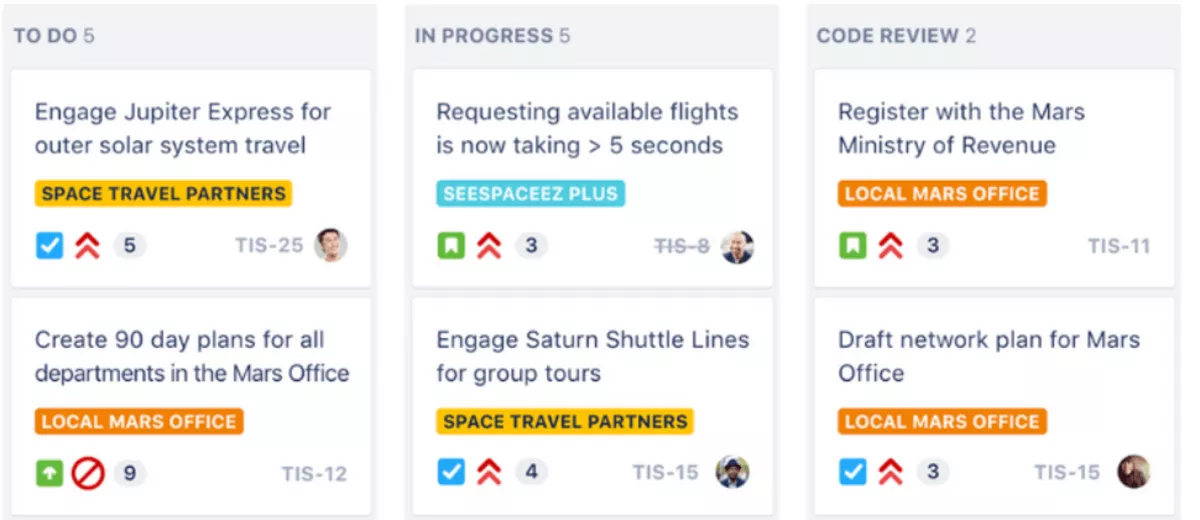
Budget owners can set automated time warnings when billable time reaches a chosen percentage of estimated hours.
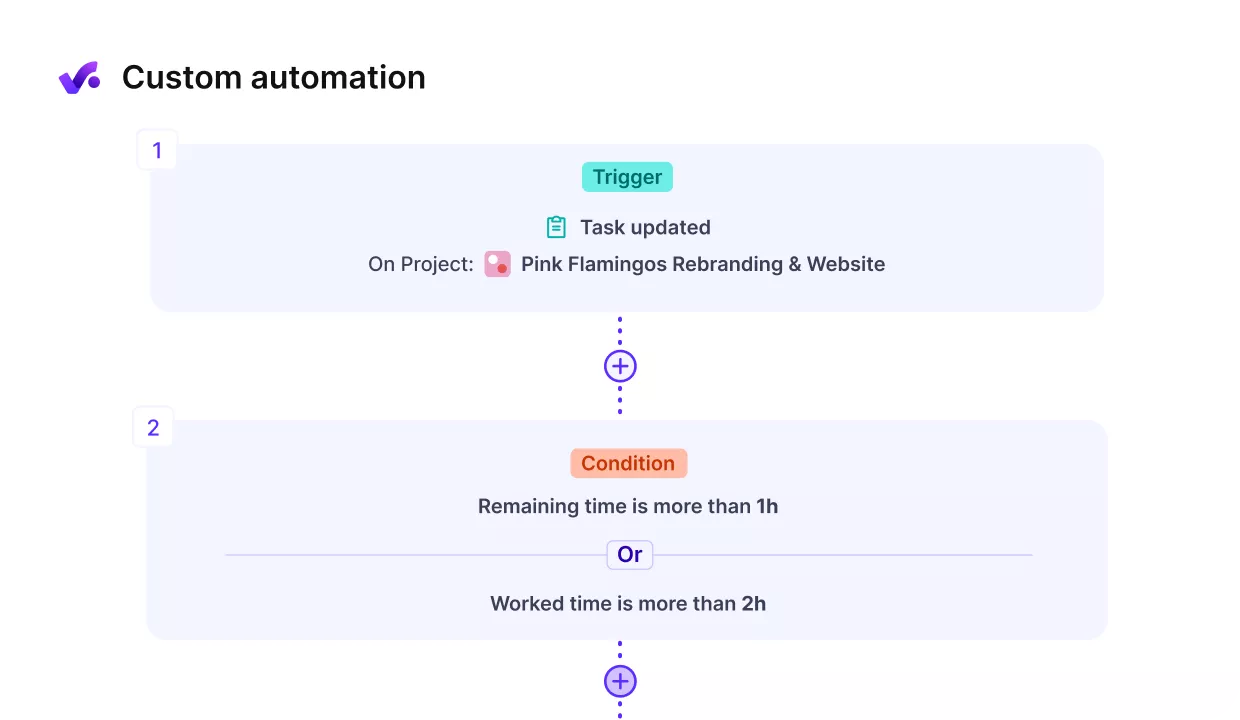
Automate routine tasks and set up automated warnigns.
Teams can also use automations to set multiple budget usage thresholds, and budget overrun limitations can block additional time entries or restrict approvals once a service reaches its cap.
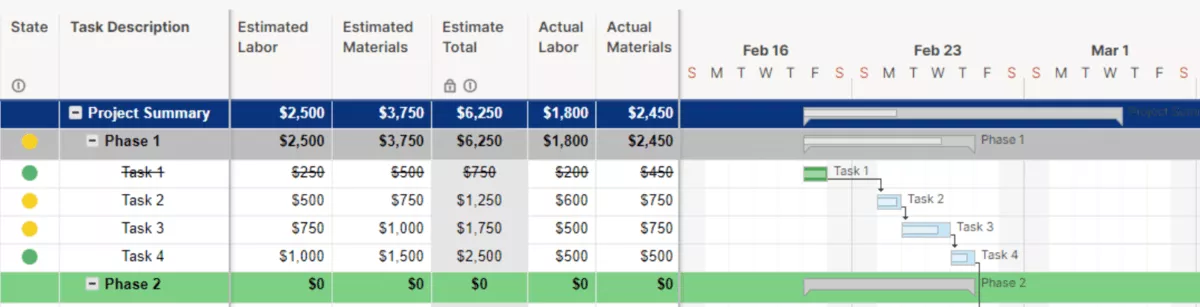
Productive’s budgeting tools are built around this kind of budget control, so managers get a clearer signal before over-servicing becomes harder to correct.
Get early warnings of budget overruns.
Give Managers, Leaders, and Clients the Right View
Not every view should show the same numbers to everyone. A project manager may need budget burn and delivery risk, leadership may need profitability and utilization, and a client may only need progress, selected tasks, or approved budget visibility.
Productive supports multiple dashboards, dashboard sharing, permission-based data access, and client permissions. This helps teams create views for different meetings or audiences without exposing sensitive financial data by default.
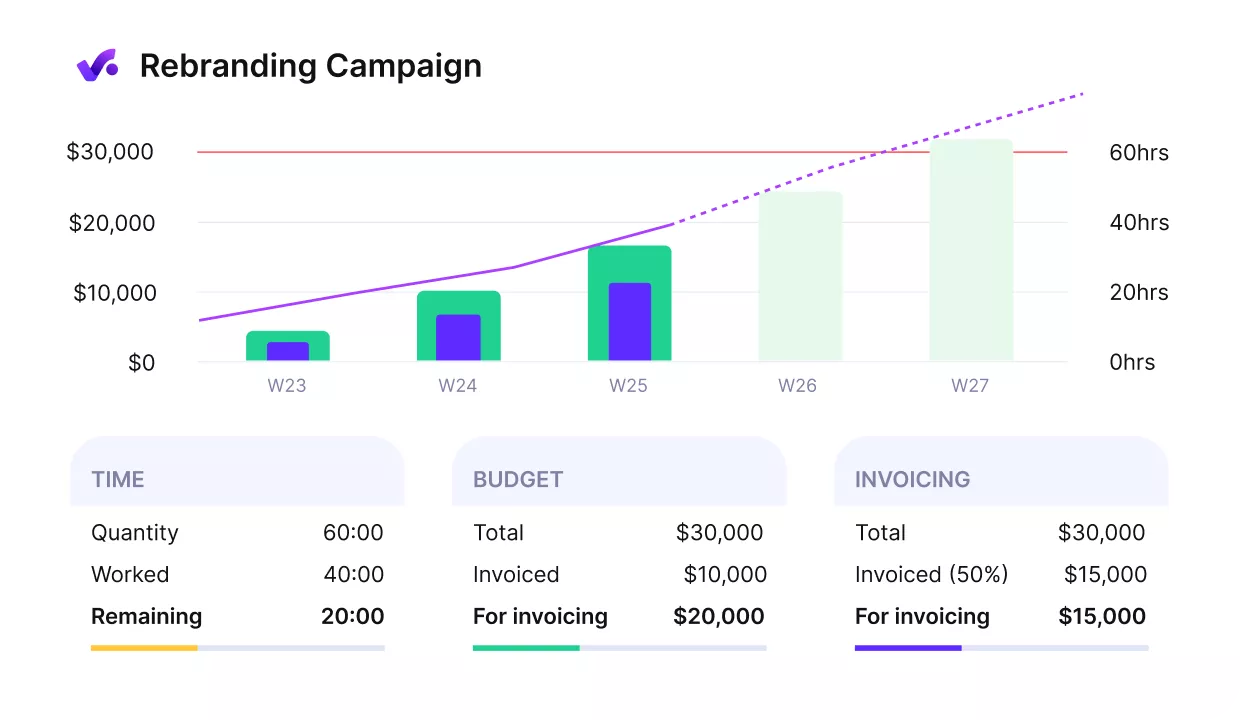
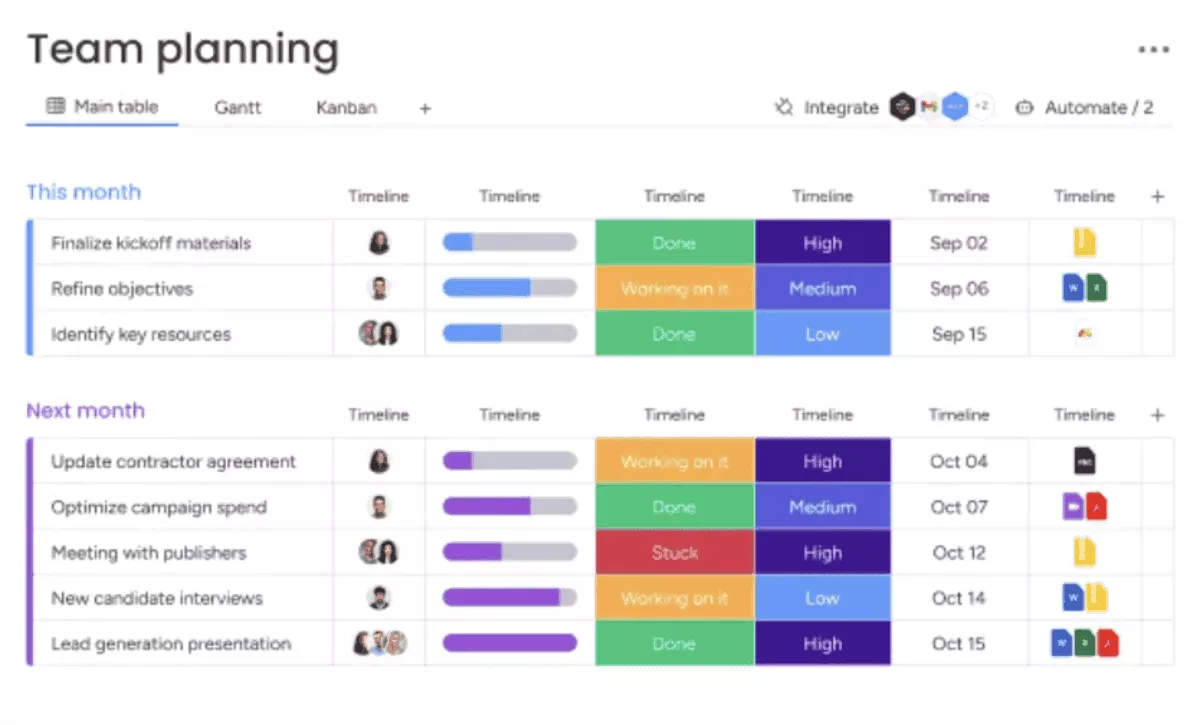
Compare project progress agains key performance metrics.
Use AI to Build Reports Around the Question You Need Answered
Reporting needs change during delivery. One meeting may need profitability by client. Another may need budget burn by service line, workload by team, or projects with the highest delivery risk.
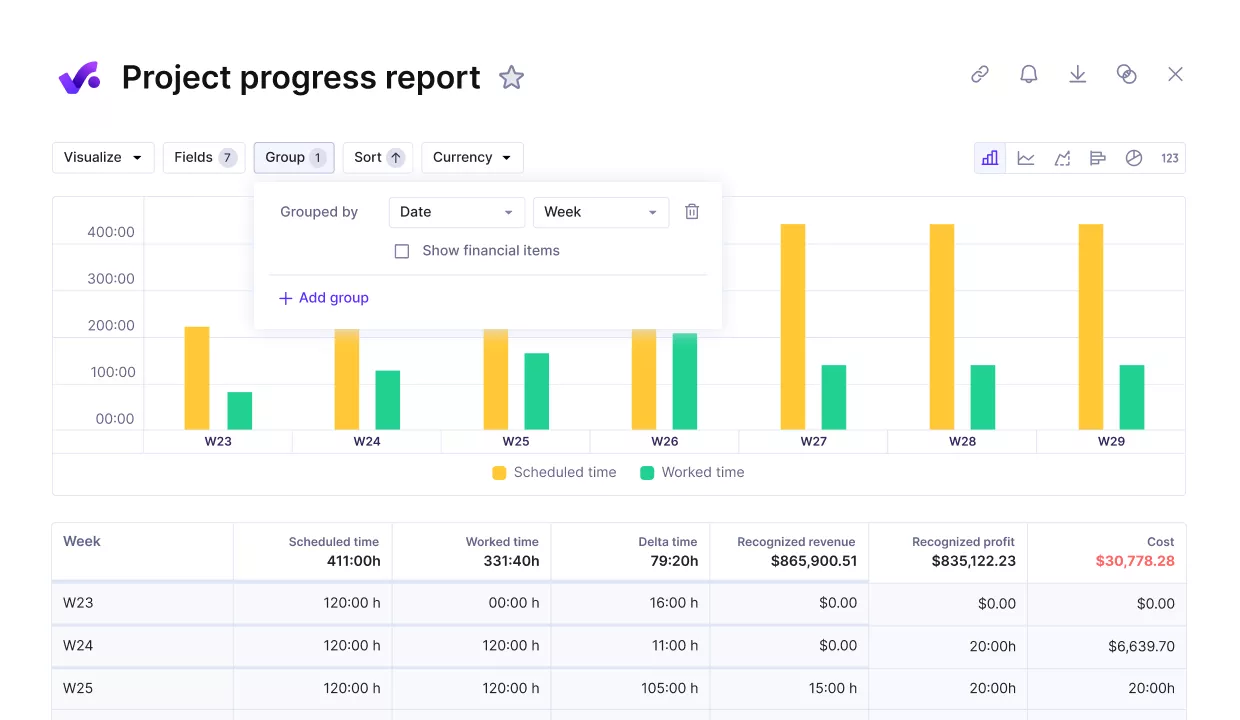
Productive AI Reports let teams describe the report they need in plain language, then adjust fields, filters, grouping, sorting, and visualization after the report is generated.
Productive’s reporting tools give teams the underlying views they can refine, reuse, and review.
The AI output still needs review, but it can reduce the setup work when a team needs a sharper view quickly and does not want to build every report from scratch.
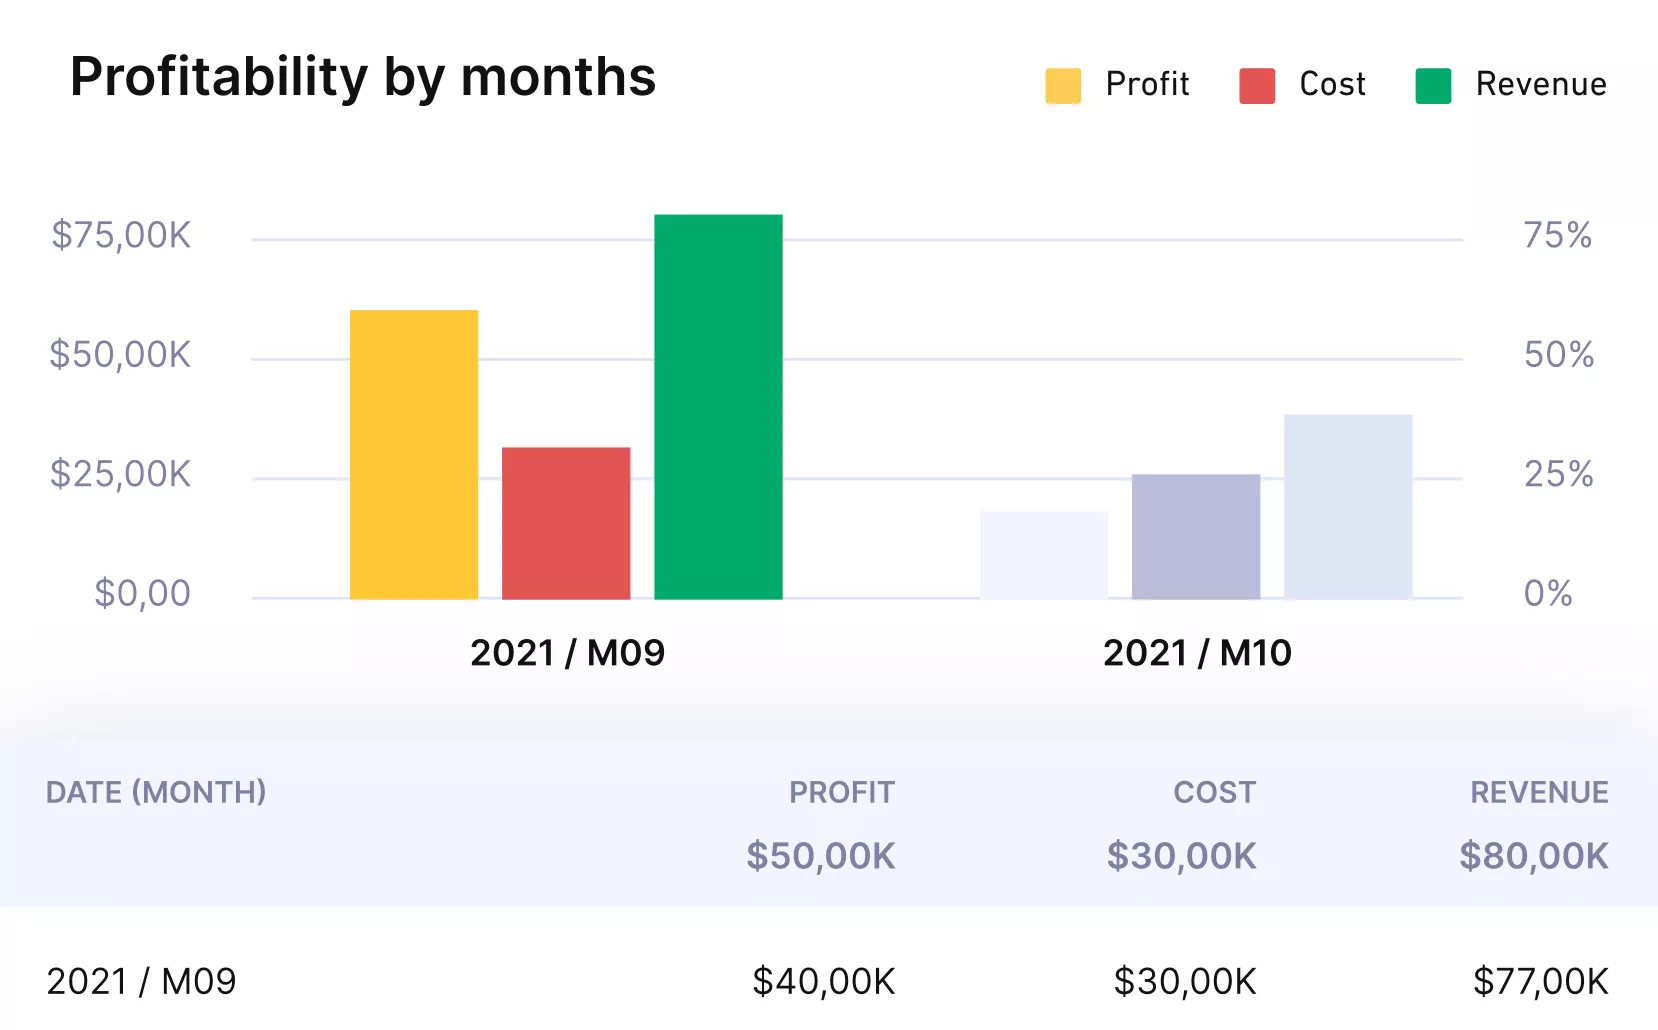
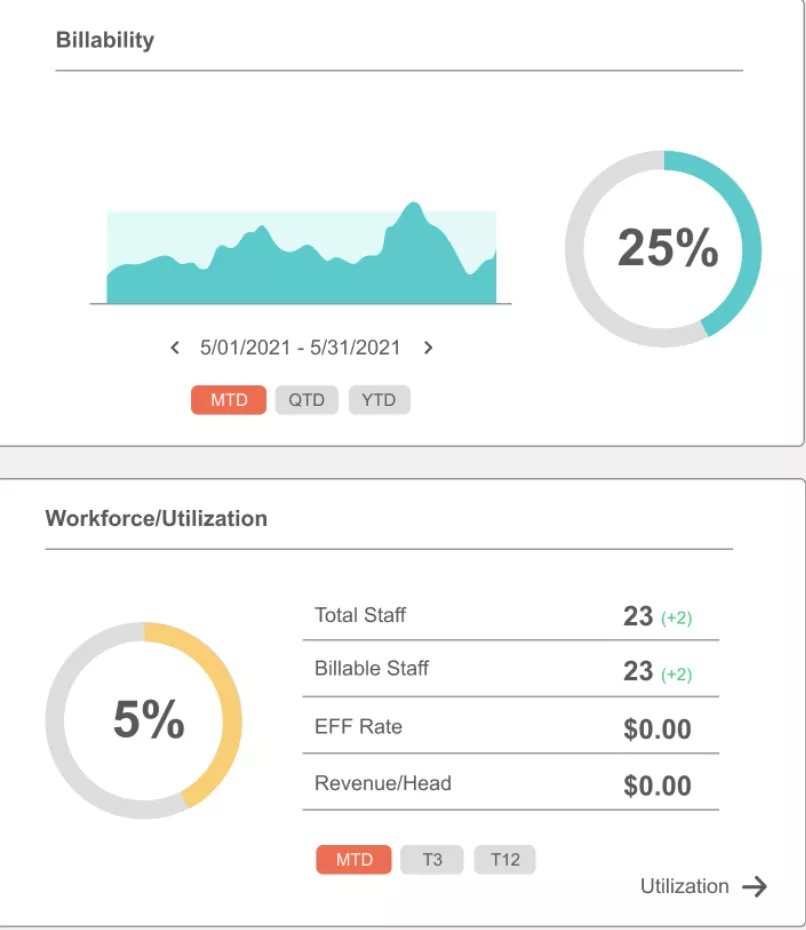
See profitability and margin metrics in real-time.
Pricing
- Plans start with the Essential plan at $10 per user per month, which includes essential features such as budgeting, project & task management, docs, time tracking, expense management, reporting, and time off management.
- The Professional plan includes custom fields, recurring budgets, advanced reports, billable time approvals, and much more for $25 per user per month.
- The Ultimate plan has everything that the Essential plan and Professional plan offer, along with the HubSpot integration, advanced forecasting, advanced custom fields, overhead calculations, and more. Book a demo or reach out to our team for the monthly price per user.
Productive has a free 14-day free trial, so you can try out what the tool can offer to your professional services firm.
Turn Scattered Reporting Into One Clear Dashboard
Productive helps you replace disconnected spreadsheets and status updates with live dashboards built from your project, budget, and resource data.

2. Smartsheet – Best for Spreadsheet-Based Reporting
Smartsheet turns spreadsheet-style work data into dashboards, reports, timelines, and approval workflows. It keeps the grid-based control many teams already know, but adds more structure for tracking work and sharing stakeholder updates.
Key Features
- Custom dashboards and reports for progress, risks, and portfolio updates.
- Grid, timeline, card, and Gantt charts for spreadsheet-style planning.
- Automations for approvals, reminders, status updates, and follow-ups.
- Forms, permissions, and connected reports for dashboard-ready data views.
SOurce: smartsheet
Pros
- Smartsheet is easier to adopt for teams that already think in spreadsheets, because the grid-based structure feels familiar while adding project workflows on top.
- Dashboards, reporting, and visual work views make it useful for turning work information into stakeholder-ready updates.
- Forms, automations, reminders, and update requests can reduce the manual chasing that often comes with spreadsheet-based tracking.
- Sharing controls, permissions, and reporting rollups makes Smartsheet practical for cross-team visibility across multiple workspaces.
Cons
- Advanced workflows can require more learning once teams move into formulas, administrative settings, and connected sheets.
- Large or complex sheets can slow down, especially when there are linked sheets, large datasets, or several automated processes.
- Smartsheet may not go deep enough for teams that need complex planning, advanced dependencies, resource planning, or deep dashboard analytics.
- Costs and premium add-ons can become a concern as more users, features, integrations, or enterprise capabilities are added.
Final Verdict
Smartsheet can turn structured sheets into useful dashboards, but it does not replace a PSA-style system for project profitability, billing, and resource planning. Teams that need those signals close to delivery work should compare them with more service-focused platforms.
3. monday Work Management – Best for Visual Project Reporting Workflows
monday Work Management organizes work tracking around boards, views, widgets, and automations. Its strength is visual coordination: showing ownership, priorities, task progress, and bottlenecks in a format stakeholders can scan quickly.
Key Features
- Dashboards with widgets for progress, budget, workload, and status.
- Board views such as Kanban boards, timelines, Gantt charts, and workloads.
- Automations and integrations for reminders, handoffs, and status updates.
- Shareable workspaces, boards, and dashboards with permission controls.
monday Work Management
Pros
- monday Work Management makes work updates easy to scan because visual dashboards can show tasks, deadlines, progress, and status without waiting for a separate manager update.
- Teams can create different dashboard views for different stakeholders, which is useful when leadership needs KPIs and delivery teams need task details.
- The platform is flexible enough for teams to customize boards, filters, views, and workflows around the way they already manage work, which is useful when the same data needs different slices for different audiences.
- Users value monday as a central place for coordination when projects involve multiple teams, workstreams, or handoffs.
Cons
- Setup can require more learning once teams move past basic boards and start building workflows, automations, and stakeholder views.
- monday can become harder to manage as the number of boards, automations, integrations, and workspaces grows.
- Cross-board navigation and dependencies can feel cluttered when a team manages many active boards simultaneously.
- Some users report friction around integrations, AI assistance, performance, or feature access, so teams should test their exact workflow before relying on monday as a reporting layer.
Final Verdict
Look elsewhere if the dashboard needs to explain margin, budget burn, utilization, billing, or service-business profitability without heavy configuration. monday is better for visual coordination than finance-led project control. Its clearest value is showing who owns what and where work is stuck.
If monday is already on your shortlist, Productive’s guide to monday.com alternatives gives you more options to compare before you commit.
4. ClickUp – Best for Customizable Reporting Views
ClickUp gives teams a highly configurable workspace for turning tasks, custom fields, views, docs, time, and dashboard cards into one tracking setup. The appeal is customization: teams can shape project management dashboards to their workflow rather than using a fixed reporting structure.
Key Features
- Dashboards with cards, custom filters, drill-downs, sharing, and scheduled reports.
- Custom fields for adding structured project data to tasks and reports.
- Views for lists, boards, calendars, Gantt, workload, tables, forms, and dashboards.
- Automations for task-related actions such as assignments, comments, emails, and status changes.
SOurce: clickup
Pros
- ClickUp gives teams a lot of control over how they structure work data, especially when custom fields and dashboards are part of the workflow.
- The platform can centralize work management, time data, documents, chat, collaboration, and files in one workspace.
- Teams that previously worked across several tools can use ClickUp to keep task communication, deadlines, files, and tracking closer together.
- Different task views and flexible setup options help teams track responsibilities, progress, and priorities in a way that matches their workflow.
Cons
- The same flexibility can make ClickUp feel heavy at the start, especially for new users who need to learn many features and settings.
- Without a consistent setup, workspaces can become chaotic because teams have many ways to organize the same information.
- Performance can be an issue for some users, especially when loading lists, search, or larger workspaces.
- Dashboard layout and mobile dashboard usability may frustrate teams that need clean reporting on the go.
Final Verdict
ClickUp becomes harder to justify when the dashboard has to produce clean financial signals with minimal setup. It can be shaped into many reporting workflows, but that flexibility comes with admin decisions around fields, views, hierarchy, and permissions.
Service businesses that need budget burn, profitability, billing, and resource planning to work out of the box should compare it with platforms built closer to financial delivery.
5. Wrike – Best for Enterprise Portfolio Reporting
Wrike brings work intake, execution, dashboards, approvals, and resource management into an enterprise project management workspace.
It suits portfolio teams that need structured workflows, cross-department reporting, Gantt charts, workload views, and controlled visibility across many active initiatives, especially when project managers need consistent reporting across departments.
Key Features
- Custom dashboards, reports, and analytics for portfolio visibility.
- Gantt charts, tables, boards, calendars, and workload views for planning work.
- Request forms, approvals, proofing, and automations for structured work intake.
- Resource planning, time data, budgeting, and integrations for enterprise reporting.
SOurce: wrike
Pros
- Wrike gives managers a strong overview of work, tasks, and workload in one place.
- Dashboards and reports help teams track progress, KPIs, and delivery health without exporting data elsewhere.
- Custom workflows, task comments, file versioning, and approvals can keep feedback tied to the work.
- Wrike can reduce status chasing when owners, deadlines, updates, and follow-ups are centralized.
Cons
- Setup and administration can take time, especially across multiple spaces, workflows, and automations.
- New users may face a learning curve when moving into custom fields, complex automations, and advanced workflows.
- Search, cross-space reporting, and navigation can frustrate users working across larger work structures.
- Wrike may feel heavier than needed for teams that only want a simple project dashboard or lightweight budget tracking.
Final Verdict
The threshold for Wrike is operational complexity. It makes sense when reporting sits inside a wider enterprise work management system with approvals, workload visibility, and portfolio control. Smaller service teams that mainly need budget burn, capacity, profitability, and client reporting may find the setup heavier than the dashboard problem they are trying to solve.
For a closer service-business comparison, see Productive’s Wrike, Teamwork, and Productive breakdown.
6. Teamwork.com – Best for Client-Facing Reporting
Teamwork.com brings client work, task ownership, time tracking, budgets, resource planning, and reports into one platform. It is built for client-facing delivery teams that need to show project progress, coordinate approvals, and keep billable work close to the project plan.
Key Features
- Dashboards and reports for project health, budget usage, workload, and utilization.
- Timesheets, budgets, billable rates, and financial reporting for client work.
- Resource and workload planning for capacity, availability, and assignments.
- Client communication, approvals, project status, and stakeholder updates in one workspace.
SOurce: teamwork.com
Pros
- Teamwork.com gives PMs a clearer way to centralize tasks, owners, deadlines, files, and updates.
- Timesheets and billing sit close to delivery, which helps service teams connect work with business outcomes.
- Agencies can use it to manage approvals, deadlines, recurring templates, priorities, and weekly progress.
- Capacity, workload, project health, and budget visibility make it useful for teams that need more than task tracking.
Cons
- New users may need time to learn the platform because there are many features, settings, and workflows.
- Large projects can become harder to navigate when there are many task lists, reminders, and project details.
- Some reporting and dashboard views may not be flexible enough for executive-level visibility across a wider portfolio.
- Teams can end up using the platform inconsistently if they do not standardize how projects, tasks, and communication should be managed.
Final Verdict
The tradeoff shows up when client delivery turns into deeper financial control. Teamwork.com handles client visibility, timesheets, approvals, and day-to-day coordination well.
Buyers who need stronger profitability analysis, budget burn forecasting, utilization targets, and resource-capacity signals should compare it with PSA-style platforms before committing.
7. Kantata – Best for Professional Services Dashboards
Kantata connects staffing, delivery, forecasting, and financial performance inside a PSA platform for larger professional services organizations.
Its dashboards are closer to an operating system for services work than a simple status view, especially when leaders need to connect utilization, revenue, margins, and profitability.
Key Features
- Staffing and forecasting for availability, demand, and resourcing plans.
- Financial workflows for project accounting, invoicing, revenue forecasting, and margins.
- Reporting and analytics for delivery, health, utilization, and financial performance.
- Integrations and workflows for connecting PSA data with existing business systems.
SOurce: kantata
Pros
- Kantata can improve forecasting when resource scheduling and delivery planning are integrated into a single workflow.
- Project and delivery leaders can connect resource allocation, revenue forecasting, milestones, and financial components in one system.
- Reviewers value the way Kantata consolidates delivery information and project data that would otherwise sit in spreadsheets or separate tools.
- Its reporting and analytics can help professional services teams understand delivery health, utilization, margins, and financial performance.
Cons
- Some teams still need to invest time in dashboards, reporting, and insight setup before leaders get the right information quickly.
- Templates and Gantt workflows may frustrate teams that expect smoother project setup or Microsoft Project-style planning.
- Data entry can feel click-heavy when managers need to update information across multiple areas.
- Kantata may feel complex for new or occasional users, especially when advanced configuration, reporting, or integrations are involved.
Final Verdict
Kantata is not the light option on this list. Smaller agencies that only need reporting for status, client updates, or simple budget visibility may find the setup heavier than the problem they are trying to solve.
If Kantata feels too heavy for your workflow, Productive’s Kantata alternatives guide compares other options for professional services teams.
8. BigTime – Best for Project Financial Reporting
BigTime keeps financial reporting close to the work that creates the numbers: time, expenses, budgets, invoices, resource plans, and accounting software integrations.
Its strongest dashboard use case is cost tracking for professional services teams that need to understand billable work, margins, and budgets without rebuilding finance reports from scratch.
Key Features
- Dashboard with task status, budget status, billing realization, and logged hours.
- Project finance reports for planned vs actual revenue, costs, profitability, and margins.
- Time, expense, billing, invoicing, and payment workflows for service work.
- Staffing reports for utilization, workload, and scheduled vs actual data.
SOurce: bigtime
Pros
- BigTime connects invoicing, logged hours, work management, and analytics in a way that supports finance-led visibility.
- Structured timesheets help teams see where hours are allocated and review time or expense data more easily.
- Detailed timesheets can support invoicing, especially for consultants who need backup by deliverable or engagement.
- Centralized work and financial data help teams monitor delivery, performance, and financial records in a single platform.
Cons
- Rollout and setup can feel rough if teams need smoother onboarding, clearer guidance, or faster timesheet adoption.
- Some daily workflows can require extra clicking, especially when the interface does not make the next action obvious.
- Reporting access can feel limited for users who need more permission-based views of SOWs, tasks, or time data.
- Navigation and reporting flexibility may frustrate teams that need clearer filters, more intuitive project lists, or stronger custom reporting paths.
Final Verdict
BigTime is less convincing for teams that mainly want visual project coordination, creative planning, or lightweight stakeholder updates. Its strongest case is financial: time, billing, cost tracking, invoicing, project budgets, and profitability visibility.
9. Accelo – Best for Quote-to-Cash Reporting
Accelo connects client work from sales and quoting through delivery, retainers, logged time, billing, and reporting. For dashboard buyers, the main value is data aggregation across the quote-to-cash workflow: budgets, tasks, client history, time, and invoices can sit closer together than they would in a stack of separate tools.
Key Features
- Client, work, resource, financial, and business intelligence capabilities in one PSA platform.
- Work tracking tied to timelines, capacity, budget targets, client communication, and delivery risk.
- Staffing and workload views for skills, availability, demand, utilization, and capacity gaps.
- Financial and business intelligence views for revenue, cash flow, margin, delivery risk, and project profitability changes.
SOurce: accelo
Pros
- Accelo can centralize client information, work history, task communication, reporting, and logged time in one system.
- It is useful for service businesses that want CRM, work management, sales, help desk, billing, and timesheets closer together.
- Customization, shared lists, and email visibility help teams connect client communication with delivery work.
- Agencies can use Accelo to manage clients, work, invoicing, reports, and day-to-day accountability from one portal.
Cons
- Setup can take time because Accelo needs to be configured around the company’s actual workflows.
- Reporting can become noisy when users need a simpler view of specific hours, budgets, or task data.
- Triggers and automation testing may create risk if teams do not understand how changes affect live workflows.
- The platform can feel expensive, complex, or overwhelming for small teams that do not need a full quote-to-cash system.
Final Verdict
Accelo is too much if the buyer only wants a clean project dashboard for status updates and task progress. Its value comes from connecting the wider client-work chain: CRM, project delivery, retainers, time, billing, reporting, and operations.
Teams that do not need that full workflow behind the dashboard may find a narrower project reporting tool easier to manage.
10. Adobe Workfront – Best for Enterprise Work Management Reporting
Adobe Workfront supports enterprise work management for teams that need intake, approvals, resource management, portfolio reporting, and controlled workflows at scale. It is strongest when dashboards sit inside a larger operating system for marketing, creative, operations, and cross-functional enterprise work.
Key Features
- Dashboards, report widgets, and visual tools for visibility into work progress and risk.
- Portfolio control for prioritizing work, reviewing resources, and tracking phases.
- Request intake, approvals, proofing, automations, and workflow controls for enterprise work.
- Staffing, capacity planning, scheduling, and Adobe ecosystem integrations.
SOurce: adobe workfront
Pros
- Adobe Workfront gives enterprise teams visibility across workstreams, approvals, proofing, and resource bandwidth.
- Custom dashboards, reports, and work views help teams track status without chasing updates across email or chat.
- Workfront can centralize intake, tasks, compliance work, status, and process management across many teams.
- Its proofing, approvals, request queues, and Adobe integrations are useful for marketing and creative operations.
Cons
- The interface can feel heavy, and the learning curve may be steep for users who are not PMs.
- Setup, governance, training, and administration can require serious effort before the system works cleanly.
- Search, filtering, navigation, and reporting can frustrate teams working across complex project structures.
- Workfront can be too much for smaller teams that do not need enterprise governance, Adobe workflows, or formal portfolio control.
Final Verdict
Adobe Workfront belongs in an enterprise shortlist, not a lightweight agency dashboard search. It is useful when project dashboards need to sit inside a governed work management system with approvals, proofing, resource planning, and portfolio control.
Lighter service businesses should not start here unless they already need that enterprise operating layer.
What Features Should Project Reporting Tools Have?
The key features to look for are live delivery status, budget tracking, resource visibility, configurable reporting, stakeholder sharing, and alerts that help teams act before work goes off track.
A useful dashboard does not need every possible widget. It needs to show the signals that change weekly decisions, then make those signals easy for project managers and leadership to review with the right people.
For a deeper breakdown of what these views can include, read Productive’s guide to building a project dashboard.
| Feature | Why It Matters | Who Needs It Most | Tools From This List That Support It | What to Check Before Buying |
|---|---|---|---|---|
| Live delivery status | Shows whether work is moving, blocked, late, or waiting on approval. | PMs and delivery leads | Productive, Smartsheet, monday Work Management, ClickUp, Wrike, Teamwork.com, Kantata, BigTime, Accelo, Adobe Workfront | Check whether real-time dashboards pull updates from tasks, time, budgets, and approvals. |
| Budget tracking | Shows whether work is using the budget faster than planned. | Agencies, consultancies, and finance leads | Strongest: Productive, Teamwork.com, Kantata, BigTime, Accelo. Configurable: Smartsheet, monday Work Management, ClickUp, Wrike, Adobe Workfront | Check whether the tool compares the budget plan with actual work, not just manual budget fields. |
| Resource visibility | Shows who is booked, overloaded, available, or missing from the plan. | Operations leads and resource managers | Productive, Wrike, Teamwork.com, Kantata, BigTime, Accelo, Adobe Workfront. Lighter or configurable: monday Work Management, Smartsheet, ClickUp | Check whether workload, time off, availability, and utilization live close to the work plan. |
| Financial visibility | Connects progress with cost, revenue, margin, billing, or profitability. | Service businesses and leadership teams | Strongest: Productive, Kantata, BigTime, Accelo. Also relevant: Teamwork.com, Wrike, Adobe Workfront. More configurable: Smartsheet, monday Work Management, ClickUp | Check whether financial data is native or rebuilt from exports. |
| Custom widgets and filters | Lets each team review the data they actually need. | Teams with multiple work types or stakeholder groups | Productive, Smartsheet, monday Work Management, ClickUp, Wrike, Teamwork.com, Kantata, BigTime, Accelo, Adobe Workfront | Check whether custom filters, dashboard layout options, and permissions are easy to manage. |
| Stakeholder sharing | Creates different views for internal teams, leadership, clients, or external partners. | Client-facing teams and enterprise teams | Productive, Smartsheet, monday Work Management, ClickUp, Wrike, Teamwork.com, Accelo, Adobe Workfront. More internal-focused: Kantata, BigTime | Check whether sharing controls protect sensitive budget, margin, or utilization data. |
| Alerts and thresholds | Flags budget, workload, or deadline pressure before the next reporting meeting. | Delivery and finance teams | Strongest: Productive, Smartsheet, monday Work Management, ClickUp, Wrike, Teamwork.com. More workflow-dependent: Kantata, BigTime, Accelo, Adobe Workfront | Check whether alerts can be tied to live work data, not only task dates. |
| Reporting outputs | Turns dashboard data into repeatable updates for meetings and leadership reviews. | PMOs, operations teams, and managers | Productive, Smartsheet, monday Work Management, ClickUp, Wrike, Teamwork.com, Kantata, BigTime, Accelo, Adobe Workfront | Check whether report templates, exports, recurring reports, and graphs and charts are flexible enough. |
| Integrations | Pulls work, time, CRM, accounting, or communication data into one reporting workflow. | Teams using several systems | Productive, Smartsheet, monday Work Management, ClickUp, Wrike, Teamwork.com, Kantata, BigTime, Accelo, Adobe Workfront | Check whether integrations sync enough data for reliable data visualization, not just surface-level activity. |
| AI-assisted reporting | Helps users build or adjust reports faster when the question changes. | Teams that need fast reporting without heavy setup | Productive, monday Work Management, ClickUp, Wrike, Adobe Workfront. Check current availability for each tool before relying on it | Check availability, limits, admin settings, and review requirements before relying on AI outputs. |
How to Choose Your Project Reporting Platform? (Step-by-Step Process)
You should choose your project reporting platform by testing whether it can support the decisions your team makes every week, using real work data rather than sample dashboards.
Before you compare tools, pick one active engagement and one completed engagement. Use them as test cases. The active one shows whether the dashboard can help you react while work is still moving. The completed one shows whether the tool can explain what actually happened after delivery.
Step 1: List the Decisions the Dashboard Must Support
Write down the five decisions your team needs the dashboard to improve. Keep them specific enough that you can test them in a demo.
For example:
- Which client engagements need attention before the next meeting?
- Which budgets are over plan, and by how much?
- Which team members are overbooked next week?
- Which client engagements have unapproved time, missing updates, or late milestones?
- Which workstreams look healthy on task progress but weak on margin?
This stops the buying process from turning into a widget comparison. If the platform cannot answer your five questions with real work data, it is not the right reporting layer.
For service businesses, Productive’s professional services KPI guide can help you decide which financial, delivery, and utilization metrics deserve space in the dashboard.
Step 2: Match the Dashboard Type to the Decision
Do not ask one dashboard to serve every audience. Match each decision to the dashboard type that should answer it.
A status dashboard should show blocked work, overdue tasks, owners, milestones, and next steps. A financial dashboard should show budget plan against actual work, costs, revenue, billing risk, and margin.
A resource dashboard should show resource capacity, availability, time off, scheduled work, and workload management. A stakeholder dashboard should show progress, approvals, open risks, and next actions without exposing internal financial signals.
This is also where you should separate project management dashboards from BI tools. A Power BI-style setup can be useful for executive reporting, but it still needs clean data from the systems where tasks, time, budgets, and resources are updated.
Step 3: Trace the Source Data for Each Metric
For every metric you want on the dashboard, write down the source system. Do not skip this step.
Use a simple map:
| Dashboard Signal | Source Data to Check |
|---|---|
| Delivery status | Tasks, milestones, owners, approvals, status updates |
| Budget burn | Estimates, logged time, expenses, rates, budget totals |
| Resource pressure | Bookings, availability, time off, utilization, workload |
| Client reporting | Milestones, approvals, deliverables, open risks |
| Performance | Budget usage, margin, revenue, delivery progress, forecast |
If the source data lives in three or four different tools, ask how the dashboard updates. If the answer is exports, imports, or manual spreadsheet cleanup, the reporting process will probably stay fragile.
Step 4: Run a Budget Plan Against Actuals Test
Use one real engagement and ask the vendor to compare the budget plan against actual work. Do not accept a static budget field as proof.
The dashboard should show the original budget, planned work, actual hours or costs, remaining budget, and whether the engagement is trending toward over-servicing.
For service businesses, this is the test that separates a useful dashboard from a status page. Client work can be green on tasks and still be weak commercially.
Step 5: Test Capacity With Next Week’s Schedule
Take next week’s real delivery plan and ask the tool to show who is available, who is overbooked, and which client work is competing for the same people.
Then check whether the view includes time off, tentative work, role demand, utilization, team capacity, and scheduled work. If PMs have to rebuild capacity in a spreadsheet after checking the dashboard, the tool is not solving the workload problem.
Step 6: Build One Internal View and One Stakeholder View
Ask for two dashboard examples from the same engagement. One should be internal. One should be stakeholder-facing.
The internal view can include margin, utilization, delivery risk, budget pressure, and staffing gaps. The stakeholder view should show milestones, progress, approvals, blockers, and next steps. During the demo, check whether permissions can hide sensitive data without forcing the team to duplicate the whole dashboard.
Step 7: Test the Weekly Review Workflow
Run the dashboard through a real weekly review. Pick one PM, one finance or operations stakeholder, and one delivery lead.
Ask them to use the dashboard to answer three questions:
- What changed since last week?
- What needs action before the next meeting?
- Who owns the next step?
If the dashboard only describes what happened but does not change the conversation, it is probably another report. The better choice is the platform that helps the team make the next decision with fewer side spreadsheets, status checks, and follow-up messages.
How to Implement a Project Reporting Platform?
You should implement a project reporting platform by choosing the decisions it needs to support, cleaning the source data, building one pilot view, and expanding only after the team trusts the numbers.
The goal is not to recreate every old report in a new tool. Start with the few signals that change action, then build reporting views around those workflows.
Start With the Reports People Already Use
Collect the reports, spreadsheets, status decks, and dashboard screenshots your team already relies on. Ask PMs, finance, operations, and leadership which ones they actually use in meetings.
Then split them into three groups:
- Keep: reports that still drive decisions.
- Rebuild: reports that matter, but need fresher data updates.
- Retire: reports nobody uses or trusts.
This prevents the new dashboard from becoming a prettier version of old reporting clutter.
If you need examples of recurring reports to keep or rebuild, Productive’s guide to project management reports covers the reporting formats teams usually use to track progress, budgets, risks, and delivery.
Pick the First Dashboard Use Case
Choose one dashboard to launch first. Good starting points are an active client engagement, a portfolio view for leadership, or a resourcing dashboard for next month’s work.
The first use case should have a clear owner and a clear meeting attached to it. For example, a delivery lead might own a weekly health view, while finance owns a budget burn view.
Clean the Fields Before You Build Dashboards
Bad source data creates bad dashboard decisions. Before setup, standardize project names, client names, owners, statuses, services, budget fields, milestones, and billing categories.
Also, check settings across active work. If one team tracks phases, another tracks task lists, and another tracks only deadlines, the dashboard will not compare work cleanly.
Map Each Dashboard Signal to a Source
For every signal on the dashboard, define where the data comes from and who keeps it updated.
Use a simple setup map:
| Dashboard Signal | Source to Map | Owner |
|---|---|---|
| Delivery health | Status, blockers, deadlines, approvals | PM |
| Budget burn | Budget, logged time, expenses, rates | Finance or delivery lead |
| Resource pressure | Bookings, workload, time off, utilization | Operations or resource manager |
| Client status | Milestones, approvals, deliverables, risks | PM |
| Leadership reporting | Performance, margin, revenue, forecast | Operations or finance |
This is where data aggregation matters. If one signal depends on five disconnected exports, the dashboard will need more maintenance than the team expects.
Build One Internal View and One Shared View
Create two versions of the pilot view. The internal version can include margin, utilization, budget risk, overdue work, and capacity pressure. The shared version should show delivery status, next steps, approvals, open risks, and client-safe progress updates.
Use permissions and filter options to separate sensitive internal data from stakeholder reporting. Do not duplicate dashboards if role-based access can solve the same problem more cleanly.
Test It in a Real Review Meeting
Use the pilot view in a real weekly review, not just a setup call. Ask the team to answer:
- What changed since last week?
- What is now at risk?
- What needs action before the next meeting?
- Who owns the next step?
If the dashboard cannot answer these questions, adjust the fields, filters, or source data before adding more reports.
Roll Out Only After the Pilot Works
Once the pilot is trusted, document the reporting rules before expanding. Define who owns updates, which fields are required, how often data is reviewed, and which reports should replace older spreadsheets.
Then roll out by workflow, not by department. For example, add reporting views for budget burn, then resourcing, then client reporting. This keeps implementation controlled and prevents every team from creating its own reporting logic.
Implementation Checklist
Use this checklist before rolling out dashboard reporting across more client work:
- Collect the reports, spreadsheets, and dashboards the team uses today
- Decide which reports to keep, rebuild, or retire
- Choose one dashboard use case for the pilot
- Assign a dashboard owner
- Define the decisions the dashboard must support
- Standardize project names, client names, owners, statuses, and budget fields
- Review settings across active work
- Map every dashboard signal to a source system and owner
- Decide which dashboards are internal and which are stakeholder-facing
- Set permissions before sharing any dashboard
- Build the pilot view on one active project or portfolio
- Test data updates, filters, and stakeholder views in a real meeting
- Confirm that PMs and finance trust the numbers
- Document the review cadence and dashboard rules
- Expand only after the pilot replaces an old report or improves a real decision
Final Thoughts: Which Tool Should You Choose?
The right tool depends on what you need to understand first: task progress, portfolio health, budget burn, capacity pressure, stakeholder status, or performance.
If you run an agency or service business, disconnected reporting becomes harder to trust as soon as time, budgets, resources, and client work are spread across different systems. That is where all-in-one platforms like Productive are worth a closer look, because their dashboards are tied to the same work, budget, and resourcing data your team already uses.
To see how connected reporting works in practice, book a demo with Productive and compare it against your current workflow.
Connect With Agency Peers
Access agency-related Slack channels, exchange business insights, and join in on members-only live sessions.
