Operational Metrics: 16 Examples With Formulas

You can track every number in the business and still not know whether next month will be profitable. Operational metrics measure time, budgets, capacity, and billing while the work is still in progress.
Below are the 16 metrics professional services firms track, each with its formula. Then how they differ from KPIs, how to choose and review them, and where measurement breaks down.
Key Takeaways
- A KPI is a metric with a target and an owner attached. Billable utilization is a metric. Holding it above 75% this quarter makes it a KPI.
- Which metrics matter depends on how a business makes money. Manufacturers watch cost per unit. Services firms watch time, budgets, billing, and margin.
- Sixteen metrics can cover professional services, grouped into utilization, pipeline, billing, budget health, and profitability.
- Pick metrics by the decision they inform. Then give each an owner and an action trigger, or the review becomes a status update.
What Are Operational Metrics?
Operational metrics are measurable data points that show how daily business operations are performing. They help you see what is happening inside the business before the final numbers land in a finance report.
A useful metric answers a practical question, such as:
- How much capacity do we have left?
- How much budget has this project used?
- How much completed work still needs to be billed?
These numbers are more useful than broad performance metrics when you need to understand the work behind the result. Revenue tells you what came in. Operational performance helps explain whether the work was planned, delivered, staffed, and billed in a healthy way.
Useful operating metrics do not ask you to collect more numbers. They make the business easier to read while there is still time to act.
These metrics often get mixed up with KPIs, but they are not the same thing. That difference is small on paper and very important in practice.
What Is the Difference Between Operational KPIs and Metrics?
Every KPI is a metric, but only metrics with a target and an owner are KPIs.
That distinction matters because not every useful number deserves KPI status. A key performance indicator is tied to a strategic objective someone is accountable for. A services business can track dozens of metrics, but only a smaller set should guide decisions.
Here is the difference:
How a metric becomes a KPI
| Term | What it means | Example |
|---|---|---|
| Operational metric | A measurement of daily business performance | Billable utilization |
| Operational KPI | A priority operational metric tied to a target | Billable utilization above 75% this quarter |
Billable utilization is an operational metric because it measures how much available time becomes client work. It becomes an operational KPI once leadership sets a target, such as 75% this quarter. The number then guides hiring, resourcing, and sales decisions.
The same logic applies to financial KPIs. A project margin target matters most when leadership reviews pricing, resourcing, or delivery cost against it. Our guide to KPIs for professional services firms covers the seven KPIs services teams usually use.
Once that difference is clear, the next question is why these numbers matter in the first place.
Why Are Operational Metrics Important?
Operational metrics matter because they let owners track profitability, delivery health, capacity, cash flow, efficiency, and growth.
Here is why each reason matters in practice:
- Profitability: Revenue can look healthy while project profitability slips. Too many hours on under-scoped work still ships the project. The margin takes the hit.
- Delivery health: A project can look fine while the team burns through budget behind the scenes. Operational performance shows whether delivery is damaging margin.
- Capacity: Pipeline is only useful when you can compare it with available people, scheduled work, and delivery capacity. Otherwise, the business can sell work it does not have the space to deliver.
- Cash flow: Completed work does not help much if it sits unbilled or unpaid. Billing-related metrics show whether delivered work is turning into invoices and collected revenue.
- Operational efficiency: Operational efficiency metrics show where time, budget, or capacity is lost. Operational inefficiency hides in extra rounds, idle time, and delayed billing.
- Growth planning: Growth is easier to manage when owners can see capacity, profitability, and pipeline together. Stronger business performance comes from spotting pressure early, before delivery quality or margin starts to suffer.
Different industries use different metrics, so the next step is not to copy every popular example. First, understand the common categories, then choose the ones that fit how your business actually works.
What Are the Common Categories of Operational Metrics?
The common categories of operational metrics are production, people, customer service, cost, demand, and finance. We grouped them this way; other sources split them differently.
Here is what each category covers and where it applies:
Common operational metrics categories
| Category | Common metrics | Most relevant for |
|---|---|---|
| Production and efficiency | Operational efficiency metrics, cycle time, cost per unit, error rate, on-time delivery rate | Manufacturing, fulfillment, logistics |
| People and capacity | Resource utilization, capacity utilization, employee productivity, productivity rate, employee engagement | Services, operations, manufacturing |
| Customer service | Customer satisfaction, Net Promoter Score, customer retention rate, customer service response time | Support, customer success, service delivery |
| Cost and logistics | Cost per unit, inventory turnover, supply chain efficiency, cost efficiency | Retail, distribution, manufacturing |
| Marketing and demand | Website traffic, conversion rate, customer acquisition cost, customer lifetime value, market share | Marketing and revenue teams |
| Finance and profitability | Gross margin, revenue growth, operating costs, project profitability, error rate in billing | Most businesses |
The point is not to track every operating metric in the table. A manufacturer cares about production and logistics. A professional services owner needs a clearer view of people, time, budgets, billing, and margin.
For that reason, the sections below focus on the metrics that matter most in professional services.
Which Operational Metrics Should Professional Services Businesses Track?
Professional services businesses should track utilization, pipeline, billing, budget health, and profitability metrics. The five areas below are our own grouping.
Here is what each one tells you:
Professional services operational metrics
| Metric area | Metrics to track | What they help you understand |
|---|---|---|
| Utilization and capacity | Billable utilization, scheduled utilization, available capacity, non-billable time rate | Whether team capacity is turning into planned and billable work |
| Pipeline and demand | Pipeline value, weighted pipeline value | Whether future work is realistic and deliverable |
| Revenue and billing | Unbilled work, invoiced revenue, overdue invoice rate | Whether completed work is turning into invoices and cash |
| Project and budget health | Worked vs estimated hours, budget usage, budget remaining | Whether active work is staying within the plan |
| Profitability | Project profit, project margin, profitability by client, service-level margin | Whether client work is actually profitable |
Every metric listed above can be pulled from Productive data, either directly or as a simple calculation. That was the filter for building the list. Some carry a different label in the product, so the name here may not match the field exactly. A services business already has these numbers in its own project and financial data.
Utilization and Capacity Metrics
Utilization and capacity metrics show whether your team’s time is planned, used, and still available. Four metrics can cover it.
1. Billable utilization
Billable utilization shows how much available time turns into paid client work. It connects team capacity to revenue, not just activity.
Billable Utilization = Billable Hours ÷ Total Hours Worked × 100
For example, 30 billable hours out of 40 total hours gives you 75% billable utilization.
2. Scheduled utilization
Scheduled utilization indicates how much future capacity is already allocated to client work. It helps you spot gaps before they become staffing or revenue problems.
Scheduled utilization = Scheduled billable hours ÷ available hours × 100
For example, 32 scheduled billable hours out of 40 available hours gives you 80% scheduled utilization.
3. Available capacity
Available capacity shows how much room the team still has for more work.
Available capacity = Available hours − scheduled hours
For example, 160 available hours minus 120 scheduled hours leaves 40 hours available.
4. Non-billable time rate
The non-billable time rate shows how much tracked time goes toward internal, admin, or unpaid work. Non-billable time is not automatically bad. It becomes a problem when nobody can see how much exists or what it costs.
Non-billable time rate = Non-billable hours ÷ total tracked hours × 100
For example, 8 non-billable hours out of 40 tracked hours gives you a 20% non-billable time rate.
A utilization rate is only useful when it has context. High utilization can still hide poor margins. Low utilization can signal a pipeline gap, poor scheduling, or too much time stuck in internal work.
Working utilization out in a spreadsheet is a pattern we hear from services firms. One agency told us they track time in a separate tool and handle profitability projections and utilization reporting internally. A number assembled that way arrives late, and it hides who is overloaded and who is underused.
Productive’s Resource Planner tracks utilization by comparing logged time to each person’s available hours. Configured cost rates feed the capacity and cost calculations.
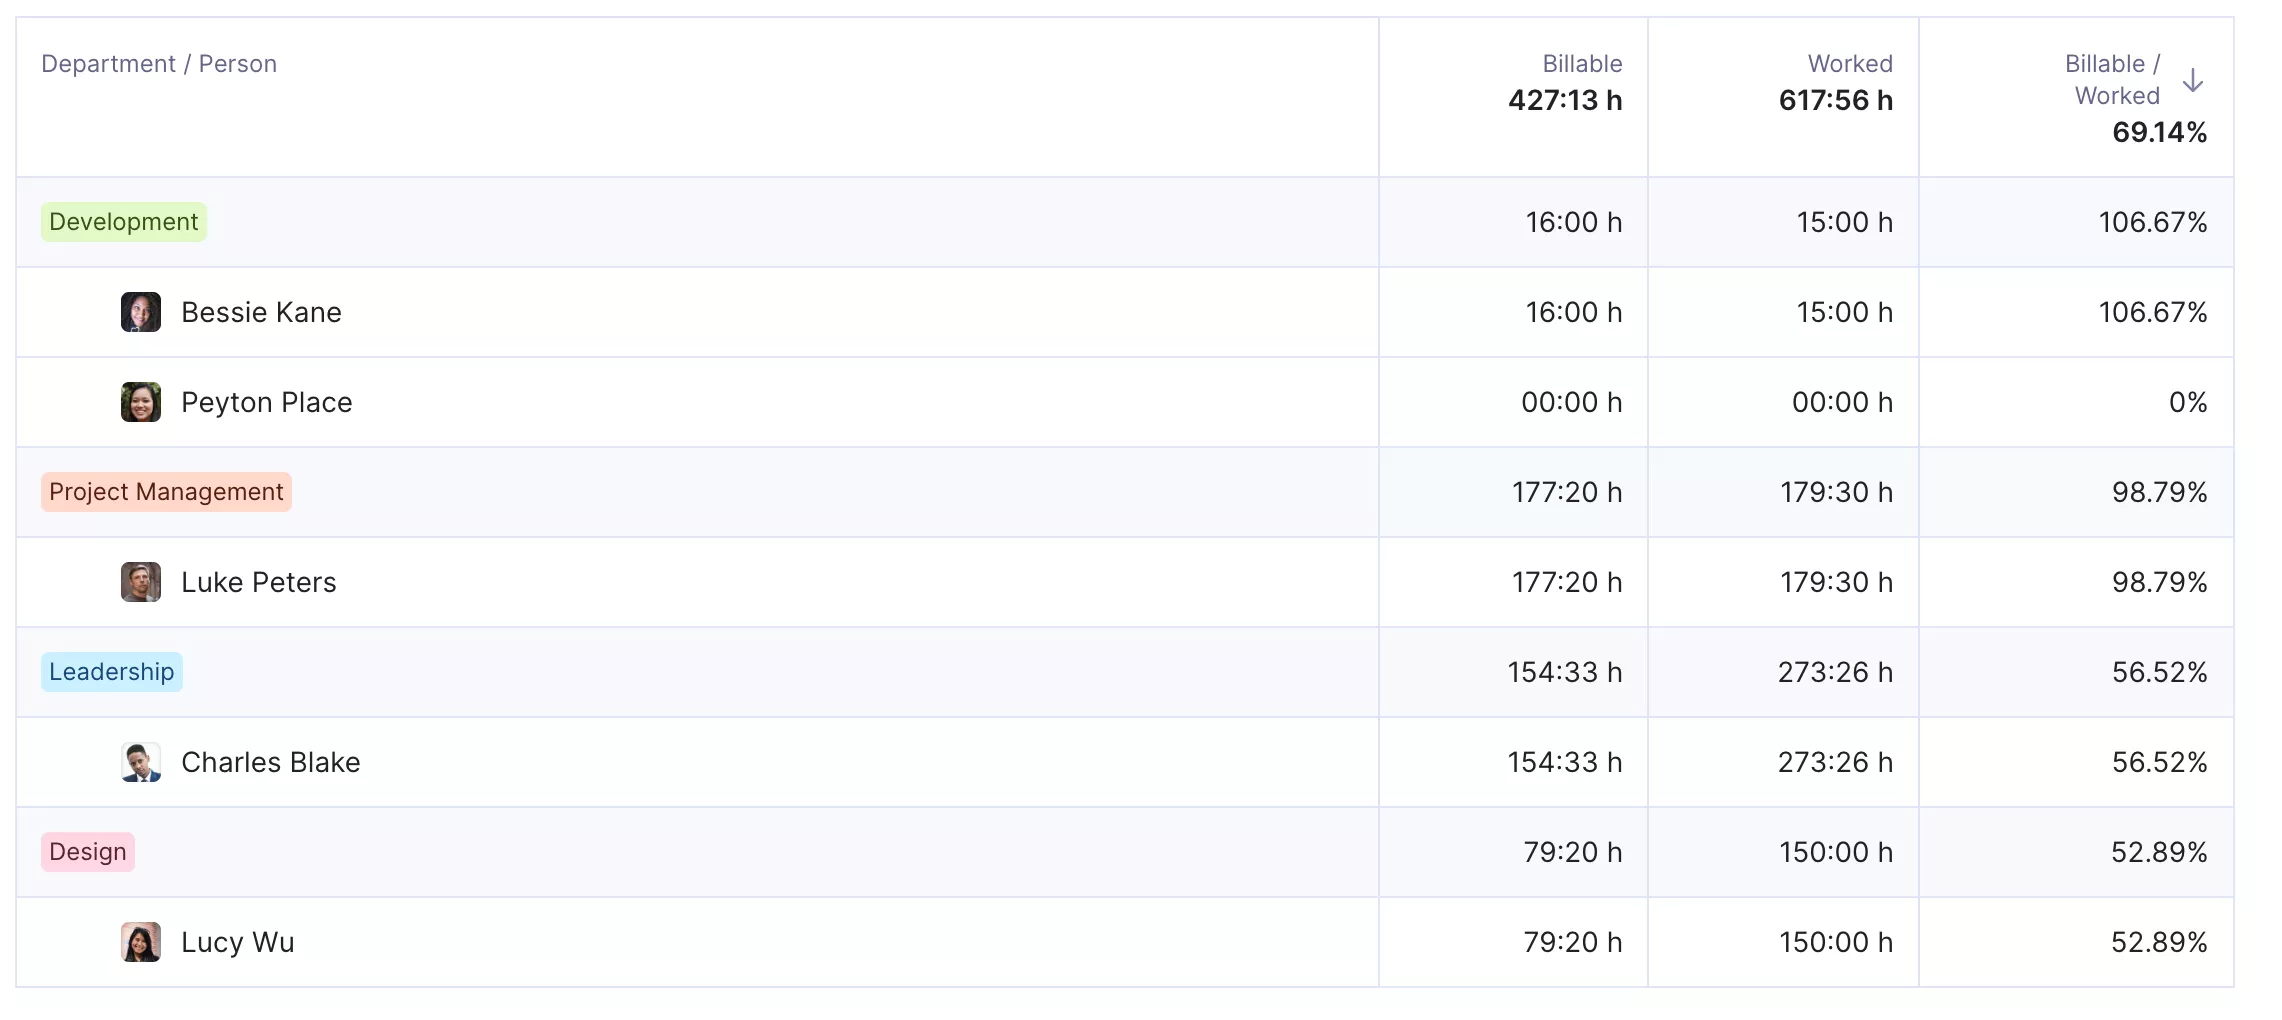
View utilization per employee in Productive.
In the planner, leaders review past and upcoming capacity, bookings, and tentative work. That shows where someone is under- or over-allocated, and whether to reallocate work or add headcount.
Track utilization in Productive.
Utilization shows how current capacity is being used. The next question is whether future work actually fits that capacity.
Pipeline and Demand Metrics
Pipeline and demand metrics show whether expected work matches the capacity you have to deliver it. Two numbers can do the work here.
5. Pipeline value
Pipeline value shows how much potential future work exists across your open deals.
Pipeline value = Sum of open deal values
For example, five open deals worth €20,000 each give you a pipeline value of €100,000.
Pipeline value is a useful starting point, but it does not adjust for close probability. That can make the total look more solid than it is.
6. Weighted pipeline value
Weighted pipeline value accounts for close probability. It is a more reliable performance metric for owners forecasting demand or planning capacity ahead of time.
Weighted pipeline value = Deal value × close probability
For example, a €40,000 deal with a 50% close probability has a weighted value of €20,000.
Planning capacity from raw pipeline value can lead to overbooked teams or missed shortfalls. Weighted pipeline value gives a more honest picture of what revenue is realistically coming in.
Read both against your scheduled utilization and available capacity. Growing pipeline plus committed capacity shows staffing pressure early.
Pipeline shows what work is coming. Revenue and billing metrics indicate whether the work already delivered is generating revenue.
Revenue and Billing Metrics
Revenue and billing metrics show whether completed work is being turned into invoices and cash collected. Three metrics can make this visible.
7. Unbilled work
Unbilled work is the gap between completed billable work and work that has been formally invoiced. It shows how much delivered effort has not yet turned into money.
Unbilled work = Billable work completed but not yet invoiced
For example, a team completes 25 billable hours in a week but invoices none of them. That is 25 hours of unbilled work.
A growing unbilled work figure can mean invoicing is lagging behind delivery. Left unchecked, it creates cash flow gaps even when projects are on track. In Productive, this shows up as work marked for invoicing on the budget.
8. Invoiced revenue
Invoiced revenue shows how much delivered work has been formally billed within a given period.
Invoiced revenue = Total value of invoices issued in a period
For example, €85,000 invoiced in April means that amount of work has been formally billed to clients that month.
Tracking invoiced revenue alongside unbilled work shows whether billing is keeping pace with delivery. A consistent gap between the two is worth investigating.
9. Overdue invoice rate
Overdue invoice rate shows how much of your invoiced work is not being paid on time.
Overdue invoice rate = Overdue invoices ÷ total invoices × 100
For example, 6 overdue invoices out of 40 total gives you a 15% overdue invoice rate.
A high overdue invoice rate points to client payment issues, invoicing errors, or unsurfaced disputes. It is a useful financial metric for catching cash flow risk early.
These billing metrics tell you whether completed work is becoming cash. Project and budget health metrics tell you whether the work still in progress is staying on track.
Project and Budget Health Metrics
Project and budget health metrics show whether active work is staying within the planned time and budget. Three numbers can track that.
10. Worked vs estimated hours
Worked vs estimated hours shows whether the team is spending more time on a project than was originally planned.
Worked vs estimated hours = Worked hours ÷ estimated hours × 100
For example, 45 worked hours on a project estimated at 40 gives you 112.5%.
Anything above 100% means the work has taken more hours than the estimate allowed. That does not always mean the budget is at risk, but it is worth checking. A team that consistently runs over may be underestimating scope, absorbing unbilled changes, or working from stale estimates.
11. Budget usage
Budget usage shows how much of the total project budget has already been consumed.
Budget usage = Used budget ÷ total budget × 100
For example, €8,000 used out of a €10,000 budget gives you 80% budget usage.
Budget usage is most useful when read alongside project progress. As a rough guide, 80% used at 60% complete is worth a look. At 90% complete, it is not.
12. Budget remaining
Budget remaining shows how much budget is left before the project becomes financially risky.
Budget remaining = Total budget − used budget
For example, a €10,000 project with €8,000 used has €2,000 remaining.
Budget remaining is a practical number for project managers to check regularly. It shows how much room is left, not just how much has been spent.
These three read spend against plan. Earned value methods cover the same ground more formally. Cost variance in project management is one of the more common starting points.
Budget problems can become visible too late. A team may know what has been delivered without knowing what it cost in real time. One agency described project managers estimating progress by hand each month-end. They then compare that against costs to date.
With Productive’s Budgeting, teams can monitor budget usage, remaining amounts, logged hours, spending, and profitability directly on the budget. Those figures update as time is logged and after approval.
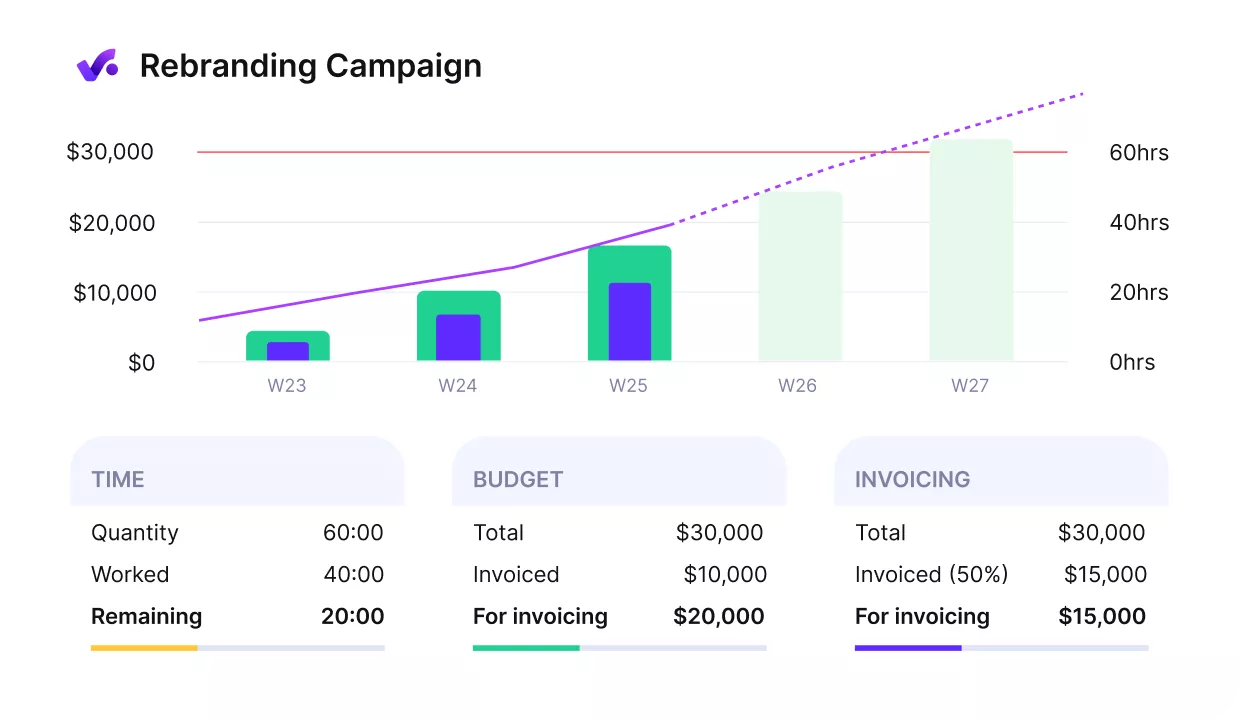
Track your budgets in real time in Productive.
A built-in warning alerts the budget owner when billable time reaches a set percentage of estimated hours. That gives PMs visibility into spend and overrun risk in time to act.

I find having financial visibility and a real-time overview of profitability across dozens of projects to be invaluable.
Read the full customer story to see how Capptoo centralized budgets and profitability across four business segments.
Budget health shows whether projects are staying within plan. Profitability metrics show whether they are generating the margin they were supposed to.
Profitability Metrics
Profitability metrics show whether client work generates enough margin to be worth delivering. Being busy is not the same as being profitable. A team can hit 90% utilization and still deliver projects that barely break even.
13. Project profit
Project profit shows how much revenue a project keeps once delivery costs are paid. It answers whether the project was worth doing, in currency rather than percentages.
Project profit = Project revenue − project costs
For example, €20,000 in revenue minus €14,000 in delivery costs gives you €6,000 in project profit.
14. Project margin
Project margin converts profit into a percentage. It is the profit margin on that piece of work, which lets you compare across projects of different sizes. A project with €6,000 profit looks different depending on whether the revenue was €20,000 or €200,000.
Project margin = Project profit ÷ project revenue × 100
For example, €6,000 profit on €20,000 revenue gives you a 30% project margin.
Plenty of firms never calculate it. Promethean Research found that “59% of agencies tracked individual project margins” in its 2026 survey. Among those that did, the average was 35%.
15. Profitability by client
Profitability by client shows which relationships generate healthy margins and which cost more to serve than they return. Not every low-margin client is a problem. Some are strategic, a reference, a new market, or a relationship with long-term upside. The point is that you should know who they are and why they are there.
Profitability by client = Client revenue − client costs
For example, €100,000 in revenue minus €78,000 in delivery costs gives you €22,000 in client profit.
16. Service-level margin
Service-level margin shows how much each service earns relative to the cost of delivering it. It is a performance metric for deliberate pricing, staffing, and selling. Say one service type holds 40% margin and another only 12%. That gap changes how a business grows.
Service-level margin = Service profit ÷ service revenue × 100
For example, €4,000 in service profit on €12,000 in revenue gives you a service-level margin of about 33%.
Read together, these four show where profit margin is made and where it is quietly lost. They are key performance indicators for the business, not just for finance. Sixteen metrics is more than most people review weekly, which raises the question of how to narrow them down.
How Do You Choose the Right Operational Metrics?
Choose operational metrics based on the decisions you need to make, not the number of metrics you can track.
It is easy to work the other way round. You start with what the software can report and collect numbers because they are available. Then sales asks whether there is room for another client, and you still hesitate.
Work the other way. Write down the five or six decisions you make every month. Pick the two or three performance metrics that inform each one. Anything left over is reference data, not a metric you review.
Here are the decisions and the numbers that answer them:
Metrics by decision
| Decision you need to make | Metrics that help | Why it matters |
|---|---|---|
| Can we take on more work next month? | Scheduled utilization, available capacity, pipeline value | Shows whether sales and delivery are aligned |
| Are active projects still healthy? | Budget usage, budget remaining, worked vs estimated hours | Shows whether projects are drifting while there is still time to act |
| Are projects profitable? | Project profit, project margin, profitability by client, service-level margin | Shows whether client work creates enough margin |
| Are people busy with the right work? | Billable utilization, non-billable time rate, scheduled utilization | Separates useful work from general busyness |
| Are we billing work properly? | Unbilled work, invoiced revenue, overdue invoice rate | Shows whether completed work is becoming cash |
| Is future work realistic? | Weighted pipeline value, pipeline value, scheduled utilization | Shows whether planned work fits delivery capacity |
| Are clients receiving consistent service? | Customer satisfaction, customer service feedback | Shows whether operational decisions are affecting the customer experience |
The last row sits slightly apart from the others. Customer satisfaction and customer service feedback are not time or budget metrics. Read them alongside the rest anyway. A drop in either can trace back to a resourcing or budget decision made weeks earlier.
Knowing which numbers matter is half of it. The other half is keeping them in front of the right people.
How Should You Track Operational Metrics?
Track operational metrics by assigning owners, setting a review cadence, and deciding what action each metric should trigger. Those three things turn a dashboard into a working process.
The trigger is the part that gets skipped. A dashboard can be reviewed every month, produce agreement that the numbers look concerning, and change nothing. An action trigger is a threshold agreed in advance, so nobody argues about whether a number is bad.
Cadence should match how fast the metric moves. Utilization and budget health shift weekly. Margins settle over a project, so a monthly look at that key metric is enough.
Ownership shapes what gets built. Operations leaders need a portfolio view, project managers a handful of budgets. That usually means two or three KPI dashboards scoped by role, reading the same time tracking data.
Here is a starting point for each area, which you can adjust to your own team:
Metric ownership and review cadence
| Metric area | Owner | Review cadence | Action trigger |
|---|---|---|---|
| Utilization and capacity | Operations or resourcing lead | Weekly | Capacity is overbooked, underused, or uneven |
| Pipeline and demand | Sales and operations | Weekly or biweekly | Future work exceeds available capacity |
| Revenue and billing | Finance lead | Weekly | Unbilled work or overdue invoices increase |
| Project and budget health | Project manager or delivery lead | Weekly | Worked hours rise faster than progress or budget allows |
| Profitability | Owner, finance lead, or operations lead | Monthly | Margins fall below target |
The harder problem is assembly time. Utilization comes from a timesheet export, budgets from a spreadsheet, invoices from the accounting tool. Someone has to join them by hand, and by then the decision has been made.
Report Intelligence in Productive removes that step. You ask a question about your data in plain language. The answer comes back interpreted, not a report you still have to read.

Ask AI for insights in plain language in Productive.
Ask which clients were most profitable last year, or which budgets are running hot. The answer can come back as a structured Artifact you can share, or export as a PDF.
If you are comparing options, our roundup of project dashboard software covers helpful options.
Which Operational Metrics Mistakes Should You Avoid?
Avoid treating every metric like a KPI, tracking utilization without margin, tracking revenue without delivery cost, tracking project progress without budget health, and reviewing metrics without ownership. The list is our own, drawn from the metrics covered above.
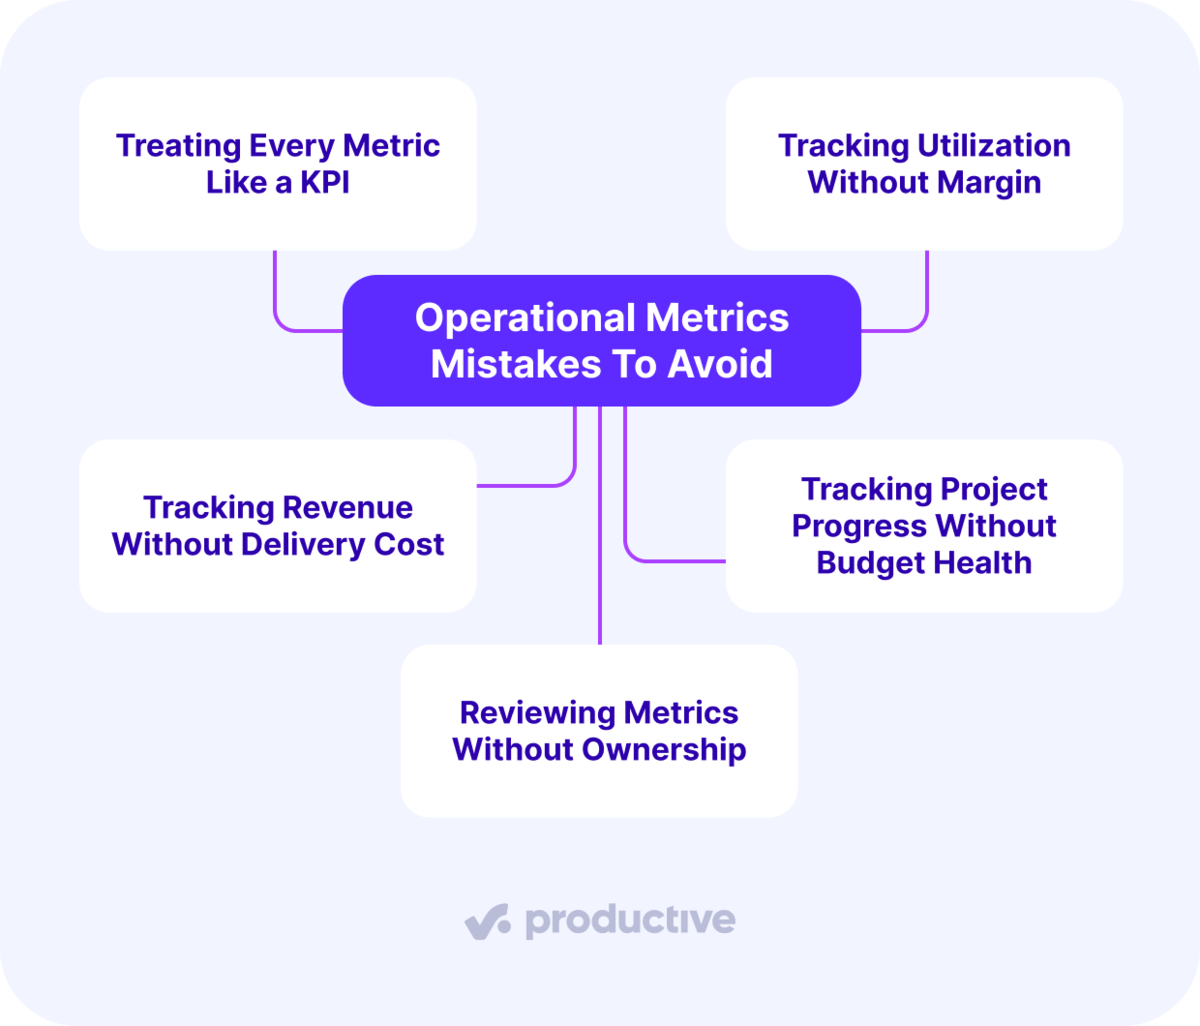
We’ll take a closer look at each.
Treating Every Metric Like a KPI
Treating every metric like a KPI hides the ones that need action. A services business can track dozens. Only a handful should guide decisions.
Pick the few that become key performance indicators and give them targets. Everything else is reference data. Some of it is a vanity metric: it looks good and changes no decision.
Tracking Utilization Without Margin
Tracking utilization without margin mistakes activity for profit. A team at 90% billable can be busy on discounted work, under-scoped projects, or over-serviced accounts.
Utilization tells you whether people are working. It says nothing about whether the work was worth doing. Read it next to project margin, budget usage, and non-billable time rate, and the picture changes. Busy and profitable are different conditions. Our guide to billable utilization in agencies goes further on targets and what moves them.
Tracking Revenue Without Delivery Cost
Revenue read on its own hides what delivery consumed to earn it. Costs can rise faster than the top line while the top line still looks strong. That is how firms grow into thinner margins.
Pair revenue with project profit, project margin, and profitability by client. If revenue is up 20% and margin is down four points, the growth is costing you something.
Tracking Project Progress Without Budget Health
Tracking project progress without budget health lets spend run ahead of delivery. Tasks get closed, milestones get hit, and the budget moves faster than the work.
Progress and spend need to be read together. Budget usage at 80% with the project 60% complete is a warning worth acting on. Worked vs estimated hours catches the same drift earlier, provided time tracking is current enough to trust.
Reviewing Metrics Without Ownership
Reviewing metrics without ownership leaves the other four unfixed. A metric with no owner becomes passive reporting. Everyone sees the number, nobody answers for it, and the review turns into a status update.
Every metric that matters needs three things: an owner, a review cadence, and an agreed action trigger. Without those, accurate performance metrics still sit unused.
Track Metrics Where the Work Happens
Track these metrics where the work is recorded, not in a monthly rebuild. Sixteen of them across five areas cover the ground: utilization, pipeline, billing, budget health, and profitability. None are hard to calculate. They get hard when the inputs sit in separate systems, and someone assembles the picture by hand.
Keeping them in one place removes that step. Productive holds projects, budgets, time, resources, and invoices together, so the numbers stay current.
Book a demo with Productive to see it running on your own projects.
Stop Rebuilding the Same Report
Productive keeps projects, budgets, time, and invoices together, so the numbers leadership reviews are the ones the delivery team is working against.
