How to Calculate Cost Variance in Project Management (2026)

Cost variance in project management compares what finished work should have cost with what it really cost. Watching it shows which projects are losing margin while you can still restaff or raise a change order.
This article covers the definition, the formula, what positive and negative variance mean, and the three calculation methods. It then shows how to read a variance against thresholds and how cost variance pairs with schedule variance.
It closes with CPI, TCPI, corrective moves, other variance types, and consulting and retainer examples.
What Is Cost Variance in Project Management?
Cost variance is the difference between the value of work you have completed and what that work actually cost. You measure it at a chosen point in the project. It comes from earned value management (EVM), and it takes two inputs.
- The first, earned value (EV), is the budgeted cost of work performed so far.
- The second, actual cost (AC), covers your actual expenditures on that work.
The formula for cost variance (CV) = EV – AC.
Construction projects carry heavy material costs. In a professional services firm, AC is almost entirely hours multiplied by internal cost rates. This cost fluctuation metric only returns an honest number when every hour is logged against the right project.
Every role also needs a cost rate. Agencies that invoice a fixed fee but never record actual time get a figure that flatters them.
Example of a Cost Discrepancy
Example: a branding project has a $20,000 budget and 40% of its agreed scope delivered, so EV is $8,000. Actual cost stands at $9,500, so CV is negative $1,500. The project manager now knows the team is spending about $1.19 for every dollar of value produced. That is less than halfway through the work.
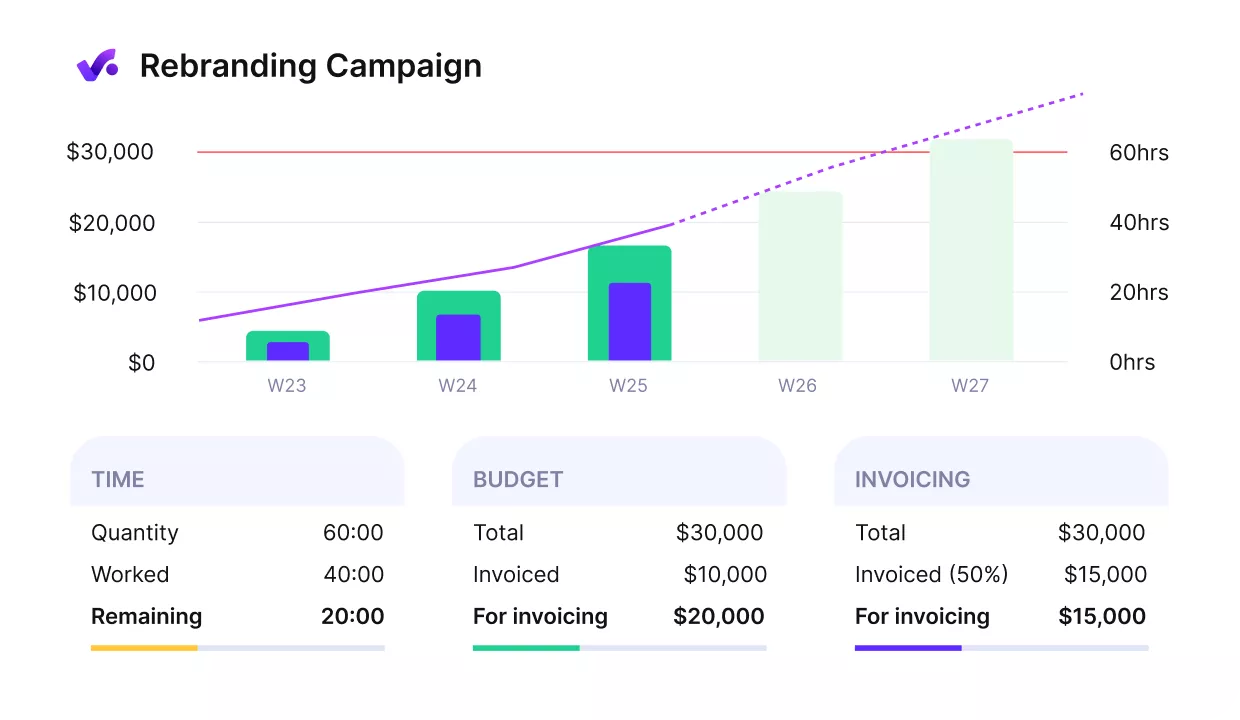
Get early warnings of budget overruns and rising costs.
A favorable cost variance occurs when EV exceeds AC, so the finished scope cost less than you budgeted. A negative result is a cost overrun, where spend has outrun the value delivered.
Whether negative $1,500 needs a client call or a line in the weekly variance report depends on its size.
How to Calculate Cost Variance?
Calculate cost variance by subtracting actual cost from earned value, then reading the sign. Divide CV by EV for the cost variance percentage.
Take all three inputs from the same date: percent complete at sign-off, the approved budget, and approved timesheets. Multiply the percentage by the budget for EV, the first step of earned value analysis. Subtract the spend, and you have a figure you can defend line by line with a client.
EV – AC = CV
CV / EV x 100 = cost variance percentage
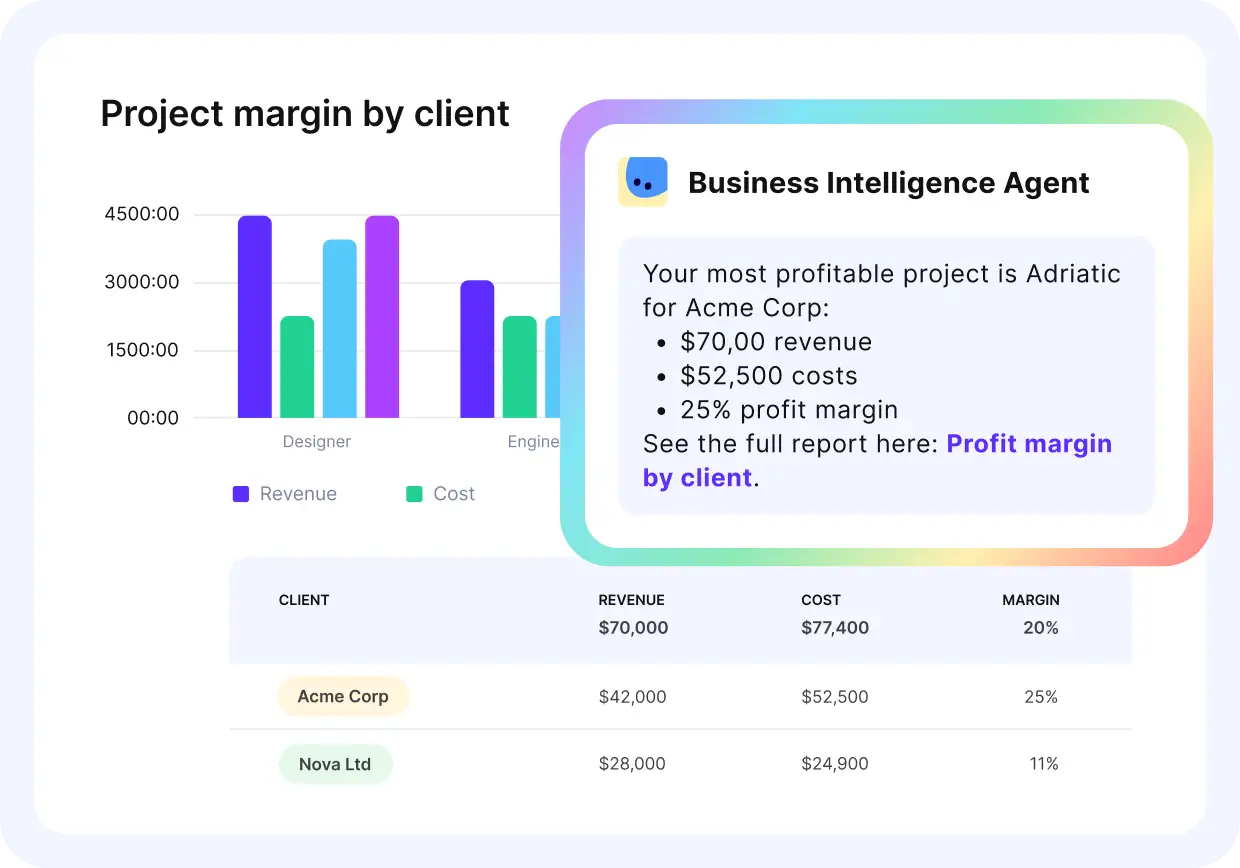
Instead of manual calculation, ask the AI assistant for profitability insights in plain language.
What Are the Types of Cost Variance Formulas?
Types of cost variance formulas are point-in-time, cumulative, and variance at completion. All three subtract actual cost from earned value. What changes is the window of work the two figures cover.
That window decides whether the number is a warning you can act on or a record of the past.
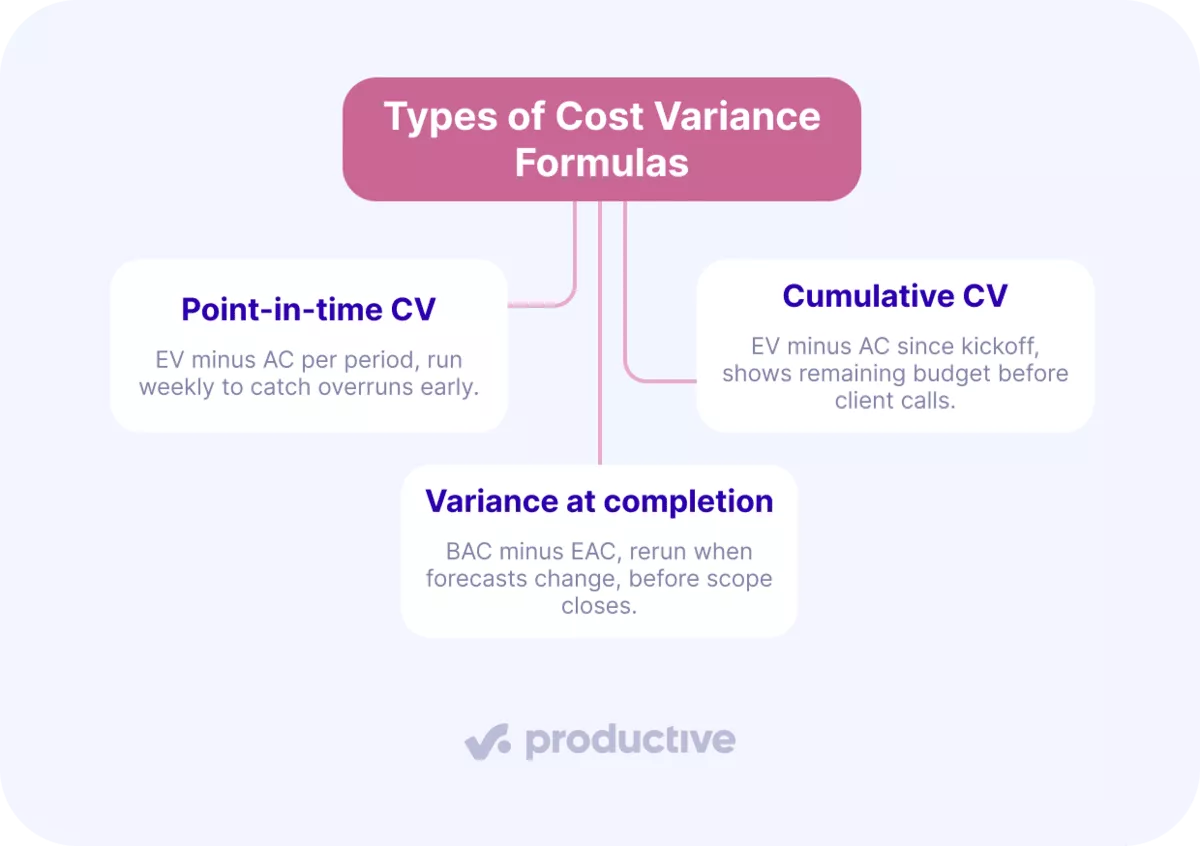
Use all three on the same project. The first two are for variance tracking while the work is live, when restaffing or rescoping still helps. Variance at completion goes into budget reports and into cost efficient estimates for the next engagement.
The forecasting chart in Productive combines logged time with scheduled bookings, showing when spend will pass the budget total.
How Do You Read the Size of a Cost Variance?
Read a cost variance as a percentage of EV, then compare it against bands at 5% and 10%. The same $1,500 overrun is 0.75% of $200,000 in EV and 15% of $10,000.
Set the bands before kickoff so every cost deviation already has an action:
- Within 5% of EV: log it in the weekly report.
- Between 5% and 10%: find the cause before the next delivery review.
- Beyond 10%: change staffing or scope, and raise it on the next client status call.
Write the bands into your risk management plan and share them with the client at kickoff. Add a dollar floor such as $500, so stray hours on a small project cannot trigger a review.
In the branding example, negative $1,500 on $8,000 of EV is negative 18.75%. It clears both the 10% band and the floor, so it goes to the client.
How Does Cost Variance Pair With Schedule Variance?
Pair cost variance with schedule variance because each one misreads a project on its own. Schedule variance (SV) is EV minus planned value (PV), the budgeted value of the work scheduled to date.
CV prices the delivered work, and SV checks whether enough of it is done by today.
| CV | SV | What it usually means | First move |
|---|---|---|---|
| Positive | Positive | The estimate carried padding, or cheaper roles did the work | Check quality sign-off before counting the margin as earned, then tighten the next estimate |
| Positive | Negative | The work is cheap because it is not staffed yet, so spend will catch up | Check resource allocation for unbooked hours on this project |
| Negative | Positive | The team is paying senior rates to finish faster | Confirm the deadline needs it, or move hours back to the planned roles |
| Negative | Negative | Rework or scope creep is absorbing hours | List the unquoted tasks and raise a change order |
Take both figures from the same review date, since they share the same EV.
What Do CPI and TCPI Tell You?
CPI (cost performance index) is EV divided by AC, the value you earn for every dollar spent. TCPI (to-complete performance index) is BAC (budget at completion) minus EV, divided by BAC minus AC.
It gives the cost efficiency the remaining work needs to finish on budget. SPI (schedule performance index) is EV divided by PV, so below 1.0 means you are behind schedule.
On the branding project, CPI is 0.84 and TCPI is 1.14.
The team earns $0.84 per dollar today and needs $1.14 per dollar on the remaining 60% of scope.
Divide 1.14 by 0.84 and the remaining work has to run 36% more efficiently than the work to date.
Divide BAC by CPI for the estimate at completion (EAC): $23,750, a variance at completion of negative $3,750. That assumes today’s CPI holds for the rest of the project.
A gap that wide rarely closes, so reset the budget through a change order or cut scope.
Why Should You Analyze Cost Variance?
Analyze cost variance because budget used means nothing until you set it against scope complete. Run a quick earned value analysis on a project that has spent 60% of its $20,000 budget, or $12,000.
At 40% complete, EV is $8,000 and CV is negative $4,000, or negative 50%. At 70% complete, EV is $14,000 and the same spend gives positive $2,000, or positive 14.3%.
Track CV% as a key performance indicator next to margin, so project performance reviews start with it.
In Productive, a time warning emails the budget owner once a set percentage of billable time is tracked. Use that email as the cue to check scope complete.
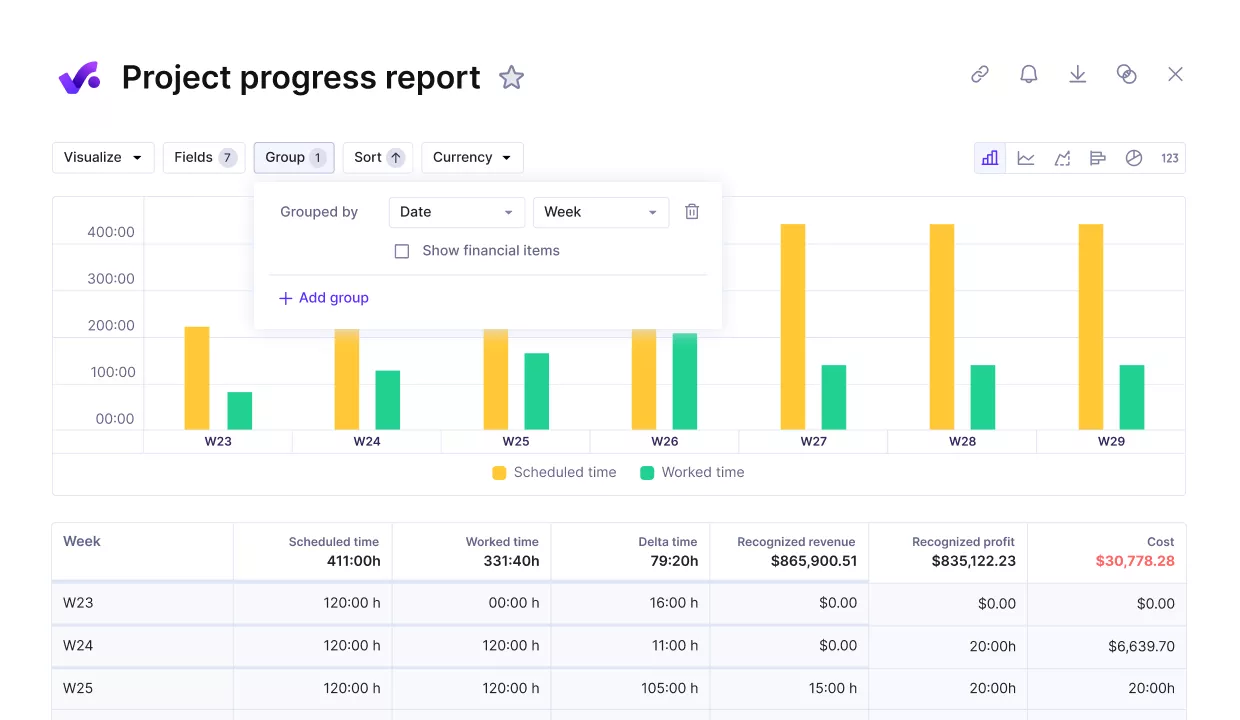
Compare the project progress against key finance metrics.
In cost variance analysis, a negative figure with its cause named also backs a change order. Show the client logged hours against the scope actually delivered, and list the requests the brief never covered. Project managers who raise it before the invoice protect client trust.

We also love the ability to invite our clients into the projects. It takes the middle man out of the equation, no need to go back and forth via e-mail, we can get all of the feedback within Productive. This also lets the client see how much work is actually going into the project and you can see that they have a greater appreciation for what we do.
Learn how to optimize your project cost control and collaboration with Productive.
See the Overrun While There Is Still Scope Left
Productive’s forecasting chart combines logged time with scheduled bookings, so you see when spend will pass the budget total.

What Types of Costs Affect Your Project Budget?
The types of costs that affect your project budget are direct costs and indirect costs. In professional services, direct cost is almost entirely labor: hours logged multiplied by cost rate.
Indirect costs, also called overhead, are tied to activities that don’t produce billable revenue. Overhead splits again. Fixed overhead stays constant whatever your project volume looks like:
- Facility costs (office space rent, equipment, etc.)
- Salaries of non-billable employees and professional services (sales, HR, office management, etc.)
- Licenses and plans (web hosting, software licenses, etc.)
Variable overhead moves with the volume of goods used or services provided:
- Salary or benefit components (employee vacations, bonuses, etc.)
- Equipment maintenance (building repairs, vehicle repairs, etc.)
- Marketing (advertising or PR investments, etc.)
Both categories feed your overhead cost per hour, which turns a raw salary into a true cost rate. That rate is the standard cost your variance analysis measures every hour against. If that rate only exists in a spreadsheet someone refreshes on Fridays, every actual cost figure is days old. Then the variance you report to a client is already wrong.
Recalculate your overhead cost per hour at least quarterly, as a fixed budget management task. Divide last quarter’s non-billable spend by the billable hours your team actually logged.
A rate set in January on January’s headcount understates what every project you price in June really costs you.
On a calculation date you set, Productive averages internal costs and hours to produce overhead cost per hour. It then adds that amount to every hour your team tracks.
Setting the rate correctly during cost estimation is where cost control starts.
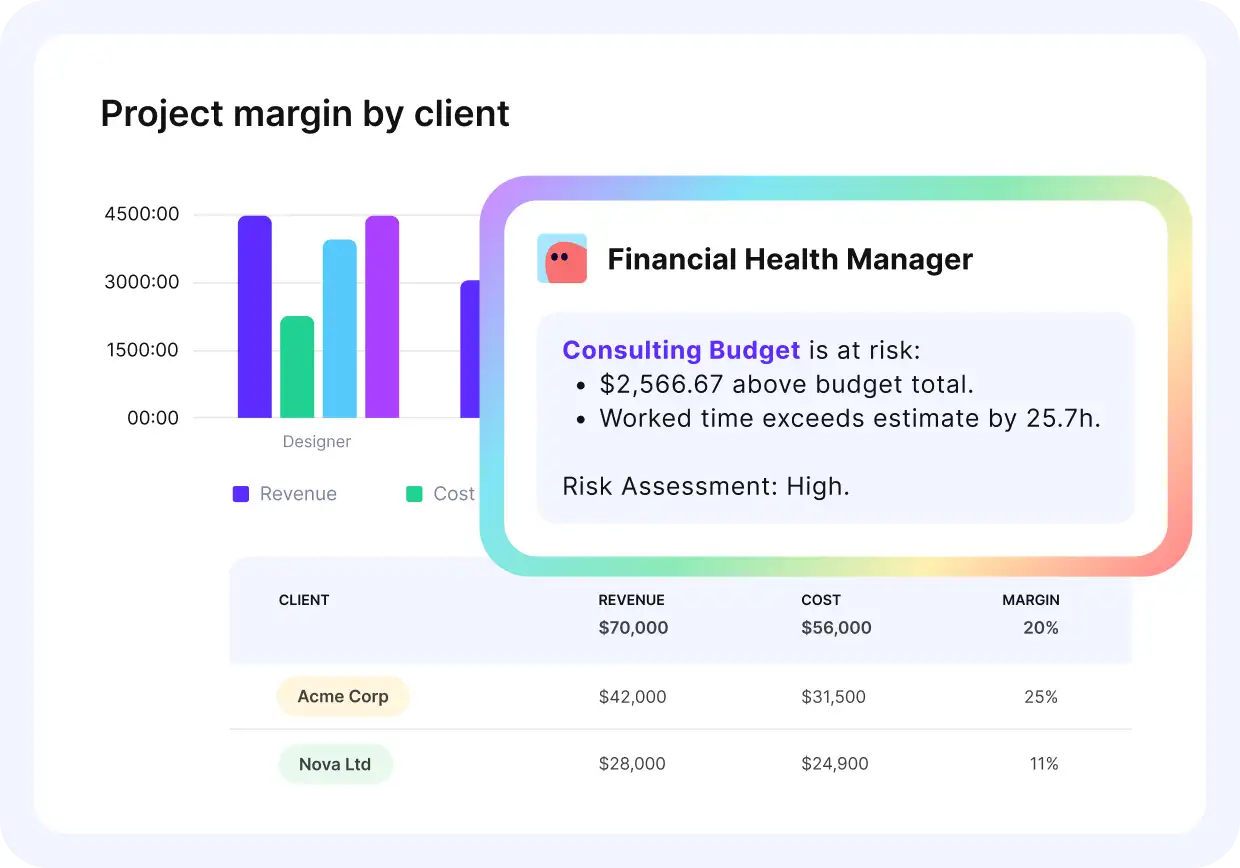
The financial health agent warns you of budget risks.
How Can You Keep Project Costs Under Control?
Keep project costs under control by basing cost estimates on past data, tracking profit margins, and monitoring utilization. The first two set the baseline for cost variance analysis. The third protects that baseline while the work is live. Run all three and cost control stops depending on month-end reports.
1. Base Cost Estimates on Past Project Data
For cost estimation, pull the last three to five closed projects of the same type. Compare estimated hours against logged hours, service line by service line. Set the new estimate at the median actual from those projects. Carry their average overrun as a separate contingency line. The estimate is ready when every service line traces back to hours someone actually logged on delivered work.
2. Track Profit Margins on Every Project
Run a margin figure on every active project at least monthly. Margin is invoiced revenue minus logged hours multiplied by cost rates, by project and by client. Compare each against the margin you priced, and flag anything sitting five points or more below plan. The review is done when each flagged project has an owner and a dated change order or staffing fix.
Each Productive budget’s profitability snapshot calculates margin from billable hours, service prices, tracked hours, and cost rates.

With Productive, I’m understanding new things about profitability. I’ve made certain assumptions before, and some of those assumptions have proven to be wrong. For some projects, we weren’t sure how far over budget we were, and now we can really see.
3. Monitor Billable Utilization Across the Team
Review employee utilization, billable hours as a share of total hours worked, for each person every week. Low numbers mean billable work is not reaching people with room for it. The same overhead then spreads across fewer billable hours, which pushes up every rate you measure variance against.
Numbers near full capacity for months are the burnout signal. Replacing someone who leaves costs more than the overrun you were chasing. Utilization moves before any variance does, so it is the earliest cost control check you have.
Use capacity planning to move the work before either edge becomes a variance you must explain.

Reduce idle hours and overbooking with utilization reports or real time capacity planning.
What Other Variance Metrics Should You Track?
Schedule, labor rate, labor efficiency, material, overhead, and sales variance each isolate one driver of the plan-to-actual gap. Cost variance tells you a fixed-fee build landed $14K over budget. Variance analysis shows whether a rate swap, unscoped hours, a subcontractor invoice, or a discount caused it.
- Schedule variance = EV minus Planned Value. Negative means you have delivered less work than the plan said you would by this date. Fix: Book more hours on the late deliverable in the resource plan, or reset dates the client delayed.
- Labor rate variance = (Budgeted rate minus Actual rate) x Actual hours. When a principal covers for a senior booked at 110% utilization, the rate gap shows here. Paid labor overtime at a premium rate counts here too.
- Labor efficiency variance = (Budgeted hours minus Actual hours) x Budgeted rate. It catches rework and unscoped hours.
- Material cost variance = (Budgeted cost minus Actual cost) of purchased inputs. In a firm, that is software licenses, stock assets, print, and subcontractor invoices. Supplier pricing and market price fluctuations move it, such as a license renewing at a higher rate. Fix: Check each subcontractor invoice against its quote, and bill client-requested extras through a change order.
- Overhead variance = Overhead absorbed minus Actual overhead incurred. Office costs and non-billable salaries spread across fewer billable hours push this negative. Fix: Fill unbooked hours with billable work before you reprice, then recalculate your overhead cost per hour.
- Sales variance = (Actual price minus Budgeted price) x Units sold. Discounted day rates show up here before they show up in margin. Fix: Set a floor day rate in your rate card, and remove scope for any discount below it.
Worked Example of tracking Variance Metrics
You budget a senior consultant at a $120 cost rate for 80 hours. The work goes to someone costing $145 instead. Labor rate variance is ($120 minus $145) x 80, or negative $2,000. The fix is a staffing decision, not a budget decision. Move the routine hours back to the mid-level rate. If the client asked for the senior by name, raise a change request.
When labor efficiency variance turns negative, check the task list for work nobody quoted before you blame the estimate. Scope creep of five unbilled hours a week at a $100 cost rate reaches $6,500 over a 13-week quarter. It reads as an estimating problem until someone names the tasks that were never in the brief.
A non-billable expense logged on a Productive budget reduces its profit without touching the client-facing budget. That is where an absorbed subcontractor overrun shows up as material cost variance.
The cost performance index turns the same inputs into a ratio, EV divided by AC. A CPI above 1.0 matches a positive CV.
Cost Variance Examples
Both cost variance examples use internal cost rates: a fixed-fee consulting engagement and a monthly agency retainer. The engagement runs each formula on one review date. The retainer shows a clean month hiding an over-budget quarter.
Fixed-Fee Consulting Engagement
A fixed-fee engagement plans 400 consultant hours at a $150 cost rate, so BAC is $60,000 over ten weeks. At the week-six review, 50% of scope is signed off, so EV is $30,000 against a PV of $36,000. Approved timesheets put AC at $34,500.
Cost variance is negative $4,500, or negative 15%, beyond the 10% band. SV is negative $6,000, CPI is 0.87, and TCPI is 1.18. At the current CPI, the estimate at completion is $69,000, or $9,000 over budget. On a fixed fee, that $9,000 comes straight out of the margin that measures project success.
A senior costing $180 covered 100 hours planned for the $150 consultant, a labor rate variance of negative $3,000. Ten unscoped hours at $150 add labor efficiency variance of negative $1,500. Together they account for the full negative $4,500. Negative cost and schedule variance flag unscoped work, but the rate swap costs twice as much. A project manager who reads only the sign pairing would chase the wrong fix.
Move the senior’s remaining bookings back to the planned consultant, and raise a change order for the unscoped work.
Monthly Agency Retainer
A monthly retainer covers 100 hours at a $120 cost rate. EV is $12,000 in any month the agreed deliverables ship, and they ship all quarter.
| Month | Actual cost | Point-in-time CV | Cumulative CV |
|---|---|---|---|
| Month 1 | $13,800 | -$1,800 (-15%) | -$1,800 (-15%) |
| Month 2 | $13,200 | -$1,200 (-10%) | -$3,000 (-12.5%) |
| Month 3 | $11,400 | +$600 (+5%) | -$2,400 (-6.7%) |
Read month three alone and the retainer looks healthy at positive 5%. The running total shows the quarter still $2,400 over, or negative 6.7%.
The cause is extra revision rounds: 15 unplanned hours in month one and 10 in month two. That is labor efficiency variance, and month three came in 5 hours under.
Cap revision rounds in the retainer scope, and bill project changes outside it as change orders. Bring the quarter’s cumulative variance to the renewal conversation, and use it to reset the hours or the fee. Raising it at renewal, when clients expect a pricing talk, protects client satisfaction.
Conclusion: Managing Your Budget and Variances
Cost variance is only as accurate as the data behind it, and that data is rarely in one place. Often, hours go in a timesheet app, cost rates in a spreadsheet, and invoices in accounting software. Calculating earned value against actual cost then becomes a manual reconciliation job that nobody runs weekly.
That is why over-servicing usually shows up after the margin is gone. A weekly financial analysis would have caught it while scope was still open.
An all-in-one system removes the reconciliation step. Logged hours multiply against cost rates automatically, so actual cost updates as the work happens. Actual cost and forecasted overrun become a report you open rather than a spreadsheet you rebuild. You can see which clients are profitable and which service lines are underpriced. You also see which engagements need a change order before the next invoice goes out.
If you want to monitor cost variance without a spreadsheet, book a demo with Productive. You will see how budgets, time, and profitability connect in one platform.
Connect With Agency Peers
Access agency-related Slack channels, exchange business insights, and join in on members-only live sessions.
