Gantt Charts in Project Management: Definition and Examples

A Gantt chart is a visual project roadmap for successful delivery. The chart’s structure helps you identify critical paths, manage team workload, and communicate project status to stakeholders using PM platforms with Gantt charts.
This article covers Gantt chart basics and how to build one in four steps. You will also get five examples, what to look for in software, and where the format falls short.
Key Takeaways
- Gantt charts are a must-know project management tool that display activities as horizontal task bars along a timeline, showing duration and dependencies.
- You use these bar charts to track progress, allocate resources, and manage deadlines through an easy-to-understand graphical interface.
- In a Gantt chart, tasks are listed vertically with start and end dates, while horizontal chart bars represent each activity’s duration and completion status.
- Four main dependency types (Finish-to-Start, Start-to-Start, Finish-to-Finish, and Start-to-Finish) help establish logical task relationships and critical paths.
What Is a Gantt Chart?
A Gantt chart is a project management tool that maps a project schedule along a timeline. Parallel bars represent the duration of each activity.
Tasks and subtasks run down the vertical axis. Time runs across the horizontal axis, in whatever scale suits the project. Bar length shows how long each activity takes, and connecting lines show which task waits on which.
Gantt charts were originally drawn by hand on paper. The format is still the most recognizable chart for project planning, and modern versions are dynamic digital visuals you can edit on screen.
Gantt charts are useful for tracking project progress, managing dependent tasks, and coordinating team resources. They give you a visual representation of your project structure, which makes it easier to spot bottlenecks and adjust schedules before they cost you time.
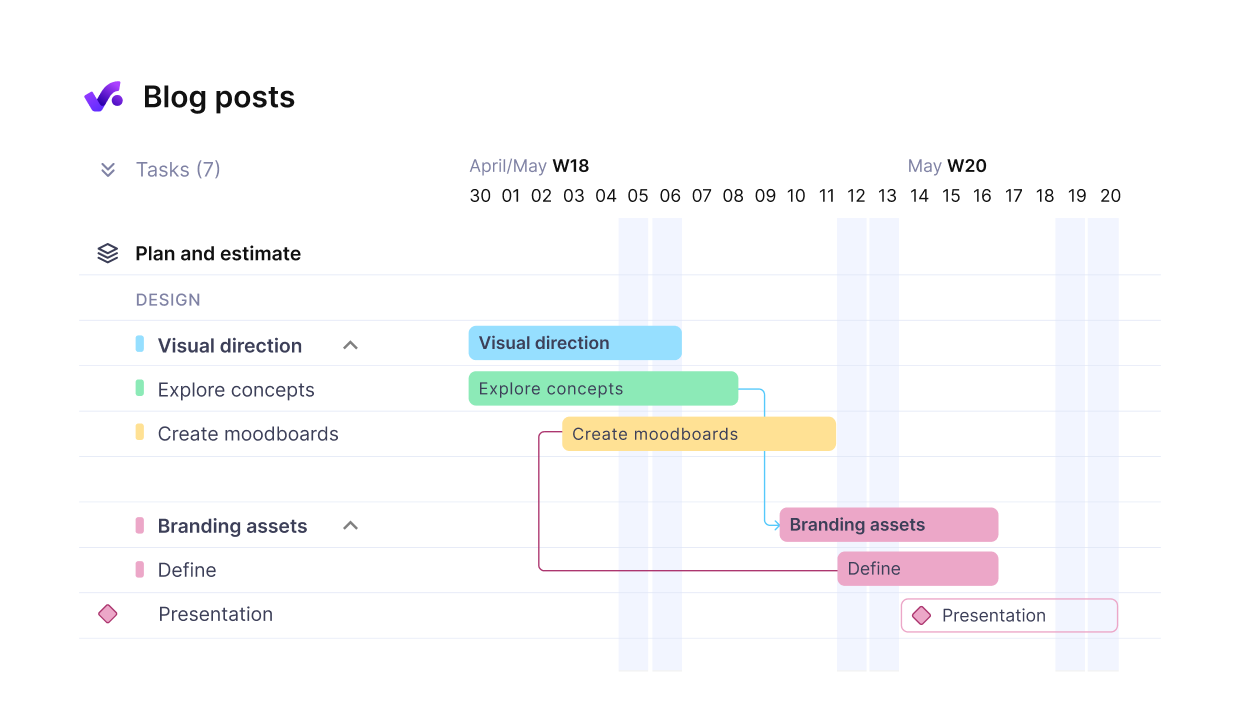
Use Productive’s Gantt charts to visualize timelines and task dependencies.
What Is the History of the Gantt Chart?
The Gantt chart dates back to 1903. Henry L. Gantt published a paper that year on using “graphics” for production planning. It appeared alongside Frederick W. Taylor’s Shop Management.
James Wilson’s history of the format, published in the European Journal of Operational Research, notes that standard textbooks date the charts to Gantt’s work during the First World War.
Gantt was a close associate of Taylor and an advocate of Scientific Management. His charts planned workloads for men and machines across factory departments. Wilson argues Taylor’s system “would have been unworkable” without them.
So the format did not start out as a project tool at all. It began as factory production planning, and project scheduling stayed a minor application for decades.
How Do Gantt Charts Work?
Gantt charts work by using horizontal bars to represent tasks along a timeline. Each bar shows when a task starts, when it ends, how long it runs, and what it connects to.
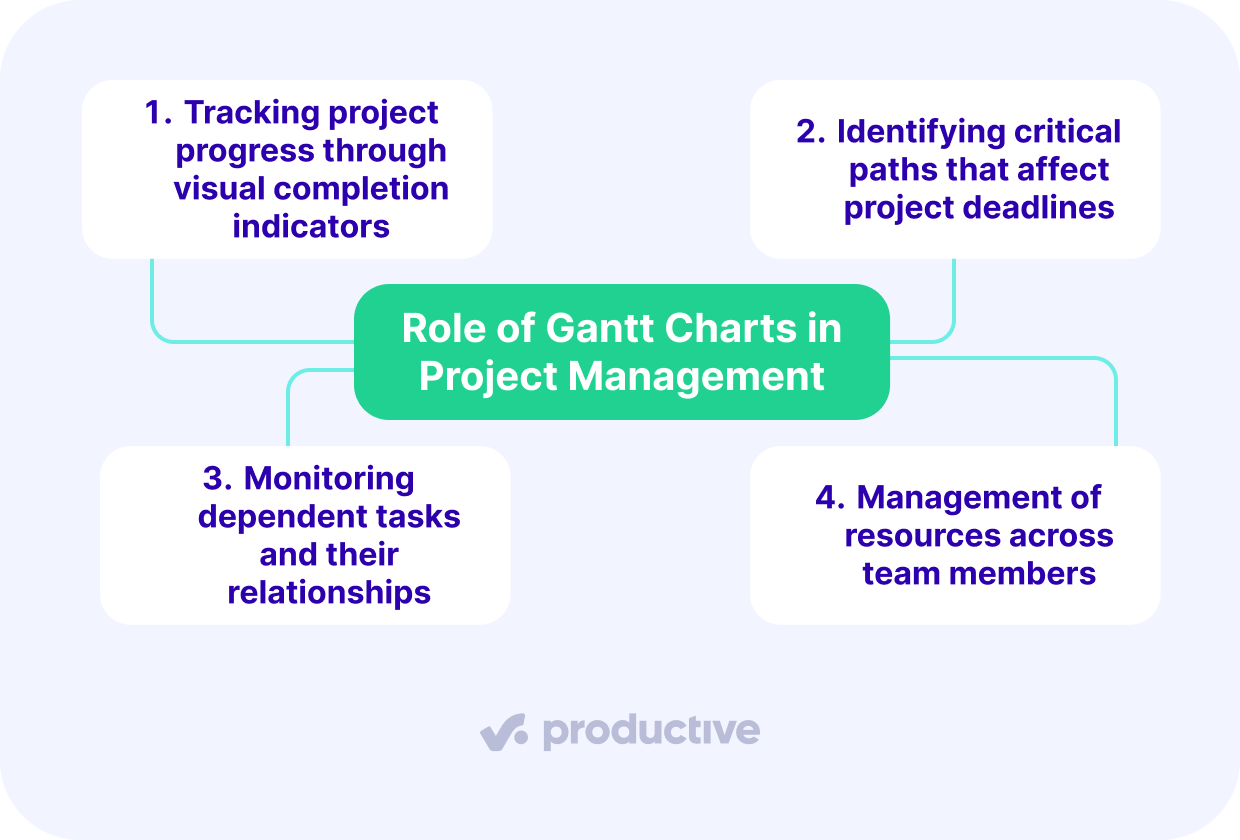
That format presents complex project information in a readable layout. Here are the Gantt chart basics you use day to day:
- Track actual progress through visual completion indicators.
- Identify critical paths that affect project deadlines.
- Manage resources across team members.
- Monitor dependent tasks and their relationships.
What Are the Key Components of a Project Gantt Chart?
The key components of a Gantt chart are tasks, task bars, milestones, and resource allocation, all mapped against a timeline.
For a consultancy running several client engagements at once, these components decide whether you catch a slip early or explain it after the fact.
Here is what each one does:
- Tasks sit vertically on the left with start and end dates. They define what the rest of the chart measures.
- Task bars run horizontally to show duration. Where two bars overlap, you see a scheduling clash before it hits delivery.
- Milestones mark deadlines. In services work, they often double as billing triggers, so a slipped milestone means delayed revenue.
- Resource allocation ties each bar to the people booked on it. That is where timeline length becomes a capacity decision.
That last connection matters most for firms billing by the hour. A detailed Gantt chart records an project schedule and can track actual progress against it. You can then compare booked hours to logged hours per phase, and see which tasks are over budget before the phase closes.
Why Should You Use Gantt Charts in Project Management?
You should use Gantt charts in project management because they give you one centralized view of every activity, its duration, and its dependencies.
Projects are also getting harder to keep track of. PMI’s 2026 Pulse of the Profession found that 81% of project professionals say projects have become more complex in recent years, with 37% describing a significant increase.
These charts help through:
- Extensive visibility of tasks, their connections, and execution timeframes.
- Improved team communication and stakeholder engagement.
- Efficient resource assignment and time management.
- Clear accountability for every task owner.
They are particularly valuable for remote teams and for spotting bottlenecks before they hit your timeline. With real-time progress tracking, you can adapt to changes quickly while holding the delivery date.
When Should You Use a Gantt Chart?
You should use a Gantt chart when your project has multiple dependent tasks, several teams to coordinate, or resources to allocate across phases.
They are especially useful in construction, software development, and manufacturing, where precise production schedules are essential. In professional services the reason is different. A Gantt chart shows which client engagements overlap, and who is booked on both.
Reach for one when you are creating a project plan, tracking project progress, monitoring key milestones, or handling complex resource and work management.
They also help you avoid scheduling conflicts and make sure your team knows their responsibilities and deadlines.
How Do You Create a Gantt Chart?
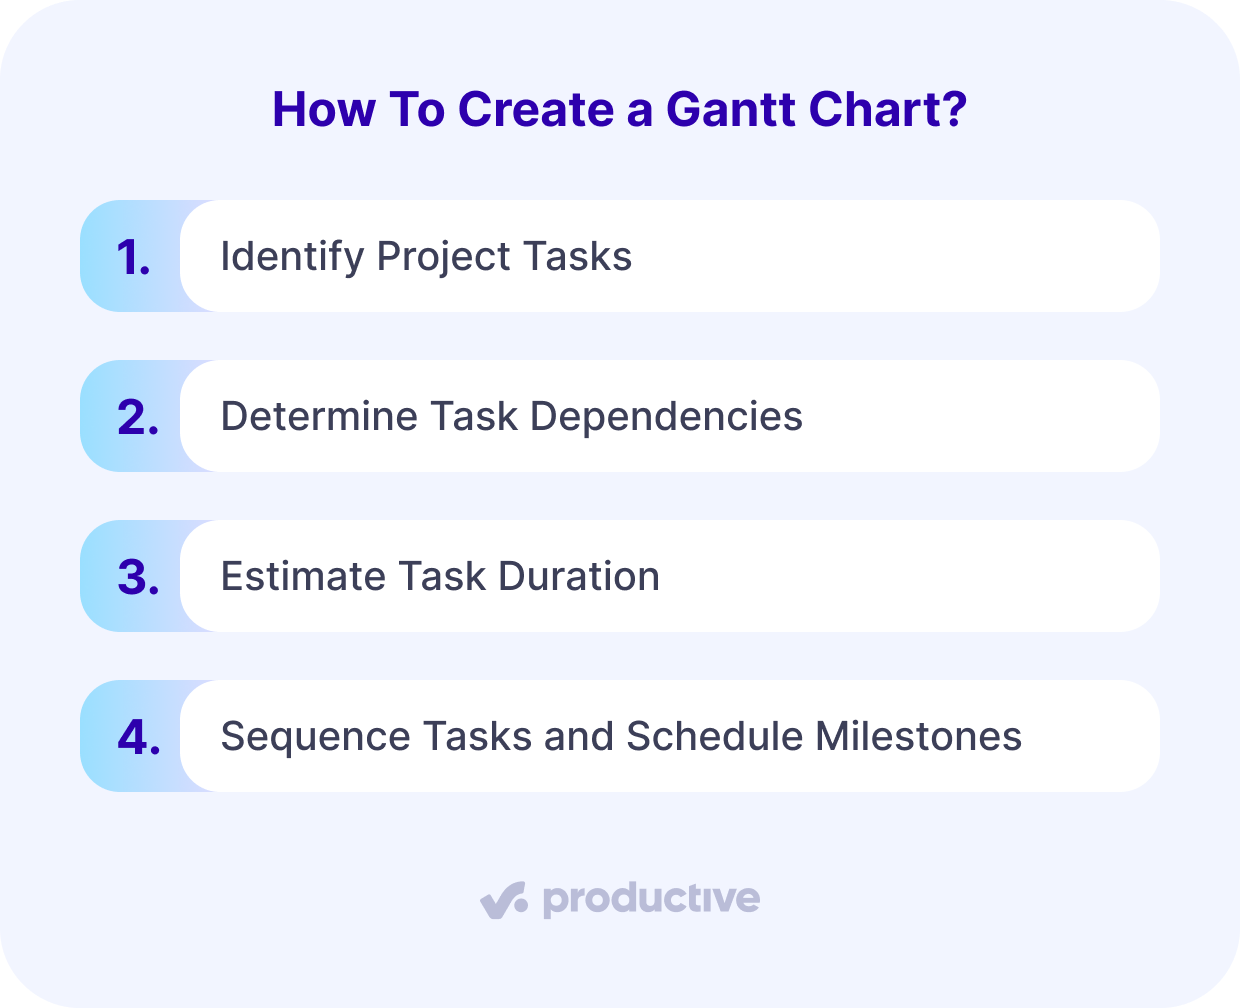
You create a Gantt chart in four steps: identify project tasks, determine task dependencies, estimate task duration, then sequence tasks and schedule milestones.
Step 1: Identify Project Tasks
Building a Gantt chart starts with a complete task list. Break your project into clear, manageable components, taking their interdependencies and resource requirements into account.
Work through these four jobs in order:
- Create a thorough task list through brainstorming sessions with stakeholders.
- Break down complex tasks into smaller, actionable subtasks.
- Establish clear task priorities based on dependencies and critical path analysis.
- Determine resource requirements and constraints for each task.
Be specific and measurable. Every component should contribute directly to a project objective.
Consider both sequential and parallel tasks, but keep a logical flow that reflects your timeline and deliverables.
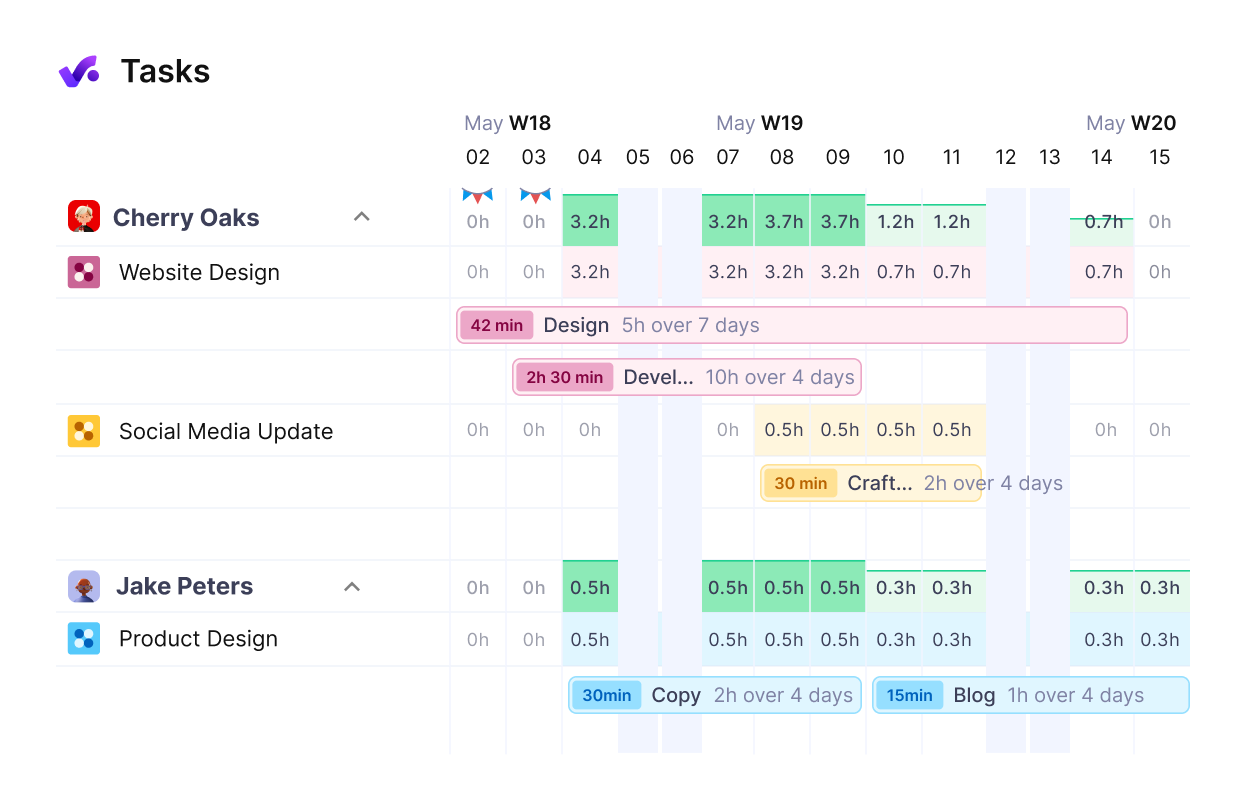
Use Productive to coordinate task progress and team output in real-time.
Step 2: Determine Task Dependencies
Analyze how tasks relate to one another before you set any dates. The goal is a full picture of how project activities interconnect and influence each other.
Identify predecessor and successor tasks. Then establish the relationships through four dependency types: Finish-to-Start, Start-to-Start, Finish-to-Finish, and Start-to-Finish.
PMI’s scheduling best practices put it plainly: “There are four standard types of logic used, with Finish-to-Start being the most prevalent and easiest to understand and use.”Gantt chart software visualizes these connections with linking lines or dependency arrows.
As you map dependencies, remember that a change to any predecessor affects its successors and can move your whole timeline.
Step 3: Estimate Task Duration
Make accurate duration estimates for each activity once dependencies are mapped. Use several estimation techniques, and account for the factors that stretch task completion times.
The best practices for this step are:
- Break down complex tasks into smaller components using bottom-up estimating for project work.
- Analyze historical data from similar projects to establish realistic timeframes.
- Include buffer time for delays and external factors.
- Consult experienced delivery leads to validate your estimates.
Keep your estimates flexible, and document your assumptions so the next project can reuse them.
Step 4: Sequence Tasks and Schedule Milestones
Arrange every activity in your project scope in logical order, based on the dependencies you mapped. This is where developing a Gantt chart turns into a real schedule.
Once the sequence is set, determine realistic timeframes for each task, factoring in resource availability and constraints.
Use your chart tool to place tasks along the timeline, mark dependencies clearly, and set milestones. You now have a high-level view of the project timeline. Keep updating the chart as the project progresses. A plan nobody maintains stops being useful.
How Do Different Roles Use Gantt Charts?
Different roles use Gantt charts for different jobs. Project managers use them to balance workloads and track the plan against actual. Team members use them to see their own deadlines and what their work blocks are.
Everyone can update task progress, flag bottlenecks, and coordinate work that affects other people. Whether you are overseeing a construction project or a software team, the chart is how you maintain transparency and accountability while encouraging people to solve problems together.
What Gantt Charts Do for Project Managers
For a project manager, a Gantt chart simplifies the work of planning resources and managing timelines. An up-to-date chart is where you track connected tasks, identify critical paths, and keep control of project schedules.
Day-to-day, that comes down to four things:
- You can balance team workloads through real-time resource monitoring.
- You can spot bottlenecks and adjust resource assignments before they affect delivery.
- You can track actual against planned completion for better timeline management.
- You can manage risks proactively by visualizing dependent tasks and milestones.
Together, these let you decide from data, use your people well, and give the project a real chance of landing on time.
What Gantt Charts Do for Team Members
For a team member, the chart is a shared view of what is due, what is blocked, and who is waiting on them. You can track dependent tasks, monitor progress, and keep communication in one place instead of chasing colleagues.
Real-time updates and centralized task management coordinate people across departments, for example, product marketing, design, and copywriting, while keeping clear ownership of every task.
Because the chart adapts as things change, you stay aligned with project objectives and timelines.
What Are Gantt Chart Examples?
Gantt chart examples include marketing campaign planning, software development projects, event planning, construction projects, and the product development lifecycle.
Gantt charts show up in almost every industry that runs projects seriously. Here is how each one uses them.
1. Marketing Campaign Planning
A marketing team launching a product runs content creation, social media scheduling, email campaigns, video production, and event planning at once.
A Gantt chart lets the team visualize deadlines and coordinate tasks across departments. It can show that social assets need approval before the campaign goes live, and that the press release must be finished two days before launch.
When to use it: When you need to align cross-functional tasks and get campaign timing right.
2. Software Development Projects
Software teams use Gantt charts to map sprints, development cycles, testing phases, and deployment timelines.
Visualizing dependent tasks, such as finishing backend development before frontend integration, helps the team manage workloads and avoid bottlenecks.
When to use it: When your project includes phased work, multiple teams, and critical dependent tasks.
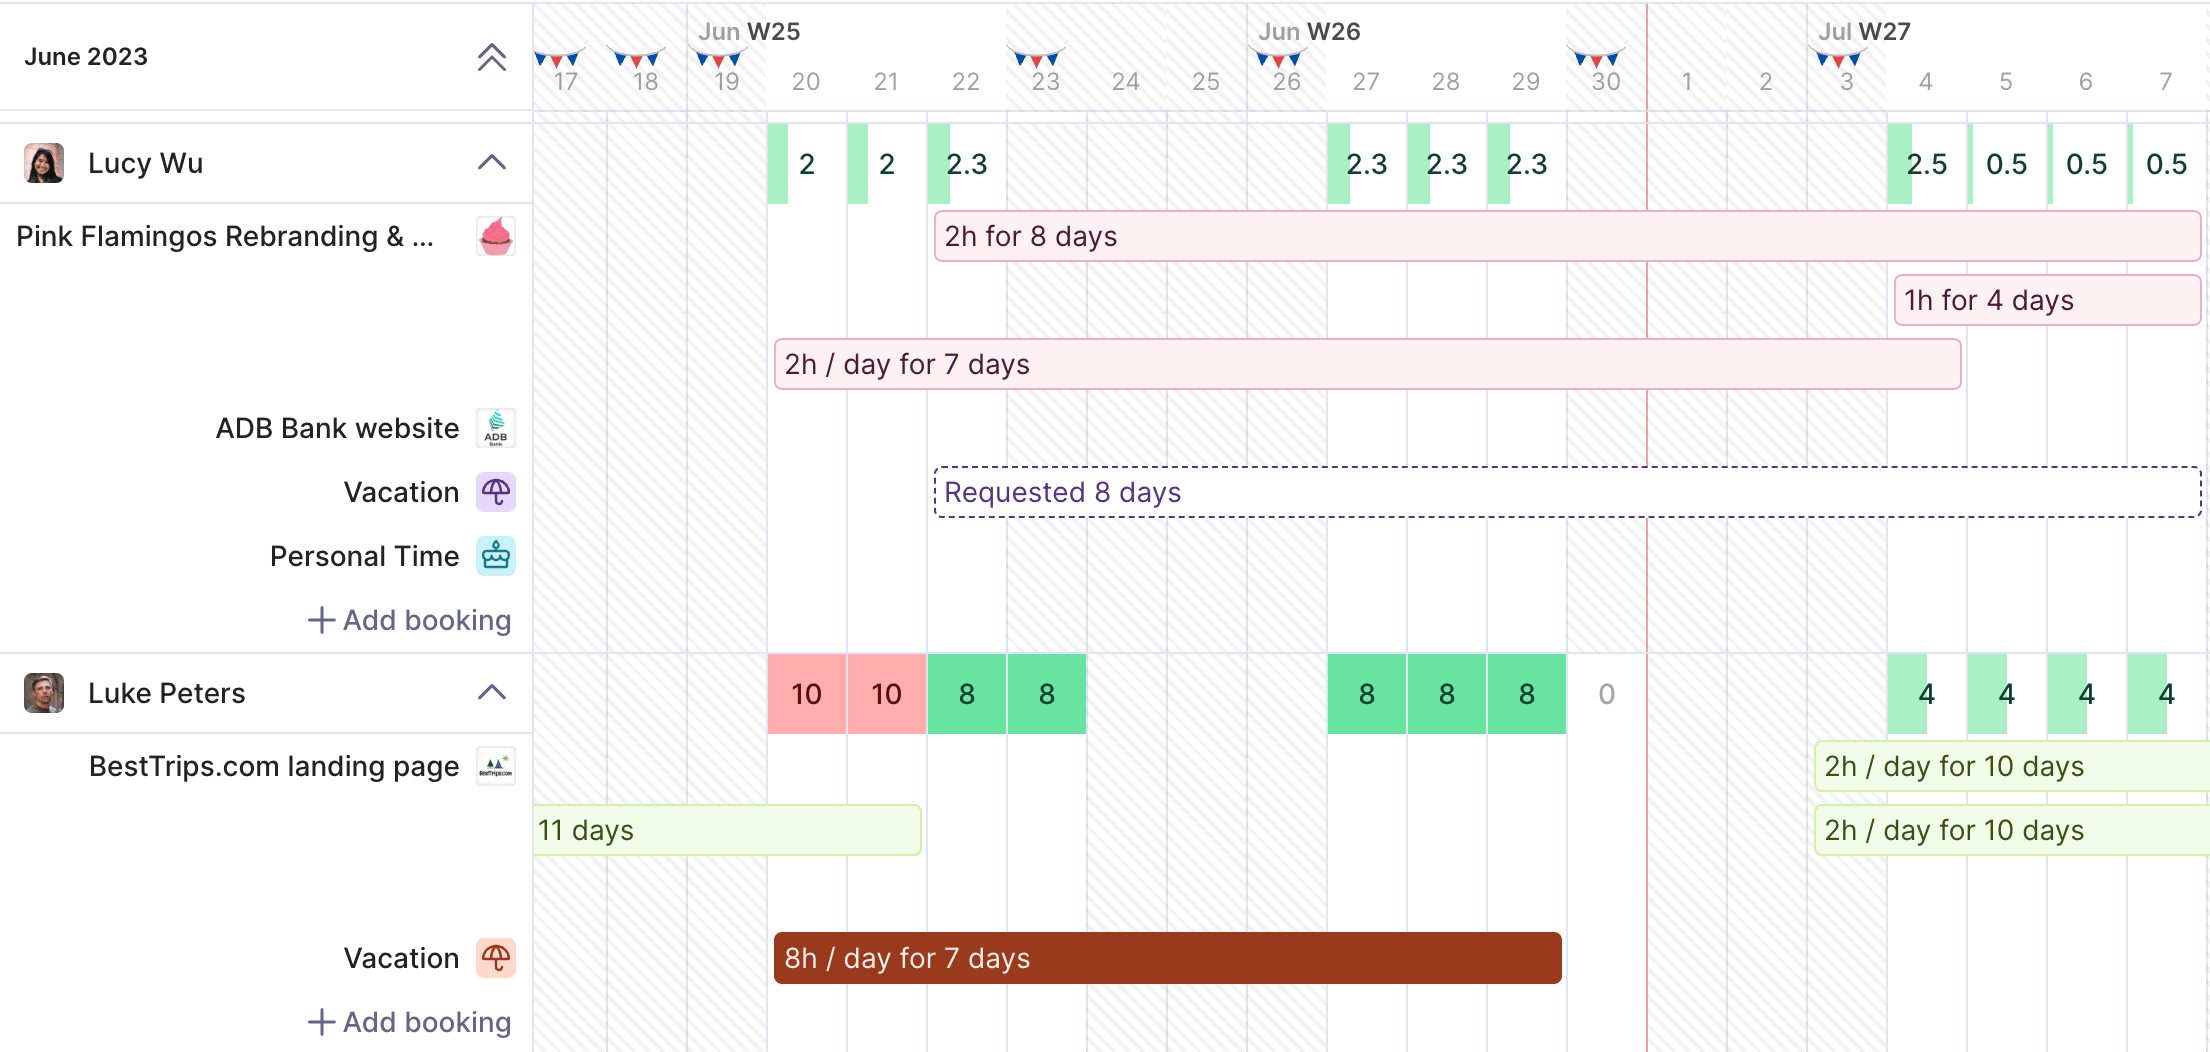
Manage workload allocation and project timelines while easily balancing availability, leave, and task scheduling.
3. Event Planning
Whether you are organizing a conference, webinar, or corporate retreat, a Gantt chart covers venue booking, catering, speaker confirmations, and promotion timelines.
You can see which tasks need to start early, such as sending invitations, and which depend on others, such as finalizing the agenda once all speakers confirm.
When to use it: When every step is deadline-sensitive, and tasks are tightly connected.
4. Construction Projects
In construction, timelines and task sequencing are everything.
A Gantt chart maps the stages: site preparation, foundation work, structural build, interior work, inspections, and handover. It also shows which tasks can run in parallel and which wait on others, which is how you avoid costly delays.
When to use it: When your project involves strict sequencing and heavy coordination between contractors.
5. Product Development Lifecycle
From research and design through prototyping, testing, and launch, a Gantt chart tracks every stage of the development process.
It keeps the design phase finishing before manufacturing starts, and keeps stakeholders aligned on deadlines and dependencies.
When to use it: When managing product roadmaps with overlapping activities and fixed launch dates.
How Do You Present a Gantt Chart to Stakeholders?
You present a Gantt chart to stakeholders by simplifying it down to the elements that affect their decisions: the milestones, the phase gates, and anything that has moved since last time.
A client sponsor wants to know whether the project is on track and what changed. An internal lead wants to know what a slip does to everyone else’s schedule.
Neither of them needs the full task list your delivery team works from.
Here are a few handy presentation tips:
- Show a high-level view filtered to milestones and phase gates, so stakeholders see delivery health without reading every subtask.
- Use color to flag critical-path tasks and slipped dependencies, the ones that actually move the end date.
- Overlay a baseline against the current plan, so you can point to a slip and show exactly what caused it.
- Mark today’s date and each phase sign-off, so everyone can see what is finished and what is still at risk.
The chart answers when. It may not answer how much of the budget a phase has used, or how many hours remain against the estimate.
Those figures live in your reporting, not on the timeline. Productive’s Report Intelligence lets you ask AI for insights in plain language instead of building a report first, so the numbers you put beside the presentation are current.
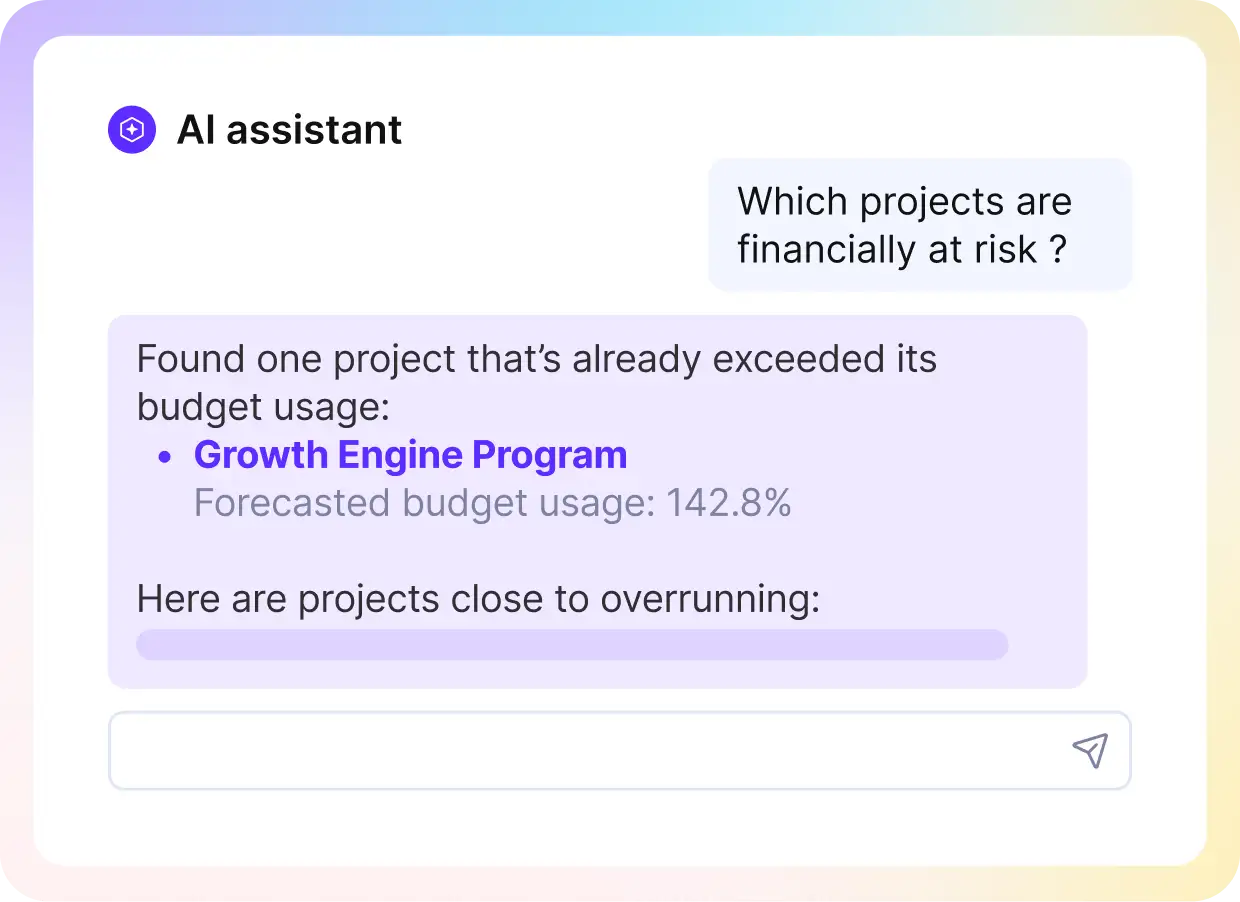
Ask anything about your business data in Productive.
Surface your data with AI in Productive
What Should You Look For in Gantt Chart Software?
You should look for cloud access, real-time collaboration, customizable views, dependency handling, and integrations with the tools you already use.
Here is what each of those buys you:
- Cloud-based access means you can manage projects from anywhere.
- Real-time collaboration keeps the team working from one version of the plan.
- Customizable views adapt the chart to how your projects actually run.
- Dependency handling shifts downstream tasks when something moves.
- Integrations connect the chart to the rest of your stack.
We compare the options in detail in our roundup of the best Gantt chart software tools, from all-in-one platforms built for professional services, like Productive, to dedicated Gantt tools and spreadsheet-style schedulers.
What Are Some Advanced Gantt Chart Techniques?
Advanced Gantt chart techniques are resource leveling, dependency management, baseline tracking, and automated cross-project updates. Each turns a static timeline into a working control for delivery, capacity, and margin. Here is how they work:
- Resource leveling spreads work so nobody hits an over-booked week while a colleague sits idle. When bar overlap shows two client projects needing the same designer, you rebalance before deadlines slip. Firms often tell us this is the visibility that goes first as headcount grows, when nobody can quickly answer who has room for new work.
- Dependency management sequences tasks so a slipped task moves everything downstream automatically. You see the knock-on effect the moment it happens, not at the next status meeting.
- Baseline tracking records the original schedule against actual dates. Without a saved plan, you cannot show a client how and when the project drifted. With one, the gap between planned and actual bars becomes your evidence.
- Automated updates and shared views keep every concurrent engagement current in one place, so a client-facing timeline never contradicts what the team sees internally.
What Are the Limitations of Gantt Charts?
The limitations of Gantt charts are that they get hard to read at scale, carry little information beyond timing, and take real effort to maintain.
In practice, that breaks down into four constraints:
- A detailed Gantt chart becomes overwhelming when you are managing a large project with hundreds of interlinked tasks.
- The format is limited in what it conveys about task priorities, resource requirements, and the skill levels a task needs.
- Visual clarity declines as your project scope expands, and you will likely need other tools to manage resources properly.
- Maintaining and updating the chart is time-consuming without dedicated software, especially in a spreadsheet.
Think about these before you commit to the format.
Build Your Project Timeline in Productive
Gantt charts earn their setup cost when a project has enough dependent tasks that a list cannot show you the sequence. You now know what the chart is made of, how to build one in four steps, where teams use it, and where the format stops helping.
Use project planning software rather than a spreadsheet or a static template. Productive’s Gantt layout puts tasks, milestones, dependencies, and the people booked on them in one view, so the timeline stays current instead of waiting on you.
Book a demo with our team to see it on your own projects.
Plan, Track and Manage Projects in Productive
Switch to Productive’s Gantt chart features and get a high-level overview of tasks, milestones, and resources – all in one platform.

Gantt Chart FAQ
What Is a Gantt Chart Used For?
A Gantt chart is used to plan, schedule, and track tasks across a project.
It gives you a visual project timeline with start and end dates, task durations, dependencies, and overall progress.
How Do You Make a Gantt Chart in Excel?
You make a Gantt chart in Excel by listing your tasks with their start dates and durations. Then you insert a stacked bar chart and format it to read as a timeline.
Excel also ships built-in Gantt chart templates that shortcut the formatting. The trade-off is maintenance, because every change is manual.
What Are the Four Components of a Gantt Chart?
The four main components of a Gantt chart are tasks, task bars, milestones, and resource allocation.
Tasks are the activities you list vertically. Task bars show each activity’s duration horizontally. Milestones mark deadlines and sign-off points. Resource allocation ties each bar to the people booked on it.
What Are the Seven Important Elements of a Gantt Chart?
The seven key elements of a Gantt chart are the task list, time scale, task duration bars, milestones, task dependencies, progress indicators, and assigned resources.
The four components above are the ones you cannot build a chart without. The other three are what make it useful once work is underway.