Best Financial Reporting Software in 2026: 5 Tools Compared

Most financial reporting software lists mix accounting platforms, FP&A tools, and expense trackers into one ranking, but they rarely explain which type you actually need.
And that isn’t really helpful.
To help you out with your tool search, we’ve written this guide that covers the top five tools across five distinct categories, with clear skip signals, key features, user-based pros and cons for each, with bonus comparison tables.
You will also learn how to choose the right tool for your team, and get a step-by-step migration checklist for switching.
What Is the Best Financial Reporting Software in 2026?
The best financial reporting software in 2026 is Productive, Sage Intacct, Datarails, Fathom, and Zoho Books. Instead of mixing categories into one ranking, we mapped one tool per category.
The Best Tools for Creating Financial Reports
Buyer’s Comparison Table
| Tool | Financial Reporting Category | Best For | Who Should Skip | Free Version | What To Track | AI Features | Who Should Use? |
|---|---|---|---|---|---|---|---|
| Productive | Operational PSA | All-in-one for agencies and professional services | Teams that need standalone statutory compliance or have no project-based work | No | Project profitability, planned vs. spent by client, utilization rates | AI Assistant (NL queries, report building), AI Agents (autonomous workflows), AI Reporting | Ops leads and delivery managers at 30 to 500 person agencies |
| Sage Intacct | Cloud Financial Management | Mid-market finance reporting and multi-entity consolidation | Small businesses with single-entity books or no budget for an implementation partner | No | Multi-entity combined financials, departmental P&L, dimensional analysis | Sage Copilot (close management, budget deviation, GL outlier detection, NL queries) | Controllers and finance directors at mid-market orgs, 50 to 1,000 employees |
| Datarails | FP&A Platform | Automated finance reports in Excel | Teams with simple analysis needs or teams that want to leave Excel | No | Budget deviation, combined financial data, rolling forecasts | AI Agents: Reporting, Planning, Strategy, Insights | FP&A managers at mid-market companies using Excel |
| Fathom | Dedicated Reporting and Analysis | Visual, client-ready financial reports | Teams needing advanced forecasting or not using Xero, QuickBooks, or MYOB | No | Management KPIs, liquidity forecasts, entity benchmarking | Commentary Writer (AI-generated financial narrative with source attribution) | Accountants, advisors, and SMB managers needing board-ready deliverables |
| Zoho Books | Cloud Accounting | Free finance reporting for small businesses | Multi-entity orgs or anyone needing advanced forecasting or consolidation | Yes | Core financials and expense tracking | Zia (NL financial queries, transaction anomaly detection, predictive cash flow) | Freelancers and small businesses under $50K revenue |
How We Chose These Tools?
We evaluated these financial reporting software picks on analysis depth, financial data integration, buyer fit, and verified user reviews on G2 and Capterra. Financial reporting tools fall into three categories (explained in full below), and we included one tool from each type so you compare reporting software that matches your actual need.
1. Productive – Best All-in-One for Agencies and Professional Services
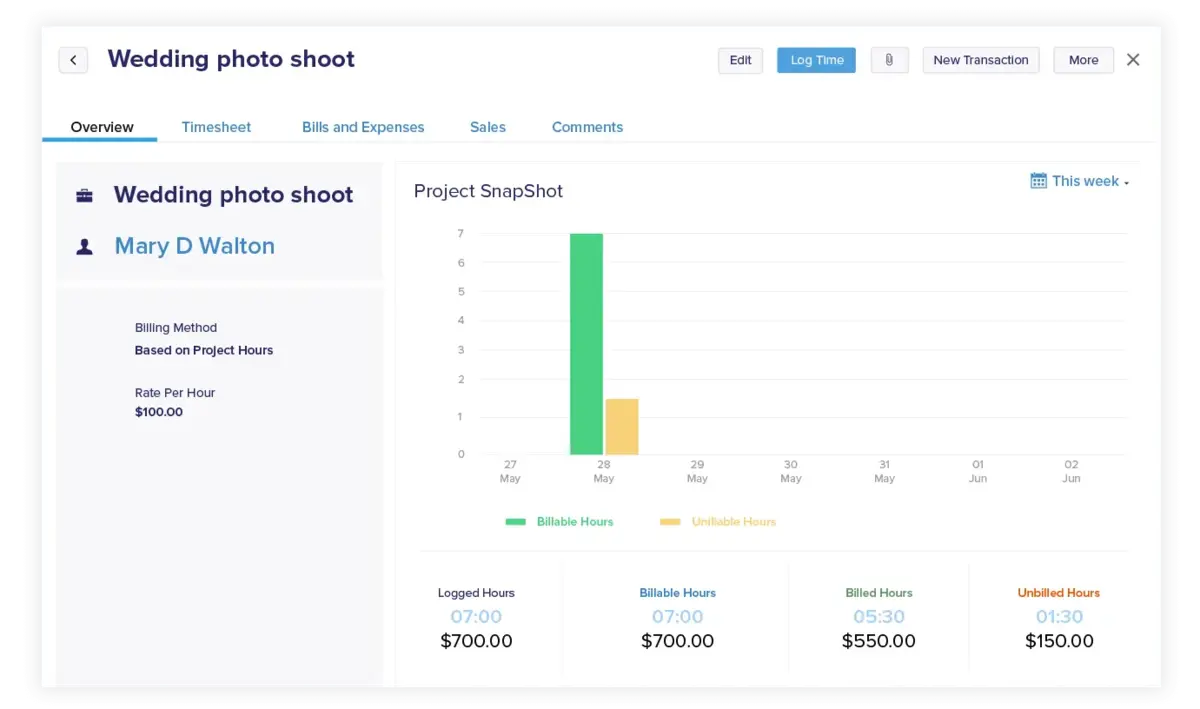
Productive is the smartest choice for agencies and professional services firms. Financial reporting usually breaks when the data behind it is scattered across project tools, time trackers, spreadsheets, and invoicing systems.
Productive is made to solve that big problem. It’s the only financial reporting software on this list that connects delivery, time, budgets, and billing in one system, so the numbers reflect the work as it happens.
Create and manage your finances with Productive
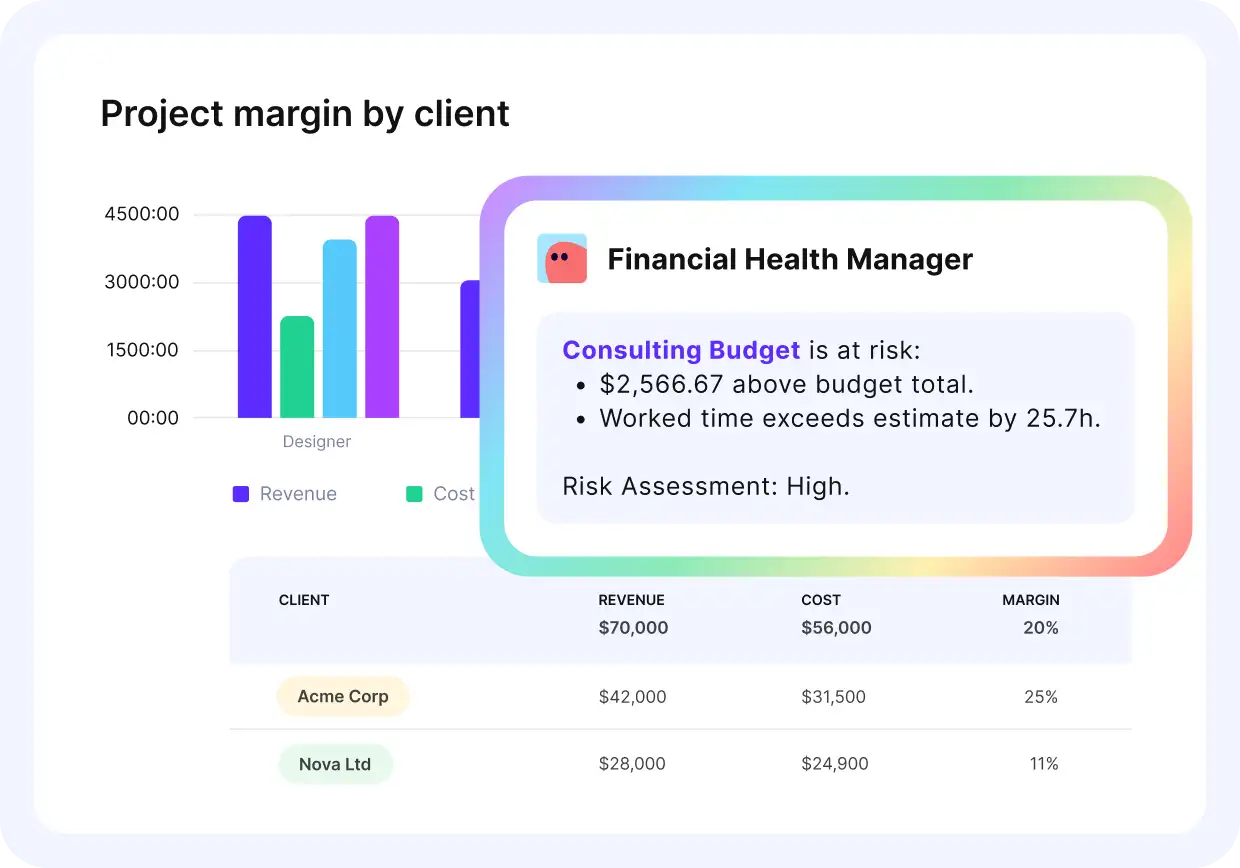
See Profitability Before the Project Ends, Not After
Most teams find out a project went over budget at month-end, when the money is already spent. In Productive, every hour your team logs links directly to a budget, so revenue, costs, and profit update as work happens.
Get early warnings of budget overruns.
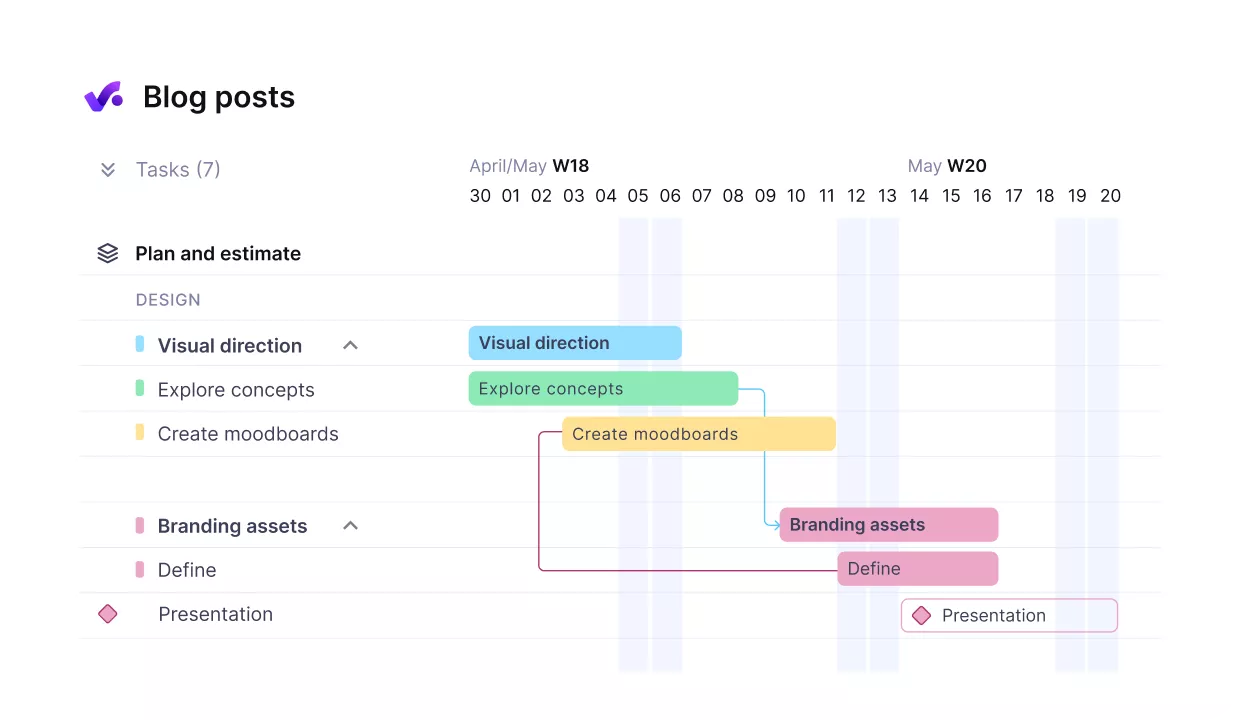
You do not wait for a monthly reporting cycle to check budget vs actual. The numbers are already there. Forecasting charts combine what has been logged with what is scheduled, showing you whether a budget will stay profitable before it runs dry.
Build the Financial View Your Team Actually Needs
A common frustration is that existing tools give you fixed report templates. The moment you need something specific, like profitability by client, by quarter, and by team in one view, you are back in a spreadsheet.
Get instant profitability reports and updates.
Productive’s reports let you group by any dimension: client, project, person, team, or custom field. Combine dimensions with multigrouping, add calculated metrics with formula fields, and automate delivery with Pulse so stakeholders get updates on a schedule.
Forecast Revenue Before the Work Is Confirmed
Agencies often fly blind on future income because revenue only becomes visible once the work is done. Productive’s financial forecasting changes that. It projects revenue and profit based on your current resource scheduling, so you see what is coming before it arrives.
The Scenario Builder takes it further: model different pricing, team allocations, and expense assumptions, then compare the financial data outcomes side by side.
Pipeline forecasting adds deal-stage visibility, and income scheduling spreads revenue across the right periods. Together, these turn financial reporting software into a planning tool, not just a backward-looking ledger.
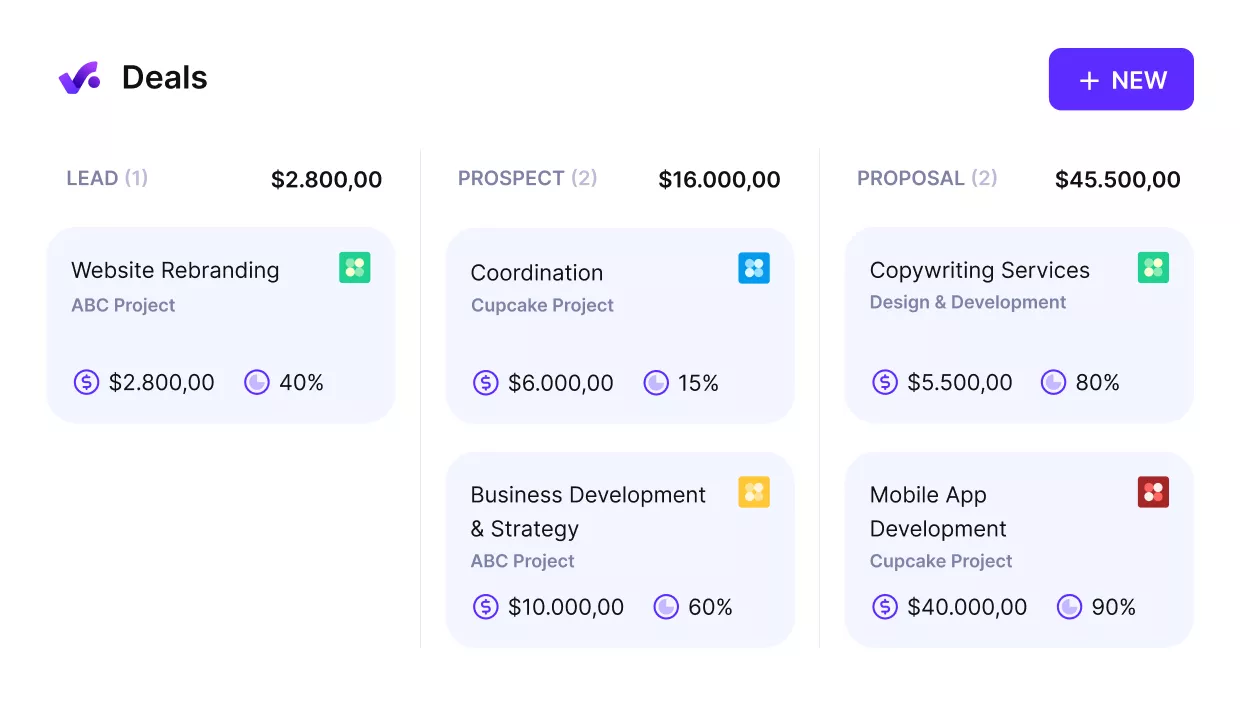
See what deals are in the pipeline and plan your revenue.
Let AI Surface What the Numbers Are Trying to Tell You
Most tools stop at “AI-powered insights” without explaining what that means. Productive’s AI gets specific.
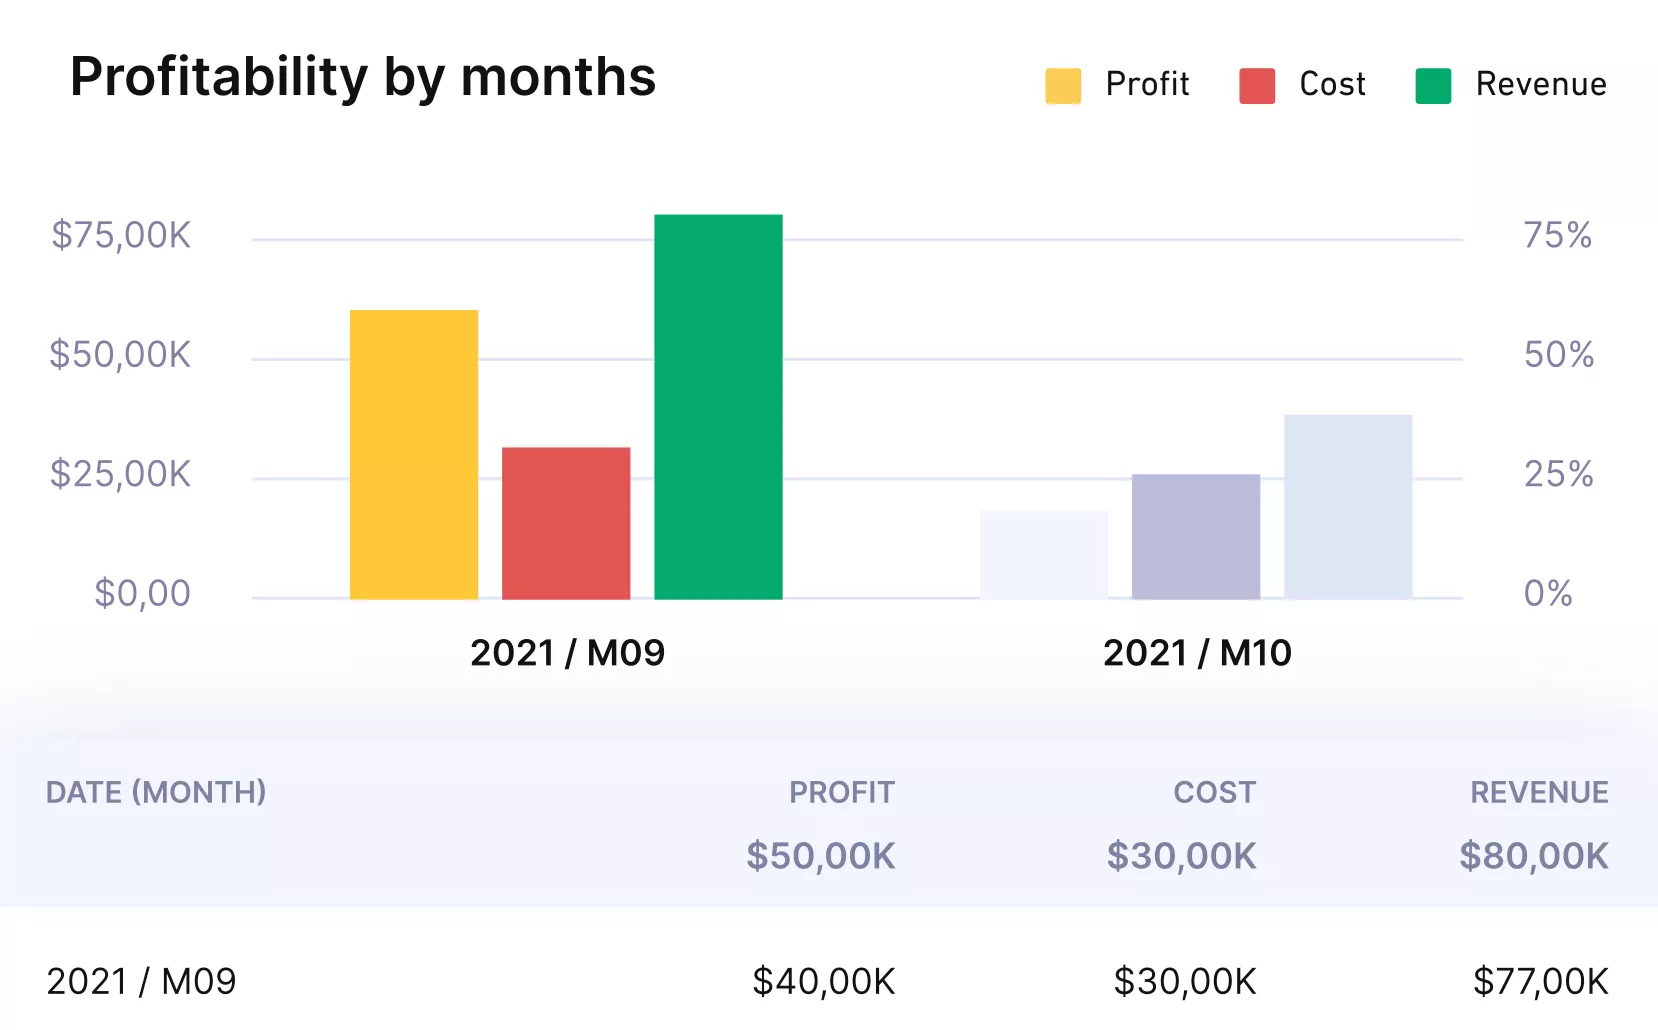
- AI Reporting generates financial insights on revenue, cost, and margins.
- You describe what you want in plain language and refine the output with follow-up questions.
Use Productive’s AI assistants to fetch financial insights.
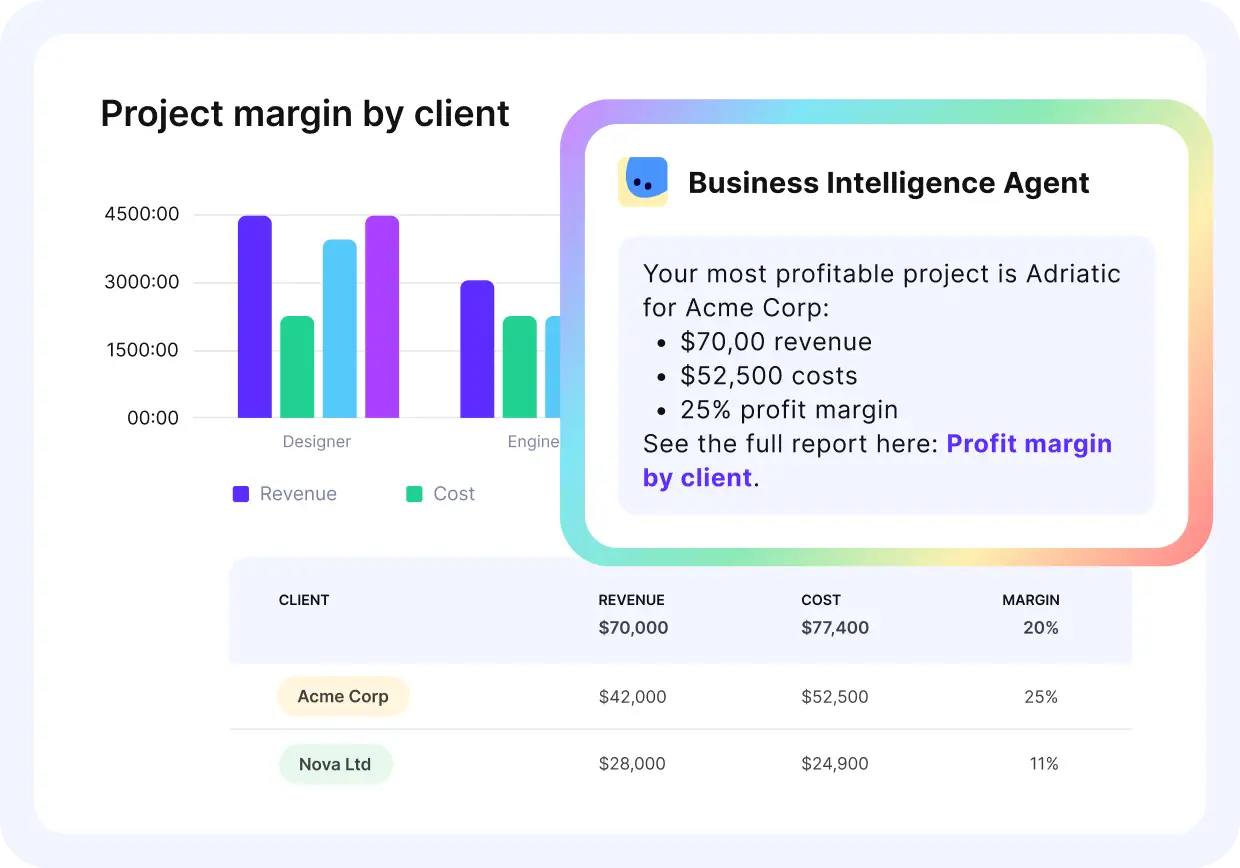
The AI Assistant goes further: it answers questions about your data, generates report links from natural-language prompts, and can create, update, and manage work inside the platform. AI Agents handle the recurring stuff, running workflows on a schedule or in response to triggers.
Unlike the vague “AI-powered” label most reporting software uses, these are named tools you can test in a trial.
Ask our assistants what metrics you need in plain language, and they’ll generate your reports.
Pricing
- Plans start with the Essential plan at $10 per user per month, which includes essential features such as budgeting, project & task management, docs, time tracking, expense management, reporting, and time off management.
- The Professional plan includes custom fields, recurring budgets, advanced reports, billable time approvals, and much more for $25 per user per month.
- The Ultimate plan has everything that the Essential plan and Professional plan offer, along with the HubSpot integration, advanced forecasting, advanced custom fields, overhead calculations, and more. Book a demo or reach out to our team for the monthly price per user.
Productive has a free 14-day free trial, so you can try out what the tool can offer to your professional services firm.
Get Real-Time Financial Reports Without Assembling Data From Multiple Tools
Productive connects project delivery, time tracking, budgets, and invoicing in one platform, so your financial numbers are always current.

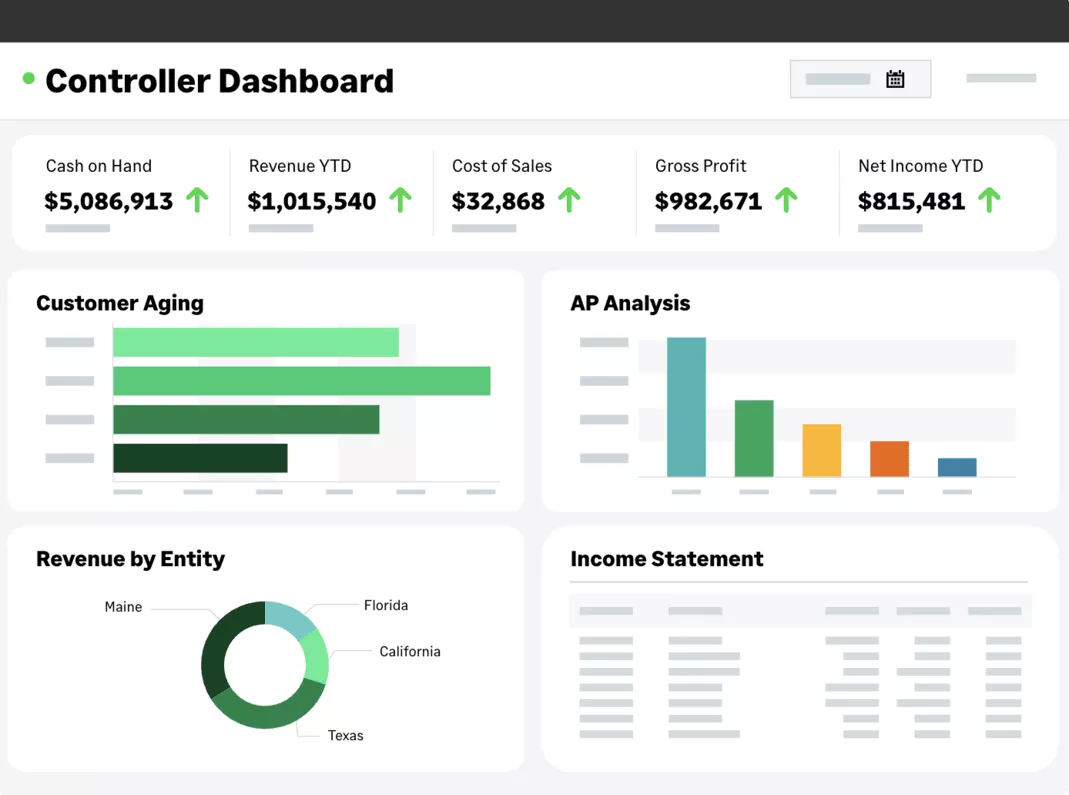
2. Sage Intacct – Best for Mid-Market Finance Reporting and Multi-Entity Consolidation
Sage Intacct is a cloud financial management platform built around a dimensional general ledger. Instead of inflating your chart of accounts, you tag transactions with dimensions and slice financial reporting across any combination.
For a broader look at how revenue ties to operations, see this guide to revenue operations software.
Key Features
- Dimensional general ledger. Report by department, project, location, or customer as dimensions, not separate GL accounts.
- Multi-entity reporting and consolidation. Roll up financial statements across entities with intercompany eliminations and multi-currency translation.
- Live dashboards and custom views. Drag-and-drop report builder with role-based views for each team.
- Audit trail and revenue recognition. Complete transaction history with ASC 606 support, GAAP compliance, and regulatory standards.
SOurce: Sage Intacct
Pros
- Reporting flexibility matches how controllers think. You can answer “profitability by region, by project, by quarter” in a single report without building a custom extract.
- Financial consolidation runs without manual spreadsheet work. Currency conversion, cross-entity adjustments, and roll-ups happen automatically at period close.
- Core navigation is clean for daily accounting. Transaction entry, bank reconciliation, and standard report generation are straightforward for anyone with an accounting background.
- Dimensional tagging prevents chart-of-accounts bloat. You filter and group data at report time instead of creating hundreds of separate accounts for every data slice.
Cons
- Advanced features take weeks to learn. Building custom views, configuring approval chains, and setting up complex allocations require dedicated training beyond the basics.
- The custom report writer is powerful but time-consuming. Standard templates are a solid starting point. Anything beyond them means a steep learning curve with the builder.
- Routine lookups require more clicks than expected. Searching for a specific customer or supplier account takes multiple steps that feel slow in daily use.
- Implementation typically requires a partner. This is not a tool you configure over a weekend. Budget for a partner-led deployment measured in weeks, not days.
Who Should Use Sage Intacct?
Sage Intacct works best for mid-market finance teams (50 to 1,000 employees) that manage multiple entities and need GAAP-compliant dimensional analysis. It is not the right pick for single-entity businesses with simple books or teams that cannot budget for a partner-led implementation.
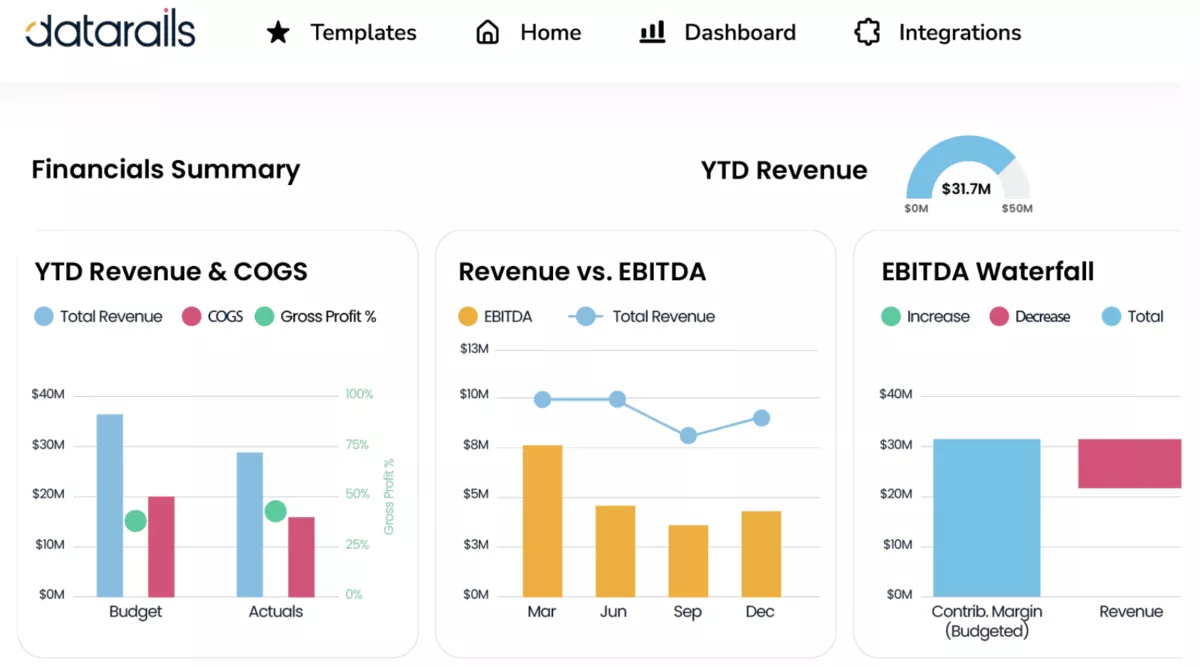
3. Datarails – Best for Automated Finance Reports in Excel
Most mid-market finance teams still handle financials in Excel, and the real pain is not the spreadsheet but the hours lost to manual data consolidation and month-end close refresh cycles.
Datarails automates that workflow from inside your existing Excel workbook, pulling live financial data from 200+ sources into one place.
Key Features
- Excel-native engine. Connects to your workbooks and refreshes output with live data feeds. No migration to a new interface. Also works with Google Sheets.
- Named AI agents. Reporting Agent generates reports on demand. Planning Agent automates budgets and forecasts. Strategy Agent surfaces recommendations. Insights answers plain-language questions about your financial data.
- Automated financial data consolidation. Pulls from multiple entities and systems into a unified dataset, replacing manual copy-paste from five sources. Budget tracking updates in real time.
- Dashboards and storyboards. Visual dashboards for stakeholders who prefer charts over cells, built alongside the spreadsheet layer without a separate BI tool.
SOurce: datarails
Pros
- Your team stays in Excel, so adoption is faster. Nobody has to learn a new interface. Existing models and financial analysis workflows carry over directly.
- Month-end work gets measurably shorter. Teams that used to spend days assembling data describe cutting hours from their close cycle after switching.
- Consolidation removes the manual assembly step. Budgets, forecasts, and actuals from multiple sources land in one standardized format automatically.
- Support is hands-on during setup. The customer success team walks you through data mapping and configuration step by step, which matters because most teams cannot handle initial setup alone.
Cons
- The learning curve is steeper than the “just Excel” pitch suggests. Data mapping, dimension configuration, and financial planning and analysis setup take real time to master.
- Advanced tasks still require support. Resolving data issues or building complex views often means waiting for the customer success team rather than solving it yourself.
- Heavy Excel reliance can become a constraint. Adjustments to underlying data still happen in Excel first. If your goal is to leave spreadsheets behind, Datarails reinforces the dependency.
- Performance dips with large datasets. The Excel add-in can become sluggish with many tabs or complex models. Test refresh times during a trial before committing.
Who Should Use Datarails?
Datarails is for teams that already handle financials in Excel and want to automate consolidation without switching platforms. Look elsewhere if your accounting tool already covers your reporting, if you want off Excel entirely, or if mid-market FP&A pricing is out of range.
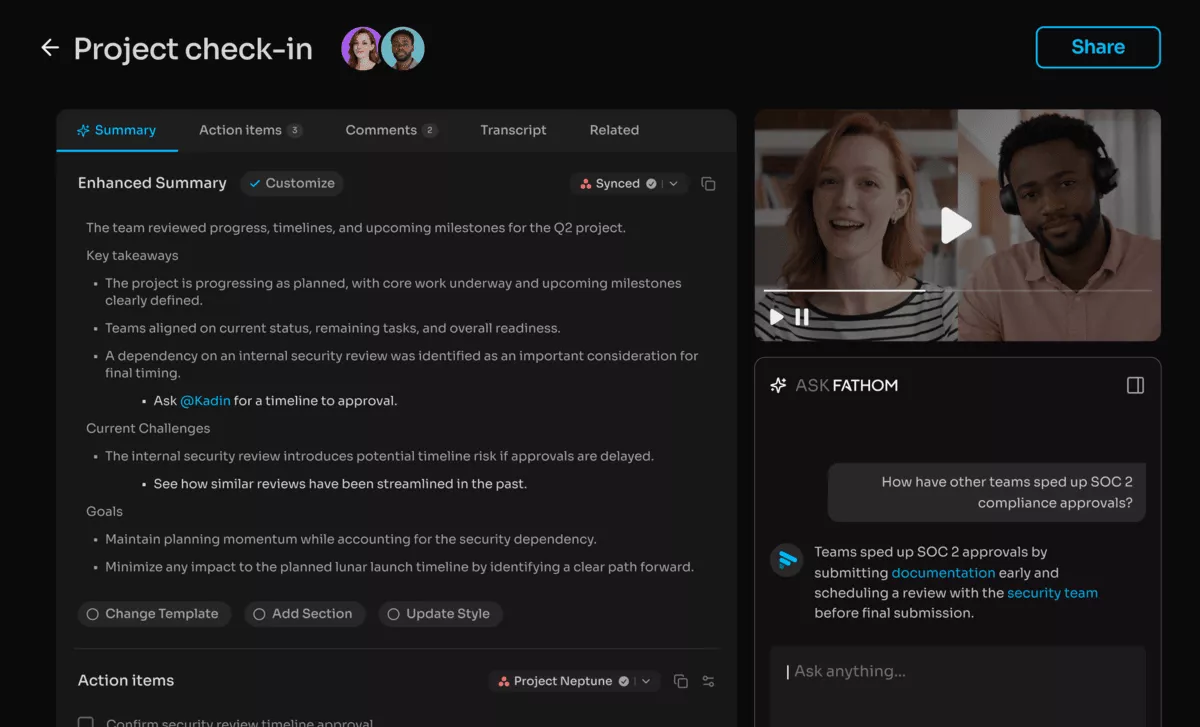
4. Fathom – Best for Visual, Client-Ready Financial Reports
Your accounting tool records the numbers, but when you need to present them to a board, investor, or client, a raw P&L export does not cut it.
Fathom is a dedicated management reporting layer that connects to QuickBooks Online, Xero, or MYOB and turns your accounting data into polished, visual reports. If forecasting is a priority, this comparison of forecasting tools covers what to look for.
Key Features
- Customizable management reports. Build branded deliverables with charts, tables, commentary, and 50+ pre-built KPIs. Reuse templates across clients or entities.
- Three-way cash flow forecasting. Forecast across all three core statements simultaneously with scenario modeling.
- Consolidated reporting. Group related entities for multi-entity roll-ups with automated eliminations and currency support.
- Commentary Writer (AI). Generates narrative financial reporting commentary with full source attribution. Every number traces back to the underlying data.
SOurce: fathom
Pros
- Reports look board-ready without a designer. The visual output is polished enough that accounting firms use Fathom reports as their client deliverable, replacing manually built Excel decks.
- Templates save hundreds of hours across clients. Build a financial statement format once and duplicate it across entities. Firms with dozens of clients describe this as the single biggest time-saver.
- QuickBooks and Xero sync is instant. Connect your accounting platform and Fathom pulls data automatically. No CSV exports, no manual refresh.
- Non-financial audiences can read the output. The visual presentation simplifies complex data for stakeholders who do not have an accounting background, which is the whole point of management visibility.
Cons
- Forecasting struggles with accruals and complex scenarios. Accrual handling, prepaid expenses, and anything that needs to be accrued over time requires workarounds rather than native support.
- Initial account mapping takes real setup time. You need to tag your existing accounts to match Fathom’s account structure before anything useful comes out. Expect the first week to be mostly configuration.
- Subscription pricing feels high for an analysis-only tool. Fathom does not handle bookkeeping, planning, or budgeting. Paying $50 or more per month for a reporting software layer on top of your accounting tool gives some teams pause.
- Integrations are limited to core accounting platforms. Fathom connects to Xero, QuickBooks, MYOB, and Sage. If your data lives in an ERP or a different system, there is no direct connection.
Who Should Use Fathom?
If you need board-ready or client-ready reports from your existing Xero, QuickBooks, or MYOB data, Fathom should get you there. It is not built for teams that need advanced forecasting with custom drivers or connections beyond those three accounting platforms.
5. Zoho Books – Best Free Finance Reporting Tool for Small Businesses
Not every business needs financial reporting software that costs thousands per month. Zoho Books is a cloud accounting software platform with a genuinely free plan that includes P&L and 25+ additional financial views at no cost for businesses under $50K annual revenue.
Key Features
- Free plan with real financial reporting. P&L and accounts receivable aging statements included. No credit card required, free forever under the revenue cap.
- Invoicing and expense tracking. Up to 1,000 invoices per year on the free plan, plus expense tracking, bank reconciliation, and recurring billing.
- Zoho ecosystem integration. Connects natively to Zoho CRM, Zoho Analytics, and Zoho Inventory. Third-party connections include Stripe and PayPal.
- Multi-currency and tax compliance. Handles multi-currency transactions, automated tax calculations, and 1099 filing for US businesses.
SOurce: zoho books
Pros
- The free plan is genuinely functional, not a teaser. You get real financial reports, invoicing, and expense tracking without paying anything. That is rare among accounting tools and unheard of among dedicated finance tools.
- Setup takes minutes, not days. The interface is clean enough that non-accountants can start using it without training or a consultant. Most teams are operational within a single session.
- Invoicing automation cuts recurring admin. Set up recurring billing once and Zoho handles the rest. For small businesses that invoice the same clients monthly, this removes a repetitive task entirely.
- The Zoho ecosystem compounds the value. If you also use Zoho CRM or Zoho Inventory, data flows between apps automatically. An invoice created in Books shows up in CRM without re-entry.
Cons
- Report customization is limited compared to QuickBooks Online. The built-in templates cover the basics well, but advanced filtering and custom grouping options are shallow. If you need more depth, this overview of reporting tools covers options across categories.
- Customer support is inconsistent. Response times vary. Some teams describe quick, helpful answers. Others report slow follow-ups and unresolved tickets that drag on for weeks.
- No multi-entity consolidation. Zoho Books is single-entity only. If you manage multiple businesses or subsidiaries, you cannot roll up financials across them.
- The free plan ceiling arrives fast. One user, manual bank imports, and a $50K revenue cap. Most growing businesses will outgrow it within a year and face a paid upgrade.
Who Should Use Zoho Books?
Zoho Books is a good choice for freelancers and small businesses under $50K revenue that need financial reporting and invoicing at no cost. Once you outgrow the free plan (one user, manual bank imports, no consolidation), Productive, QuickBooks Online or Xero are the natural next step.
What Are the Three Types of Financial Reporting Software?
The three types of financial reporting software are accounting platforms with built-in reporting, FP&A and dedicated reporting platforms, and operational platforms with financial reporting.
Which type you need depends on where your data lives and what your numbers need to show.
Type 1: Accounting Platforms with Built-in Reporting
If you use QuickBooks, Xero, or Zoho Books, you already have financial reporting software. These tools record transactions and generate standard financial reports (P&L and balance sheet) as a byproduct of your bookkeeping. Choose this type if your reporting requirements start and end with standard statements from your GL system. There is nothing to add on top.
Type 2: FP&A and Dedicated Reporting Platforms
Clean books are a starting point, not the finish line. FP&A platforms like Datarails and Fathom sit on top of your accounting data. They pull numbers from your GL, ERP systems, or spreadsheets.
Then they add financial planning and analysis: data consolidation, forecasting, and visual analysis. Choose this type when you need consolidated financial views or board-ready output your accounting tool cannot produce.
Type 3: Operational Platforms with Financial Reporting
When the problem is not the report but the scattered data behind it, this is the category to look at. Operational platforms like Productive and NetSuite tie financial reporting to the same system that manages delivery, time, budgets, and billing.
The numbers are accurate because the source data lives in one place. This type fits service businesses where profitability ties directly to project delivery.
| Type | What It Does | Best For | Example Tools |
|---|---|---|---|
| Accounting platform | Turns bookkeeping data into financial output | Small businesses with standard financial needs | QuickBooks, Xero, Zoho Books |
| FP&A / dedicated reporting | Adds analysis, consolidation, and forecasting on top of accounting data | Finance teams needing deeper analysis | Datarails, Fathom, Vena, Cube |
| Operational platform | Produces financial output from the system that runs delivery, time, and budgets | Service businesses tied to project profitability | Productive, NetSuite |
What Are the Key Features of Financial Reporting Tools?
The key features of financial reporting tools are statement generation, multi-entity consolidation, data integration, custom reporting, live dashboards, change tracking, budget tracking, and AI.
The table below breaks down each feature, what it does, who needs it, and what to ask a vendor during a demo. In case budget tracking is central to your team’s workflow, this guide to project budget management explains the fundamentals your tool should support.
| Feature | What It Does | Who Needs This | Question to Ask the Vendor |
|---|---|---|---|
| Financial statement generation | Produces GAAP/IFRS-compliant financial statements: P&L, balance sheet, and cash flow statements | Any business that needs compliant reporting for auditors, investors, or regulators | Can I run multi-period comparatives and export them in one click? |
| Multi-entity consolidation | Rolls up financials across business units with cross-entity adjustments and currency translation | Organizations with multiple subsidiaries, branches, or locations | How many entities can I consolidate, and is the process automated? |
| Financial data integration | Connects to your ERP, GL, CRM, payroll, and banking systems for live analysis | Teams pulling financial data from three or more systems today | Does the tool sync live, or do I import CSV files every month? |
| Custom report builder | Goes beyond standard templates with flexible filters, grouping, and dimensions | Finance teams with non-standard reporting needs that templates do not cover | Can a non-technical user build a custom report without admin access? |
| Real-time dashboards | Auto-refreshing dashboards with role-based views for different teams | Ops leads and executives who need live visibility, not monthly snapshots | Do dashboards update automatically, or do I trigger a manual refresh? |
| Change tracking and regulatory compliance | Tracks every change with version control, approval workflows, and Data Validation | Regulated industries or any business preparing for external audits | Can I generate an audit-ready export for external auditors in one step? |
| Budget vs actual reporting | Compares planned budgets against actuals with variance analysis at the project, department, or entity level | Project-based businesses and any team tracking delivery against a budget | Can I drill from a variance down to the transaction that caused it? |
| AI and Machine Learning | Depends on the tool: anomaly detection, predictive forecasting, narrative commentary, or natural language querying | Teams with high data volume looking to surface patterns and exceptions faster | What exactly does the AI do? Show me a live example with my data. |
How to Choose the Right Reporting Platform for Your Team
To choose the right reporting platform, map every system your financial data touches, match your needs to a tool category, check integrations, and test with real close data.
Below we’ve covered the five key steps that get you there.
Step 1: Map Where Your Financial Data Lives Today
List every system your team touches to produce a financial report: your accounting platform, spreadsheets, time tracking, project tools, CRM, invoicing. If data lives in three or more systems, your reporting process has a source problem, not a tool problem.
A new platform will just visualize fragmented data faster.
Step 2: Match Your Reporting Needs to a Tool Category
Identify who reads your reports, how often, and what depth they need. Then use the three-type framework from the previous section.
- If your accounting tool covers your reporting, stop there.
- If you need consolidated views, forecasting, or variance analysis, you need an FP&A layer.
- If your numbers depend on project delivery data and billing from the same financial reporting system, you need an operational platform.
For project-based teams, this guide to project financial management can help you map where your setup falls short.
Step 3: Check Integration Compatibility
Confirm the tool connects to what you already use. Ask the vendor: does it sync live with my ERP or GL, or do I import CSV files? QuickBooks, Xero, and the major ERPs are the most common integration points. No connection means wrong tool.
Step 4: Evaluate Implementation Timeline and Total Cost
Some tools connect in days (Fathom, Zoho Books). Others take weeks with a partner (Sage Intacct, Datarails). Add setup, training, and parallel-run time to the license fee. The sticker price is never the full cost.
Step 5. Run a Proof of Concept with Real Data
Test with your most recent close data, not sample data. Reproduce your three most-used reports in the new tool. If you cannot get a usable result in the first week, the tool is probably too complex for your team.
How to Roll Out Financial Reporting Software?
You should roll out financial reporting software by auditing your current reporting process, migrating one report first, running systems in parallel, training your team, and setting a hard cutover date.
Before You Switch
Document your current workflow first. List every report, its data source, and how long the assembly takes. Include expense workflows in your audit. If your team tracks project costs separately, this guide to project expense tracking covers what to account for.
This is your baseline.
Then migrate one report, not all of them. Pick the most painful one, rebuild it in the new tool, and prove it works before expanding.
During the Rollout
Run both systems in parallel for one close cycle. Produce the same reports from old and new, then reconcile. Train report builders in a dedicated session with hands-on practice. Dashboard readers need a 15-minute walkthrough, not a full course.
Set a cutover date and hold it. Without a deadline, parallel running drifts for months.
Migration Checklist
Use this checklist to plan your migration from start to cutover.
- Export your account structure, GL data, and historical output from the old system
- Map old account structures to the new tool’s dimensions or categories
- Confirm integrations with your ERP, payroll, CRM, and banking are connected and syncing
- Migrate open invoices, outstanding balances, and active budget data
- Recreate your top 3 to 5 most-used financial views in the new tool
- Run a parallel close cycle and reconcile outputs between old and new
- Set up user permissions and role-based access
- Train report builders and walk dashboard consumers through their views
- Set a hard cutover date and communicate it to all stakeholders
- Archive the old system’s data and decommission logins
Final Thoughts
The real problem with financial reporting is rarely the report. It is the fragmented data underneath it.
The right tool fixes the source, not just the output. If your reports break because work, time, and money live in different systems, an all-in-one platform like Productive is worth a closer look.
Get started today and book a short 30-min demo.
Connect With Agency Peers
Access agency-related Slack channels, exchange business insights, and join in on members-only live sessions.
