Project Burn Rate: Definition, Formula, and How to Calculate It

Your fixed-fee project spends its budget every week, and you can’t tell if it will last. Project burn rate is how much budget you spend per week, compared with what your plan allows.
In this article, you’ll get why it matters, the formula with a worked example, and how to read it. You’ll also see why margin can drop, which charts to use, and the habits and tools that help.
Key Takeaways
- Burn rate on a client project is the pace at which it uses its budget: You measure it in hours or money per week or month, against the pace your project plan allows.
- The burn is calculated as budget used divided by time elapsed: Budget used is logged billable hours times the service’s price, plus billable expenses.
- Telling if the burn is on track means comparing it with percent complete: Spend that runs ahead of finished work is a real overrun, while spend that matches progress is on plan.
- A project can stay on budget and still lose margin: The budget counts hours at the client’s price, so a costlier person cuts your margin without moving it.
What Is Project Burn Rate?
Project burn rate is the pace at which a client project uses its budget, per week or month. Compare it with the pace your project plan allows to see if the budget will last.
Budget burn rate is another name for the same measure. The types of burn rate differ by unit, and the split here is our own. In hours, it’s hours logged against hours sold, as on a retainer. In money, it’s either billable value, what the client pays, or cost, what the hours cost you.
Cash burn rate, a company finance term, is different: it tracks how fast a whole company uses its cash. Per CFI’s corporate finance definitions, gross burn rate is a company’s operating expenses. Net burn rate is the rate at which it loses money.
Project burn, by contrast, tracks one client project, not the company’s cash. Why that pace matters comes down to when you find an overrun.
Why Does Burn Rate Matter?
Burn rate matters because it can show a budget overrun while you can still change scope, not at invoicing. On a fixed fee, every hour past the estimate comes out of your margin.
In week four of 12, you can still trade a deliverable, reassign work, or write a change order. At the final invoice, the hours are spent, and the fee is set, leaving far fewer options.
That early warning exists only if someone tracks the budget, and not every team does. PMI’s Pulse of the Profession 2025 report surveyed almost 3,000 project managers and senior leaders. Of those with high business acumen, 77% use adherence to budget to measure project performance. Among everyone else, 57% do.
On a retainer, monthly burn rate can show hours running out mid-month. You can then agree with the client what drops before work stops. Our guide to retainer billing models covers whether unused hours roll over or expire.
Spotting either pace starts with the formula.
How Do You Calculate Burn Rate?
You calculate burn rate by dividing budget used by the time elapsed. The formula for determining burn rate is:
Burn rate = budget used ÷ time elapsed
Then compare it with planned burn. The steps are our own breakdown. Let’s look at each.
Step 1: Calculate Actual Burn Rate From Budget Used
Calculating actual burn rate means dividing budget used by the weeks elapsed. Budget used is logged billable hours times the service’s hourly price, plus billable expenses.
Take an illustrative 12-week, $60,000 fixed-fee website project, sold as 600 hours at $100 an hour. By week six, the team has logged 380 billable hours, so budget used is $38,000:
$38,000 ÷ 6 weeks = about $6,333 a week
The step is done when each week shows budget used and actual burn.
Step 2: Compare Actual Burn With Planned Burn
Comparing actual burn with planned burn means checking it against the total budget divided by the project’s length:
$60,000 ÷ 12 weeks = $5,000 a week
The project burns about $1,333 a week over plan, using 63% of the budget at half the schedule. At that pace, the projection for week 12 is $76,000, or 160 hours the $60,000 fee won’t pay for. The step is done when each week shows actual and planned burn.
In Productive, you don’t add up budget used by hand. A budget’s overview totals billable time and expenses as your team logs them, so you can see what’s left of each budget at a glance.
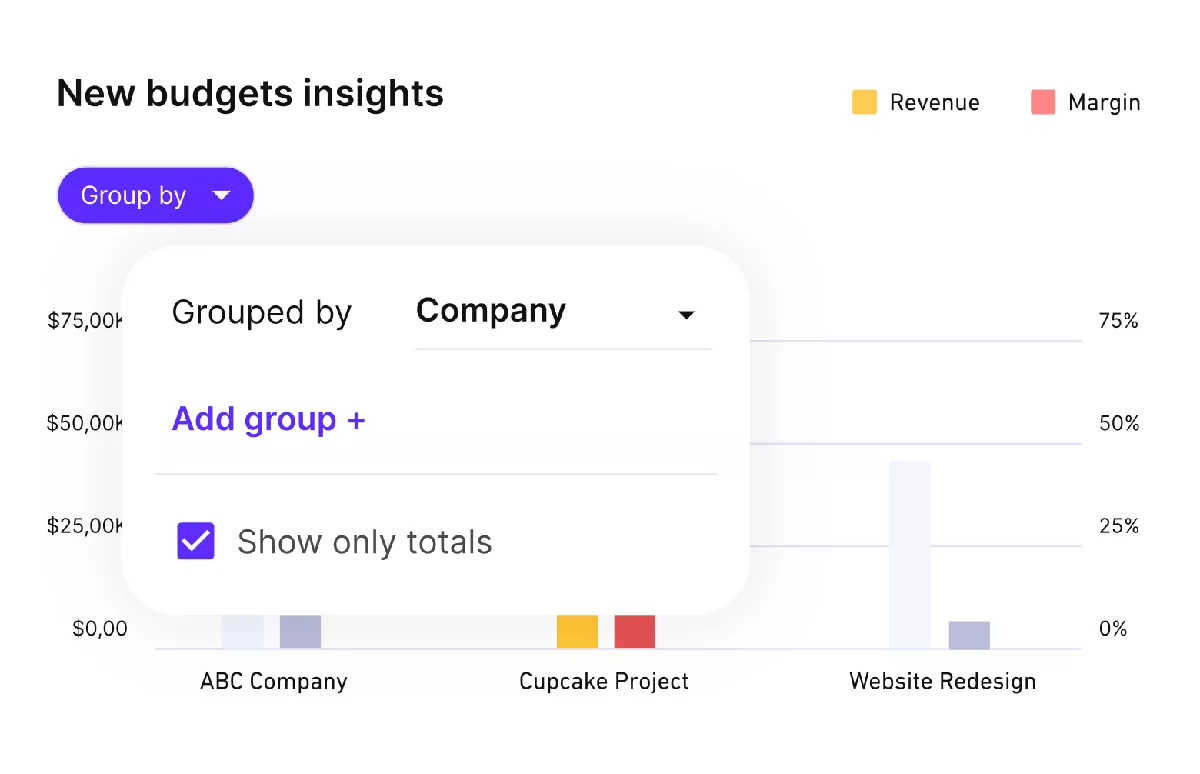
Watch the remaining budget update as time is logged in Productive’s budget overview.
There’s no single burn-rate figure, but the forecasting charts plot budget used week by week, so you can see the pace.

Integrated budget control is a major differentiator—tracked time is automatically reflected in budget consumption, so project profitability is visible in real time.
Read the full customer story to see how DonQ keeps full operational control with Productive.
Those totals still don’t say whether the project is behind.
How Do You Tell if Your Burn Rate Is on Track?
You tell if your burn rate is on track by comparing budget used with work finished, both as percentages. Spending half the budget is fine when half the work is done. It’s a problem when only a third is done.
At week six, the website project has used $38,000, or 63% of its budget. Only 40% of the work is finished, which is worth $24,000 of the fee. That figure is called earned value: total budget times percent complete.
The $14,000 gap is 140 hours spent beyond what the finished work was priced at. Our guide on how to calculate cost variance runs the same comparison with your costs instead of the fee.
Count percent complete by finished deliverables, not hours logged, since hours are what burn already counts. A homepage design counts once the client approves it.
Three readings follow from the gap between budget used and percent complete:
- On track: budget used within 10 points of percent complete. Keep the weekly check.
- Fast burn: budget used more than 10 points ahead. Take corrective action: restaff, trim scope, or start the change-order talk.
- Slow burn: budget used more than 10 points behind. Check next week’s bookings for understaffing.
The readings and the 10-point band are our own example, so set your band by project size and risk. Our guide to preventing cost overruns lists burn outpacing progress among the signs to watch for.
Budget used also leaves out what the hours cost you.
Why Can a Project Stay on Budget and Still Lose Margin?
A project can stay on budget and still lose margin because the budget counts hours at the client’s price. It doesn’t show what each person costs you.
Say a $50-an-hour designer is swapped for a $90-an-hour art director for one 20-hour week. Those are their costs to you. The service is still priced at $100 an hour, so the budget used is $2,000 either way.
Your cost rises from $1,000 to $1,800, so your margin on that week drops from $1,000 to $200.
So next to budget used, track cost burn: the same hours priced at what each person costs you. Check both every week.
In Productive, a budget’s forecast chart combines past data, including logged time, with future bookings from the Resource Planner.
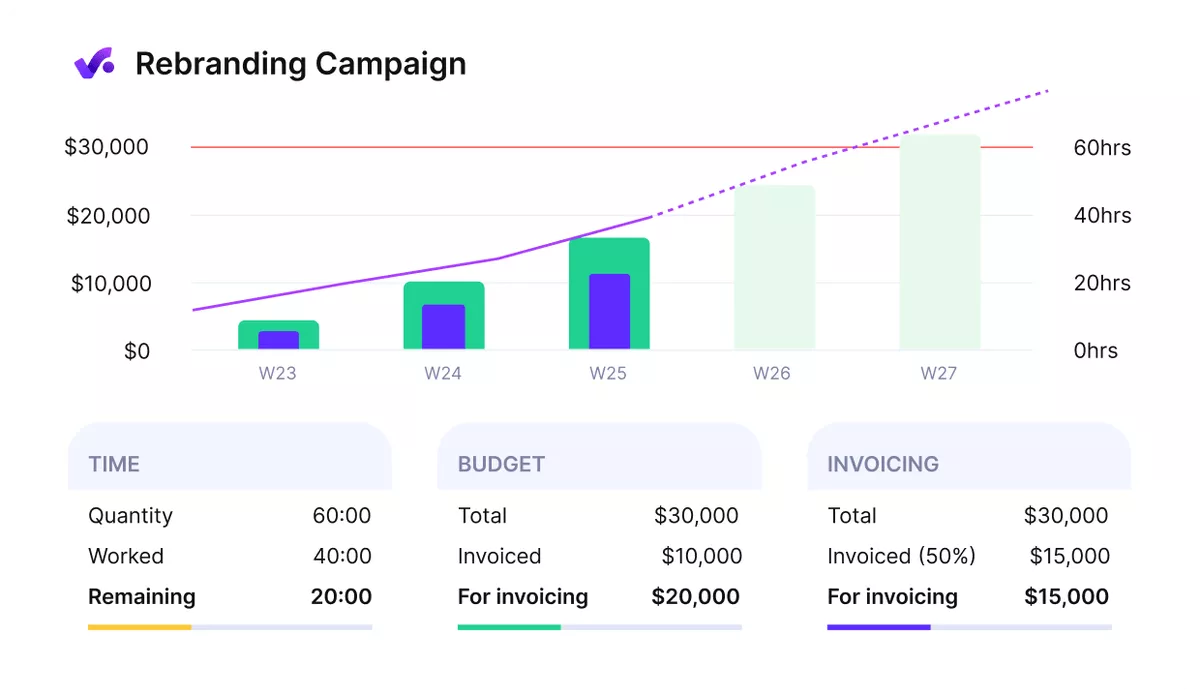
See projected budget use in Productive’s budget forecast chart.
It can show when budget used is projected to reach or exceed the budget total. It can also show whether the work is expected to stay profitable as the budget is used up. That way, you can catch a project drifting over budget while there’s still time to act.
Forecast profit from scheduled work
Charts then show the burn week by week.
What’s the Difference Between a Burn Rate Chart, a Burndown, and a Burn-Up Chart?
The difference is what each one plots. A burn rate chart plots spend over time against a plan line. A burndown plots budget or work remaining, and a burn-up plots completed work against total scope.
Each chart answers a different question:
| Chart | What it plots by week | Question it answers | Use it when |
|---|---|---|---|
| Burn rate chart | Budget used against the plan line | Are we spending faster than planned? | You review fixed-fee or retainer budgets weekly |
| Burndown | Budget or work left | Will we run out before the end date? | Scope is agreed and not expected to grow |
| Burn-up | Work done, plus a total-scope line | How far along are we, and has scope grown? | The client keeps adding requests |
At week six, the website project’s burndown shows $22,000 left for six more weeks. The burn-up shows 40% built, and its scope line rises when the client adds a request.
A burndown shows only what’s left. It can’t show whether the client added work or the team slowed down. We recommend reviewing the burn rate chart weekly on fixed-fee and retainer work, plus a burn-up when scope moves.
A chart covers one project, while a weekly review covers them all.
How Do You Keep Project Burn in Check Each Week?
You keep project burn in check with a weekly review against bookings and alert points agreed at kickoff. Both are our recommendation. We’ll take a closer look at each.
Review Last Week’s Burn Against Next Week’s Bookings
Reviewing last week’s burn against next week’s bookings means checking what was spent and what is already scheduled. The project manager brings budget used per project and next week’s booked hours per person.
The website project burns about $6,333 a week against a $5,000 plan. Rebooking the same hours repeats that overrun. The review ends with one staffing or scope decision per fast-burning project, with an owner and a date.
Set Alert Points Before the Budget Runs Out
Setting alert points means agreeing at kickoff which share of budget used triggers a conversation.
We recommend two. At 50% used, the project manager compares budget used with percent complete. At 90%, the account lead raises any unfinished scope with the client before the fee runs out.
In Productive, you can set up an AI agent that watches project budgets. When spending crosses a threshold you define, it comments on the budget, tagging the budget owner and project manager.
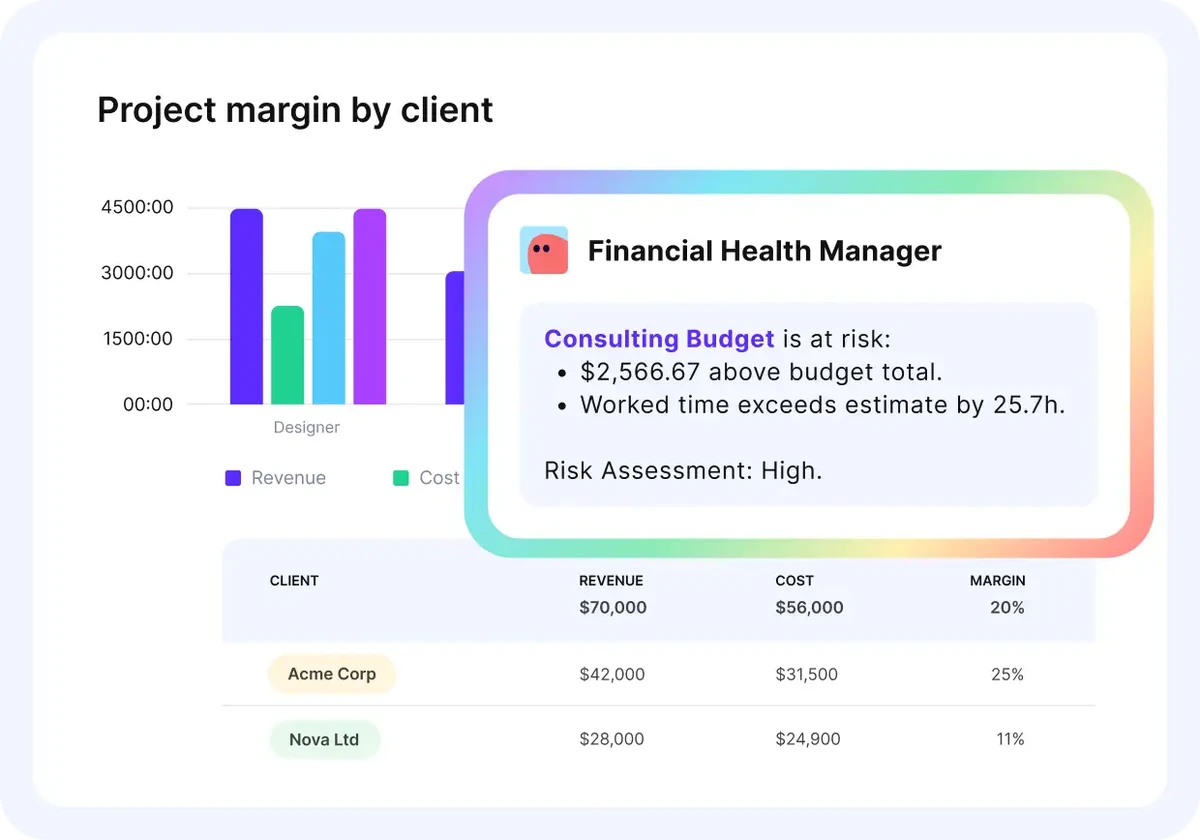
Get a comment on the budget when spending crosses your threshold with an AI agent in Productive.
If you’re comparing budget tools, see our list of the top project budget management tools.
Both habits depend on hours reaching your numbers on time.
How Does Software Help Track Project Burn Rate?
Software helps track budget burn by keeping time, rates, and budgets in one system. Burn then updates with every logged hour. A spreadsheet can do the same for one project, if someone keeps it current.
A spreadsheet needs a row per week, hours times rates, and a plan line. If hours are logged in a separate, unconnected tracker, someone has to export, map, and price them. Until then, the sheet shows only what was last copied in. Late hours distort the number too. Timesheets filled in on a Friday or at month-end make burn look flat, then jump when they arrive.
Before choosing a tool, check that it stores a price per service and a cost rate per person. Budget used and cost burn each need one.
FAQ
What Is an Acceptable Burn Rate?
An acceptable burn rate keeps budget used close to percent complete, so spend matches finished work. There’s no universal number, so set your own tolerance band by project size and risk.
What Is the Formula for Determining Burn Rate?
The formula for determining burn rate is budget used divided by time elapsed. Compare it with planned burn: total budget divided by project length.
Track Burn Next to Budgets and Bookings in One Place
Burn rate tells you how fast a project spends its budget. Alone, it only shows pace. Next to percent complete, it shows whether that spend bought finished work. Check both each week, along with cost burn, and record one decision for every project that runs fast.
That weekly check is easier when hours, rates, and budgets are in one tool. Productive is an agentic PSA platform where you run projects, budgets, and resources together.
Book a demo with Productive to see budget used and profit updates as your team logs time.
Track Budget Burn and Profit as Your Team Logs Time
Productive updates budget used and profit as hours and expenses are logged, and forecasts budget used from scheduled bookings.
