7 Professional Services KPIs You Need To Track + Formulas

You can’t manage what you can’t see. In project management, KPIs are specific targets that show whether your projects are on track, profitable, and delivered on time.
This guide covers the seven most important professional services KPIs, the formulas behind them, and what software to use to track them in one place.
The KPIs are organized into two groups to show how the business performs and how work is delivered.
Key Takeaways
- Set clear targets: KPIs show progress and flag issues early so teams act quickly.
- Measure two KPI groups: track Financial and Operational Health and Project Execution.
- Plan before problems hit: leading KPIs simplify staffing, scheduling, and portfolio decisions.
- Use modern PSA software: consistent definitions and live data keep EVM metrics accurate.
What Is a Professional Services KPI?
A KPI is a measurable target for your professional services firm. It shows if you are meeting an important goal in a set time.
People often mix up metrics and KPIs, so here is the difference.
Metrics are measurements that track a specific business activity or process. They show what is happening in one area. In other words, they are your everyday performance metrics.
Key performance indicators (KPIs) are the critical metrics tied directly to a strategic business goal. They show whether the firm is moving toward that goal, and they sit at the core of performance management in professional services organizations.
Metrics are often operational or team-level; KPIs are strategic and can span teams.
You will also hear about two helpful KPI types:
- Leading KPIs estimate where results will land based on today’s plan. Examples include forecasted utilization for the next 4 to 8 weeks.
- Lagging KPIs report results for a completed period. Examples include revenue by client last month or project margin.
Why Do KPIs Matter for Your Services Projects?
KPIs matter because they bring instant visibility to your performance.
They convert high-level goals into clear, actionable signals, letting you know exactly when and where your professional services organization needs to adjust its focus.
Think of your professional service organization as a ship.
KPIs are your ship’s navigation dashboard. They show if you’re:
- pointed toward success
- moving at the right pace
- burning resources too fast
They also help you make minor adjustments now, long before you’re lost at sea.
In the same way, key performance indicators flag early changes in time, cost, or productivity so you can adjust plans before it’s too late.
Which 7 KPIs Should Every Professional Services Provider Track?
Every professional services team should track billable utilization, forecasted billable utilization, revenue by client, profit margin by client, earned value, cost performance index (CPI), and schedule performance index (SPI).
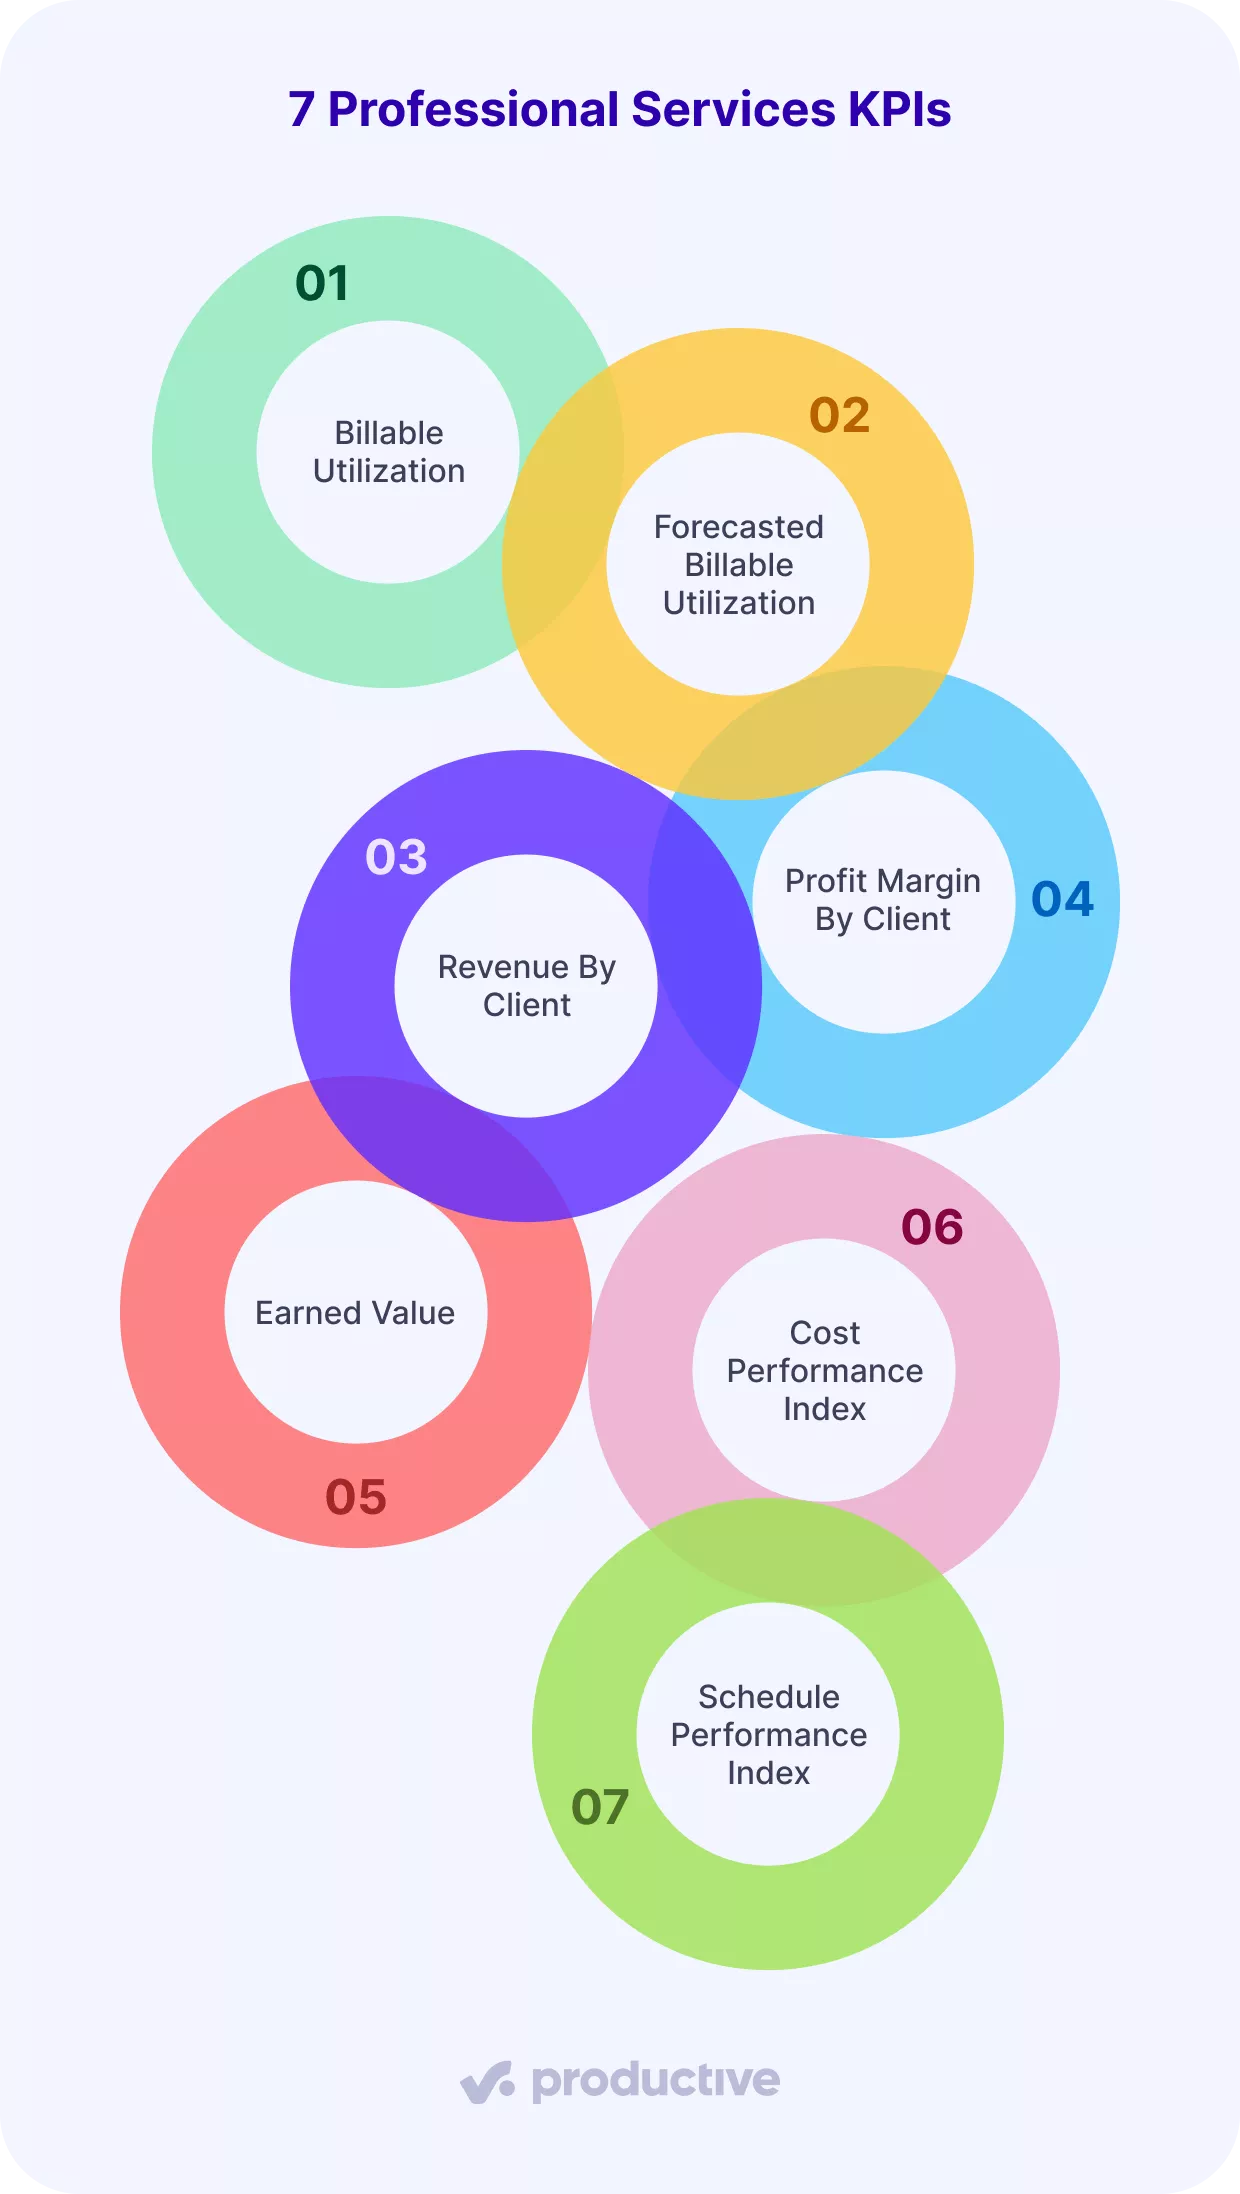
To keep this list practical, we’ve put the KPIs into two groups:
- Financial and Operational Health: checks whether revenue, utilization, and margins are healthy.
- Project Execution (EVM): confirms that the project scope and schedule are on track.
Tracking both prevents blind spots and helps you act early with confidence. For each KPI, you’ll get a simple formula.
1. Billable Utilization
Billable utilization (also called resource utilization or billability) shows how much of a person’s time is spent on client work you can charge for. It sits in Financial and Operational Health because it ties time use to billable revenue.
It matters because agency profit depends on enough billable hours without overloading people.
The formula for calculating billable utilization:
Resource Utilization = Billable Hours ÷ Total Hours Worked × 100
For example, if someone logs 20 billable hours in a standard 40-hour week, their billable utilization is 50%.
To measure utilization correctly, include time off such as vacation, sick leave, and public holidays. You need the real picture of how many hours a person actually had available.
What counts as billable can vary by industry and contract. In short, billable work ties directly to delivering the project. Non-billable work includes internal meetings, admin, and training.
For production roles, aim for 70-90%. Lower numbers often show that something is not being used enough. Numbers near 100 percent for long periods are a risk for burnout and quality.
With Productive, you can see utilization by person, team, or seniority and filter by client or date range. Set up time off calendars so holidays and PTO are counted. That way, your utilization view matches actual availability.
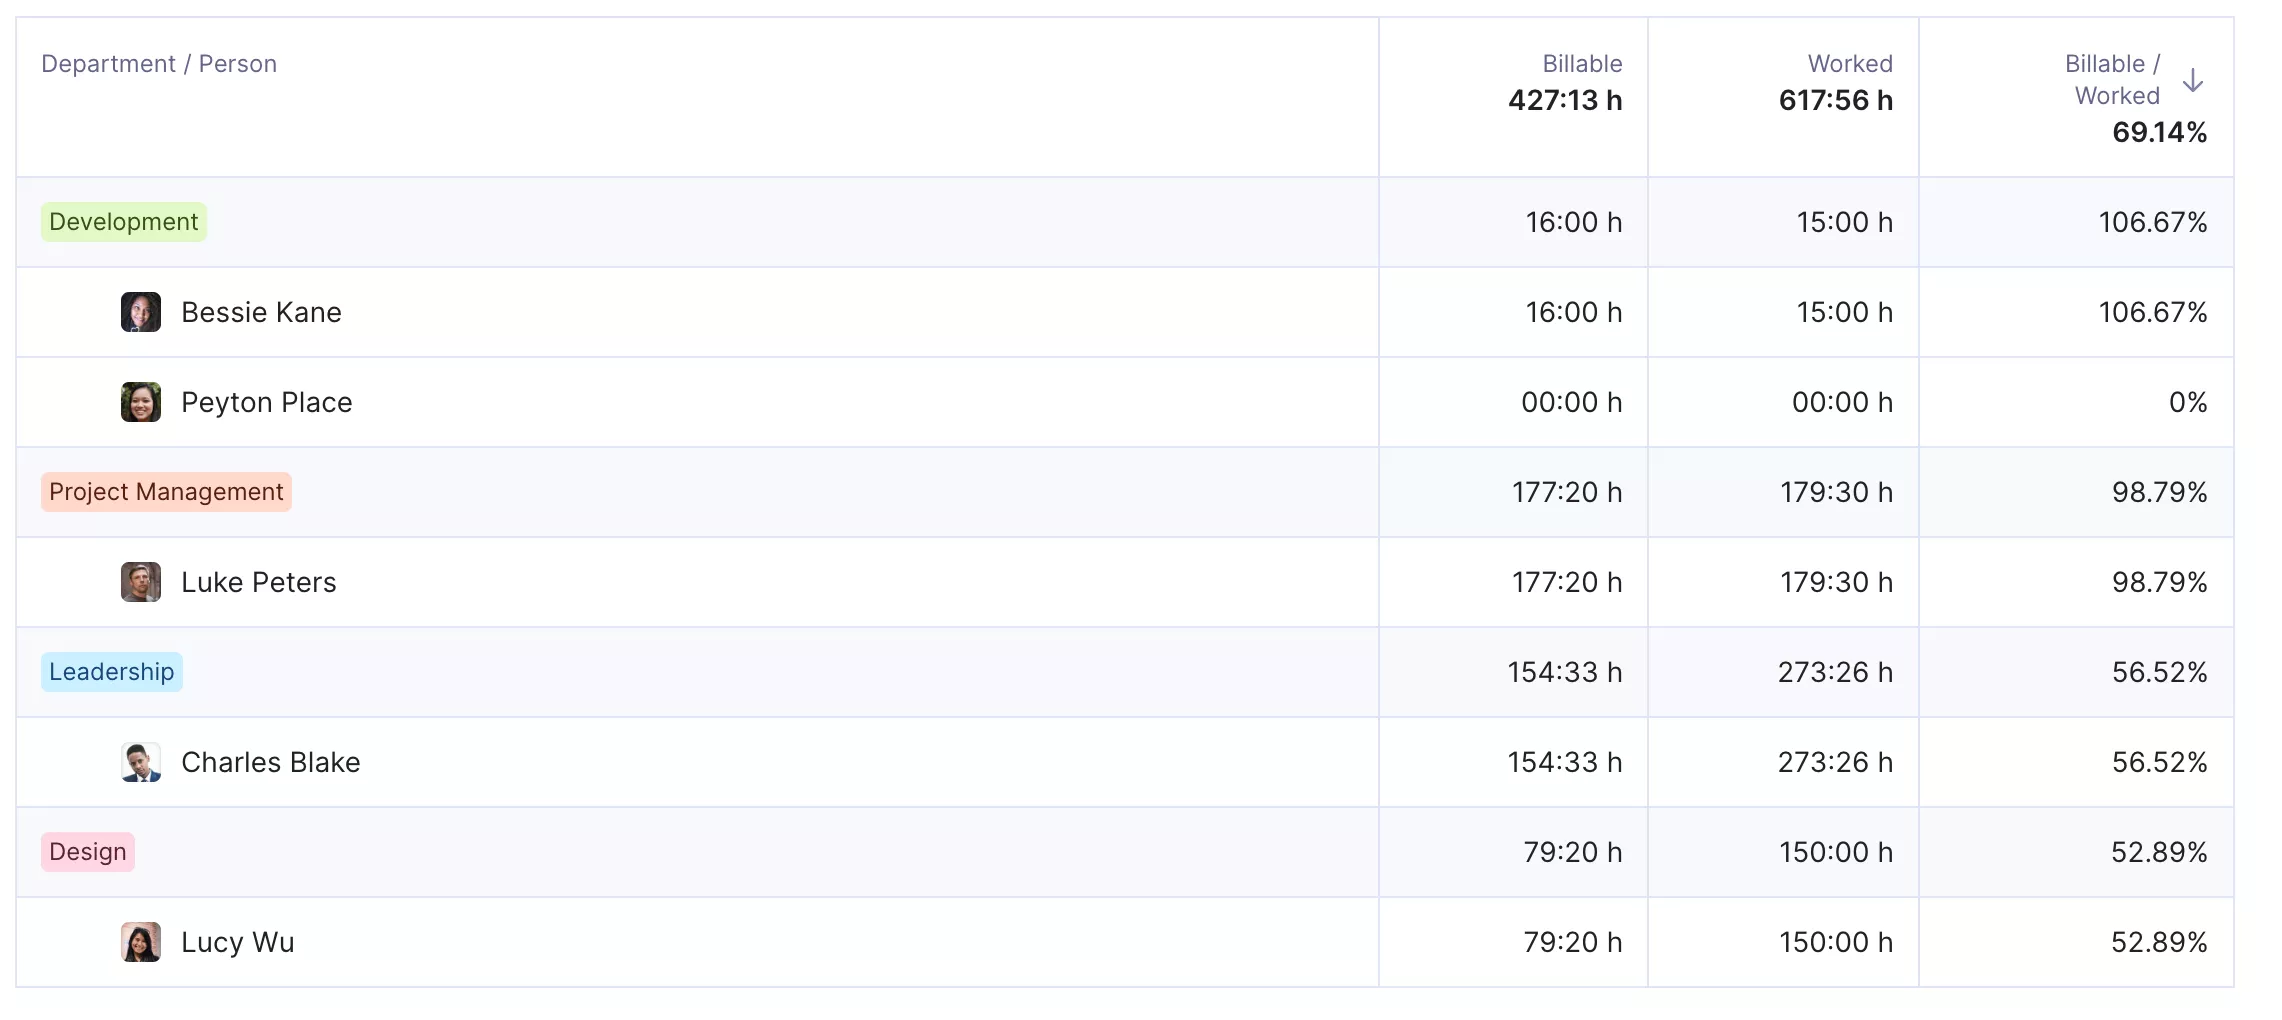
USE PRODUCTIVE TO GET UPDATED TEAM UTILIZATION REPORTS FOR YOUR PROFESSIONAL SERVICES FIRM.
Optimize Your Billable Utilization Rate with Productive
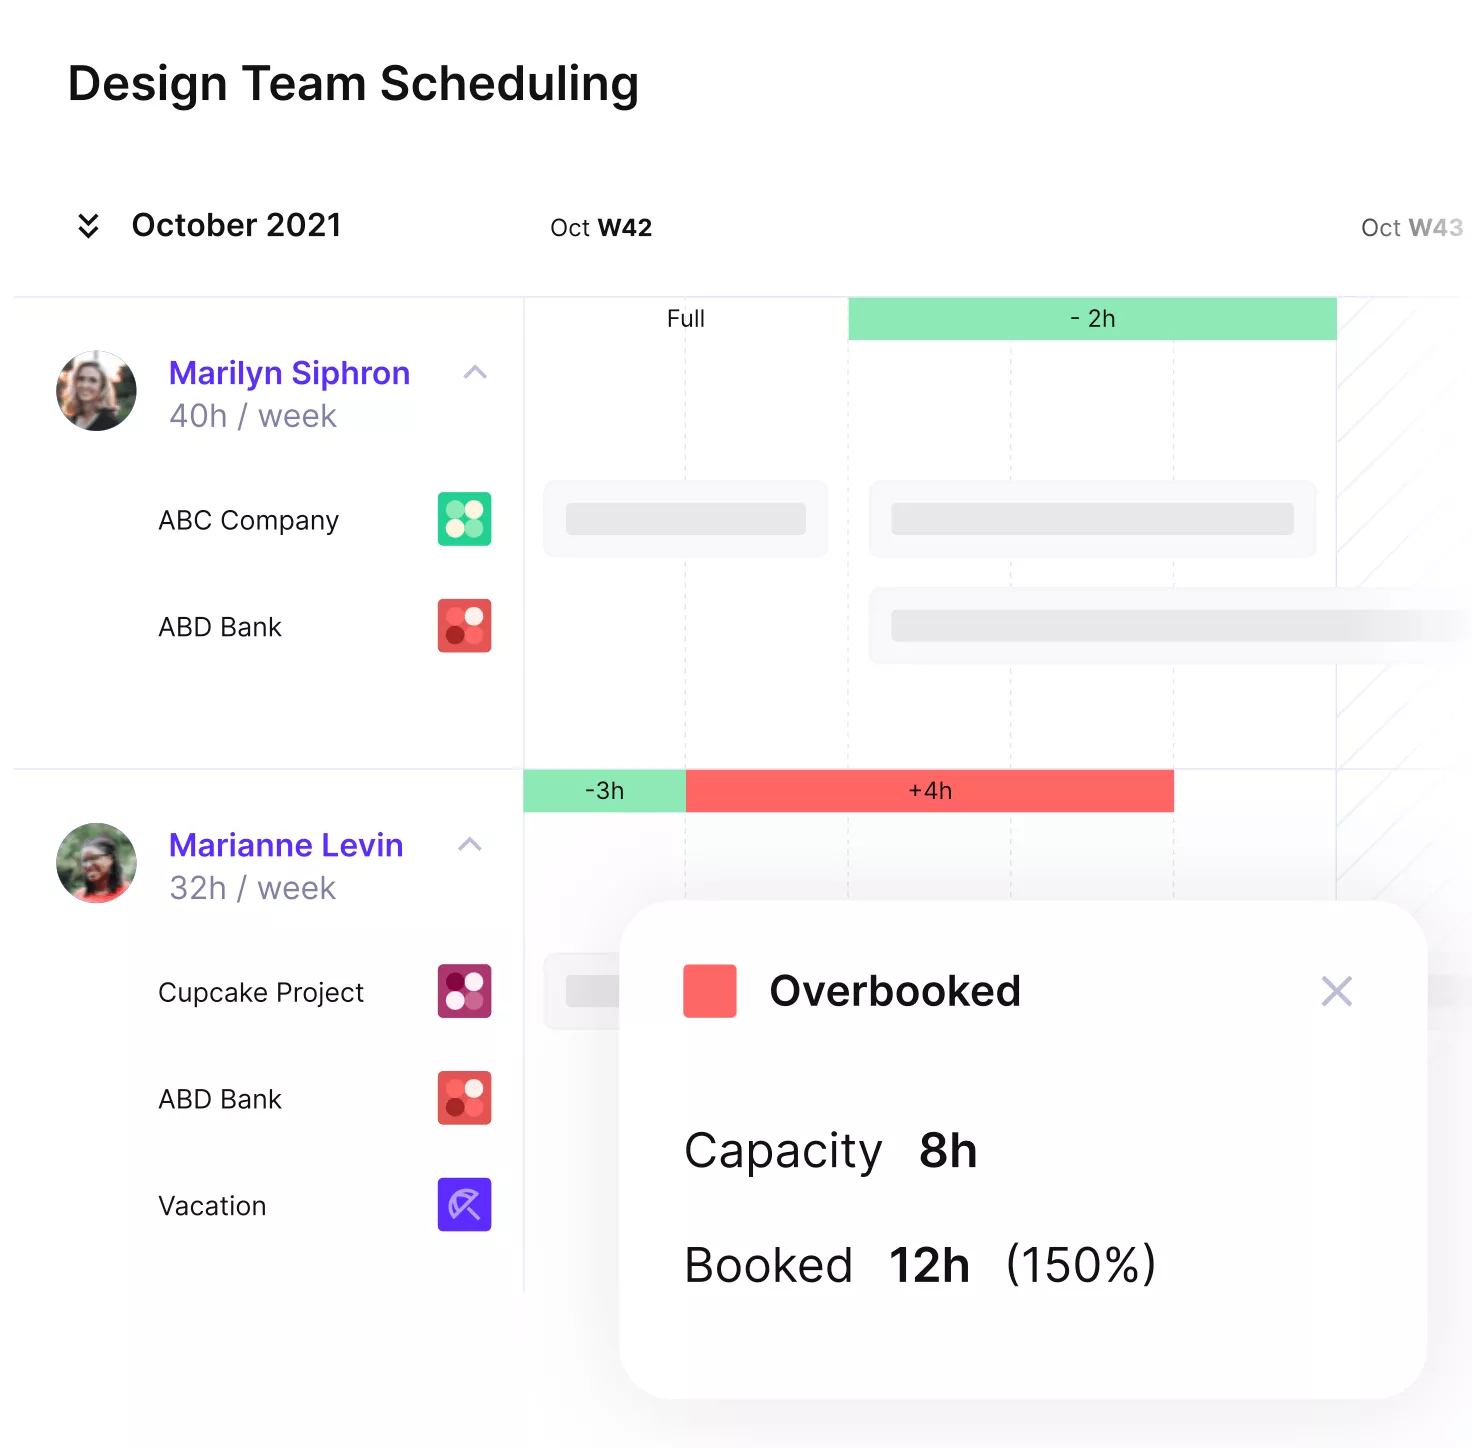
2. Forecasted Billable Utilization
First, we covered the past with the previous KPI, which looks at hours worked and billed. Now we look ahead with forecasted billable utilization. It belongs to Financial and Operational Health because it forecasts staffing availability.
Instead of looking at what happened, this KPI uses scheduled billable hours to show who will be available and when.
The formula for calculating forecasted billable utilization:
Forecasted Utilization = Scheduled Billable Hours ÷ Available Hours × 100
Tracking this makes day-to-day allocation and bigger decisions easier. You can see exactly which teams or people have room in the coming weeks and months.
That makes it easier to accept new projects with confidence and to guide resource planning. If one department stays highly utilized most of the year, consider hiring or shifting work.
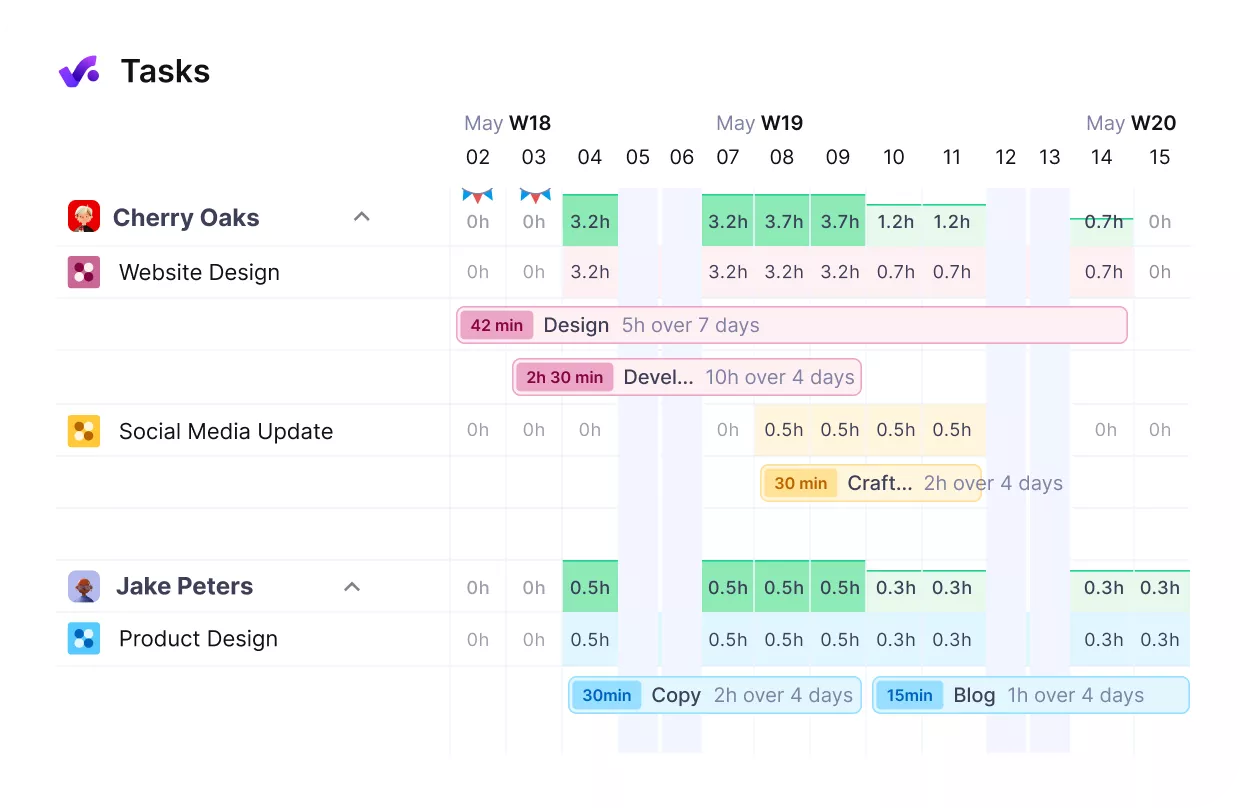
USE PRODUCTIVE TO BALANCE WORKLOADS AND PREVENT OVERBOOKING AHEAD OF TIME.
3. Revenue By Client
Tracking revenue by client is essential to see how much your business depends on each customer and where growth actually comes from. It sits in Financial and Operational Health because it shows where revenue really comes from.
The formula for calculating revenue by client:
Client Revenue = Sum of Revenue for the Client in the Period
Think of revenue by client like a table with many legs: the more even the support, the steadier it stands. This view shows who funds your payroll and whether revenue growth comes from many clients or from one large account.
A healthy mix lowers risk and supports sustainable growth. For guidance on concentration risk, Allianz Trade notes that about 20-25% of total revenue from a single customer is high-risk.
Rather than letting one leg carry most of the weight, spread your revenue across several strong clients to reduce the risk of a sudden customer churn. If any client crosses that revenue dependency line, either diversify quickly through wider customer acquisition or protect the account with tighter scope control.
4. Profit Margin By Client
Profit margin by client shows which client accounts actually generate profit and which drain it.
The formulas for calculating profit margin by client:
Project Profit = Project Revenue − Project Costs
Profit Margin % = Project Profit ÷ Project Revenue
Track project margin by client so you can:
- Compare accounts side by side
- Protect project profitability with timely scope and staffing changes
- Set clear expectations with clients
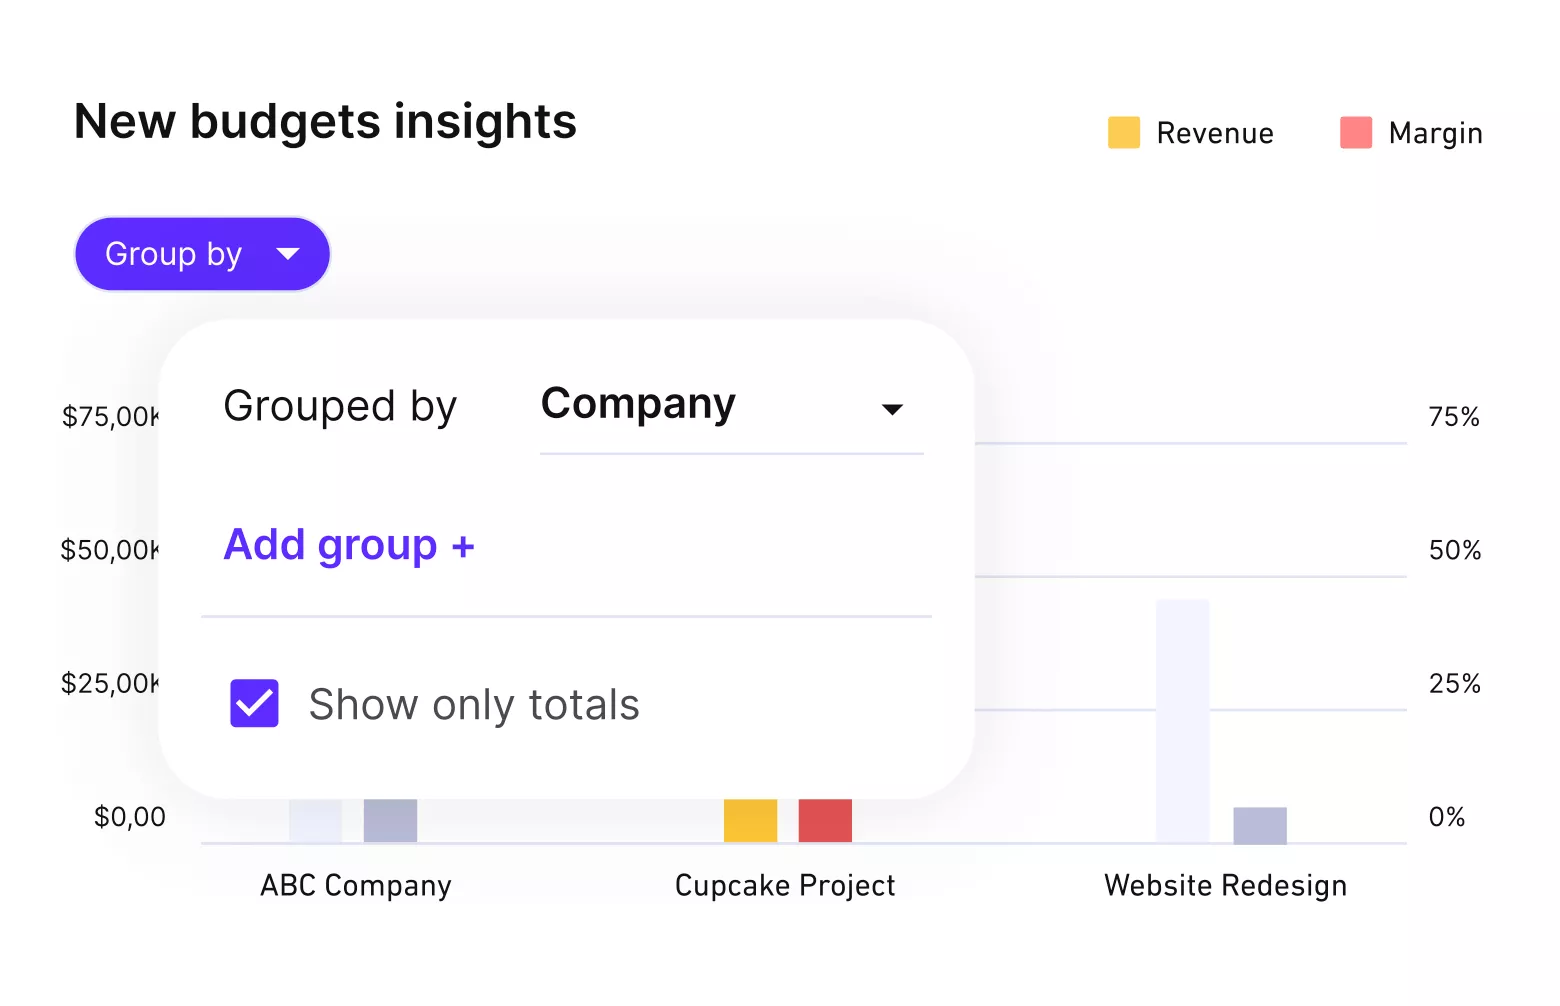
USE PRODUCTIVE TO GET DETAILED INSIGHTS INTO YOUR PROJECT’S PROFITABILITY.
Use industry benchmarks to set expectations. Promethean Research’s 2025 Digital Agency Industry Report found agencies averaged about 16% net profit margin across the period reviewed.
Margins also change with size. Small studios with fewer than 10 FTE often earn higher net margins than larger firms. Earlier comparisons showed that under 10 FTE studios had roughly half the margin of 50+ FTE agencies.
5. Earned Value
Earned value is a key component of earned value management, a project management method that integrates scope, schedule, and cost into a single view. Because of this it belongs to the Project Execution group.
Put simply, earned value is the value of work actually completed at a point in time. It reflects the value achieved with the resources you have invested.
Teams use earned value for variance analysis and performance indexes to compare planned versus actual progress for scope and cost.
The formula for calculating earned value:
Earned Value (EV) = Percentage of Work Completed × Original Project Budget
Example: if a project budget is $10,000 and you have completed 15% of the work, then EV = 0.15 × $10,000 = $1,500.
To make EV comparable across projects, you’ll need a standardized method for tracking project progress.
6. Cost Performance Index (CPI)
Building on earned value, the cost performance index (CPI) shows how efficiently your project turns cost into delivered value. It indicates whether your projects are on budget, over budget, or under budget.
In earned value management and project management, it helps you spot budget risks early so you can correct course before they grow. Because of this, it’s in the same Project Execution group.
The formula for calculating CPI:
CPI = Earned Value (EV) ÷ Actual Cost (AC)
How to read it:
- CPI = 1.00 means on budget; work is costing what you planned.
- CPI > 1.00 means under budget; usually good, but very high values can signal missed scope or lower quality.
- CPI < 1.00 means over budget; check for workflow issues, capacity gaps, or delays that could lead to a project overrun.
Example: if EV = 50,000 and AC = 55,000, then CPI = 0.91. Costs are running ahead of value delivered.
7. Schedule Performance Index (SPI)
Alongside CPI, the schedule performance index (SPI) shows how fast planned work becomes finished work. It tells you if your project is ahead of schedule, on schedule, or behind schedule.
It links scope and schedule in Project execution, enabling project management to check a project’s schedule health at a glance.
SPI compares earned value (work completed) with planned value (work scheduled to date).
The formula for calculating planned value:
Planned Value (PV) = Percentage of Work Scheduled for Completion × Original Budget
The formula for calculating SPI:
SPI = Earned Value (EV) ÷ Planned Value (PV)
How to read it:
- SPI = 1.00 means on schedule; work is finishing as planned.
- SPI > 1.00 indicates work is finishing ahead of schedule; it is finishing faster than planned.
- SPI < 1.00 indicates the project is behind schedule; if the trend continues, there is a risk of a project overrun.
Example: if EV = 80,000 and PV = 100,000, then SPI = 0.80. Work is moving more slowly than planned.
USE PRODUCTIVE TO KEEP SCHEDULES ON TRACK.
Why Modern Software Tools Are Essential for Tracking KPIs?
Modern software is essential because it keeps KPI data accurate, up to date, and consistent, enabling teams to manage performance and act quickly.
Software keeps data in one place and in sync, applies consistent definitions, shows live budgets, time, and progress, and reduces manual copying.
Without it, teams copy numbers between files, chase status in chats, and wait on spreadsheet updates. That slows decisions and increases errors.
Productive helps by centralizing forecasting, real time budgeting, resource planning, and time tracking in one platform.
To turn forward leading KPIs into concrete plans, use Productive’s Scenario Builder to plan resources by capacity and availability:
- Create multiple scenarios for a single deal or budget
- Adjust services, resources, and bookings
- Compare outcomes and choose the most profitable option
- Apply the chosen scenario to the live budget or deal
Final Thoughts on Professional Services KPIs
KPIs show how you are performing and what to do next. To effectively manage them, keep your professional services KPIs in one place and use a standardized method to track them.
Without the right software, data falls out of sync, choices take longer, and client satisfaction drops.
Productive brings project management, time management, resource planning, budgets, and reports together so you see real-time numbers and act with confidence.
Ready to centralize your KPIs and get a clear view of every project? Book a demo with Productive today.
Track KPIs and Run Projects in the Same Platform
Keep all your numbers in one place without juggling tools. Use Productive to track time, plan resources, and manage budgets.
