Introducing Dashboards: The Control Panel of Your Agency


You can easily build a powerful report in Productive, but sometimes you want to see all the important data at a glance.
Staring your day with opening Productive and checking out all key numbers on a single screen is way more convenient then building several reports.
This was the thinking behind the complete overhaul of Dashboards: Think of it as the control panel of your agency, showcasing the data that is most important for you – with the help from a series of widgets.
Creating a Dashboard and adding widgets allows you to:
See your favourite reports all in one place
Check the latest data, updated in real time
Focus on the data presented, not on building the report
Create multiple data centres, each one containing different information
Streamline Your Project Management
Productive helps you organize your project activities and keep all project stakeholders in the loop.

To save time, you can create widgets out of our library of prebuilt ones, or you can convert reports from Reports to widgets as well:
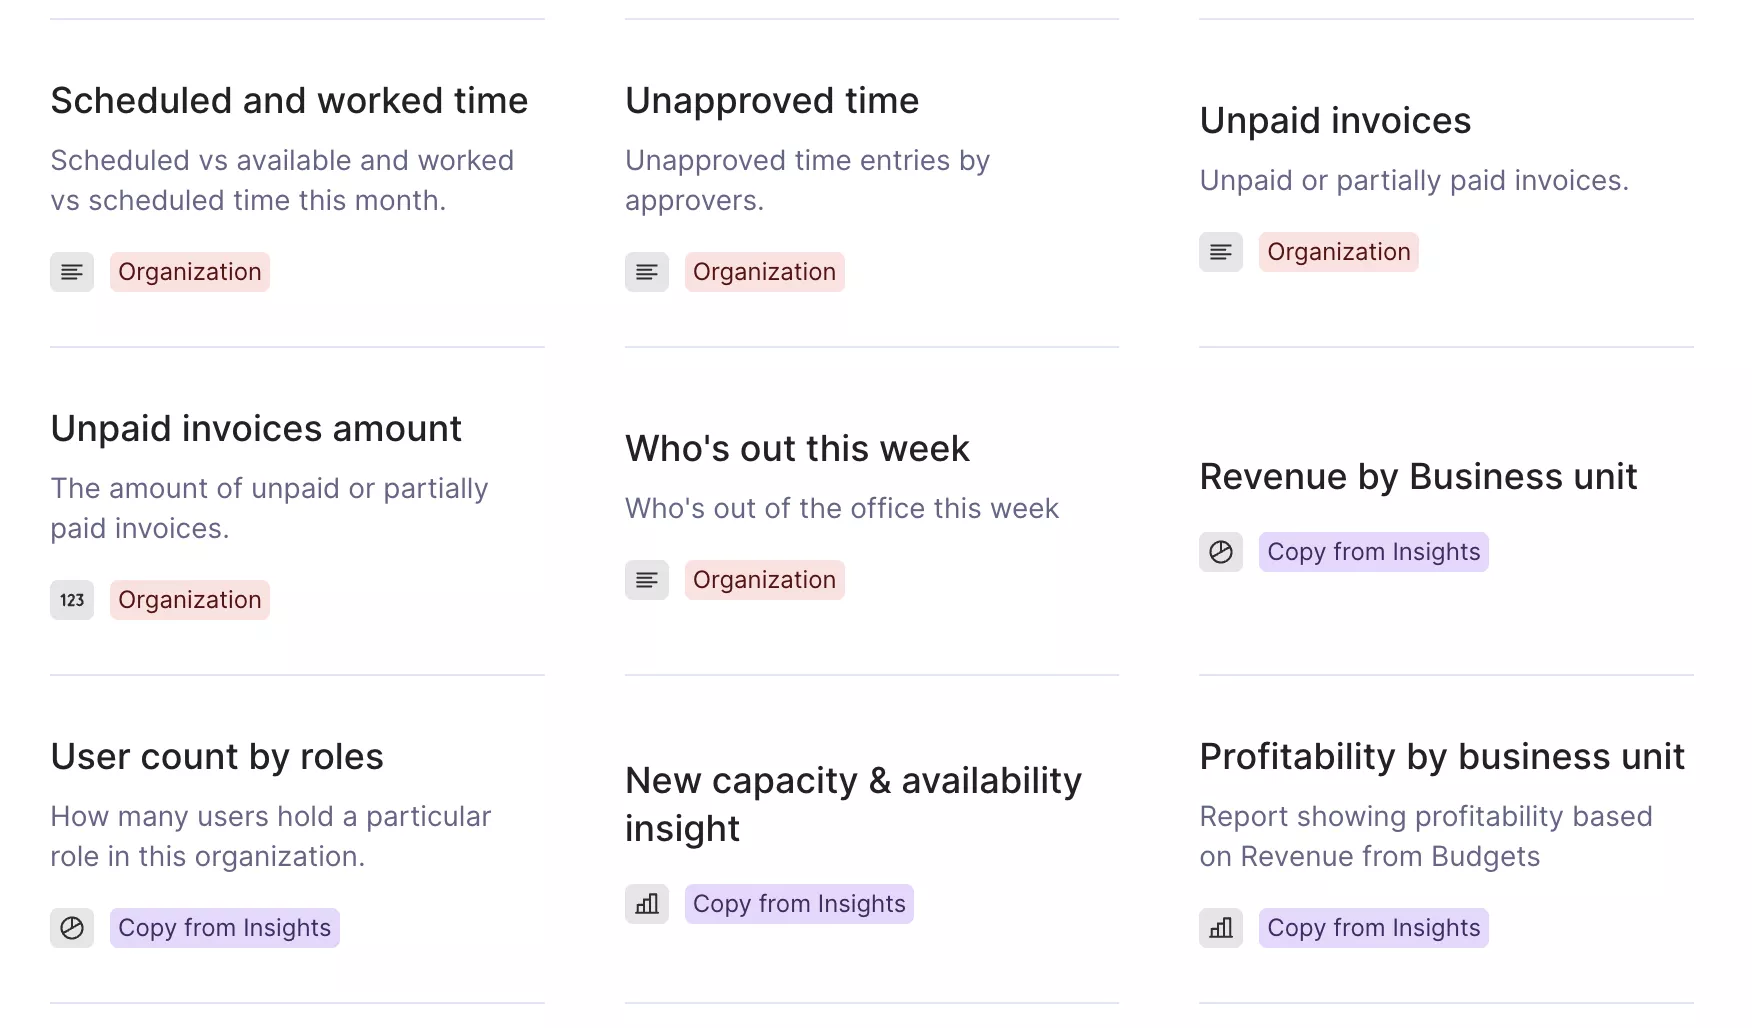
All widgets are editable directly on the Dashboard, using the same principle you’d use when building a report, i.e. adding fields, applying filters and using various grouping options. Also, if you edit a widget you’ve imported from Reports, the original report will remain intact.
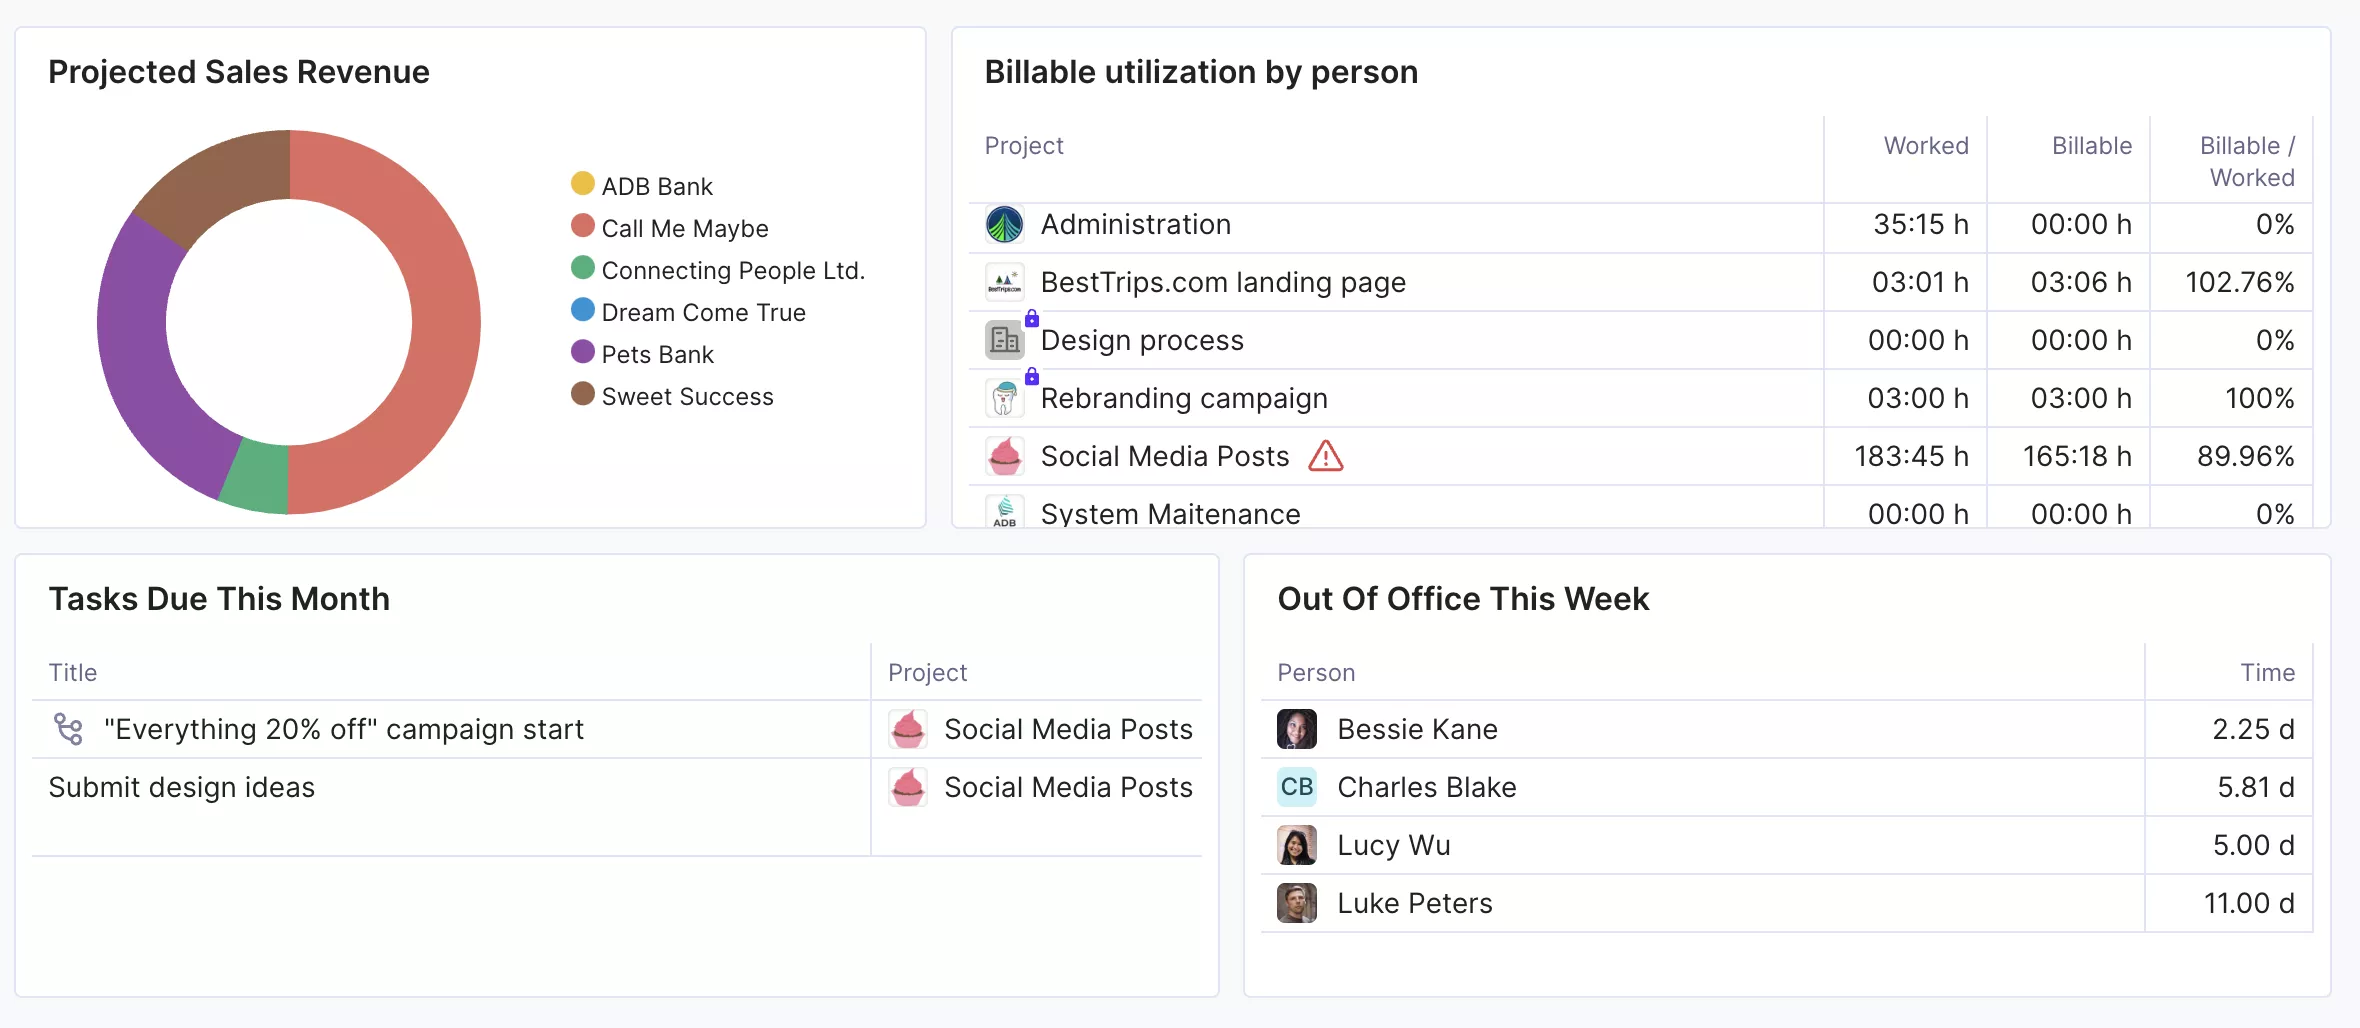
Multiple Dashboards are supported, allowing you to create groups of widgets organised around a common theme. A good example would be creating one Dashboard with a company-wide overview:
…and the other with reports that are important to only you:
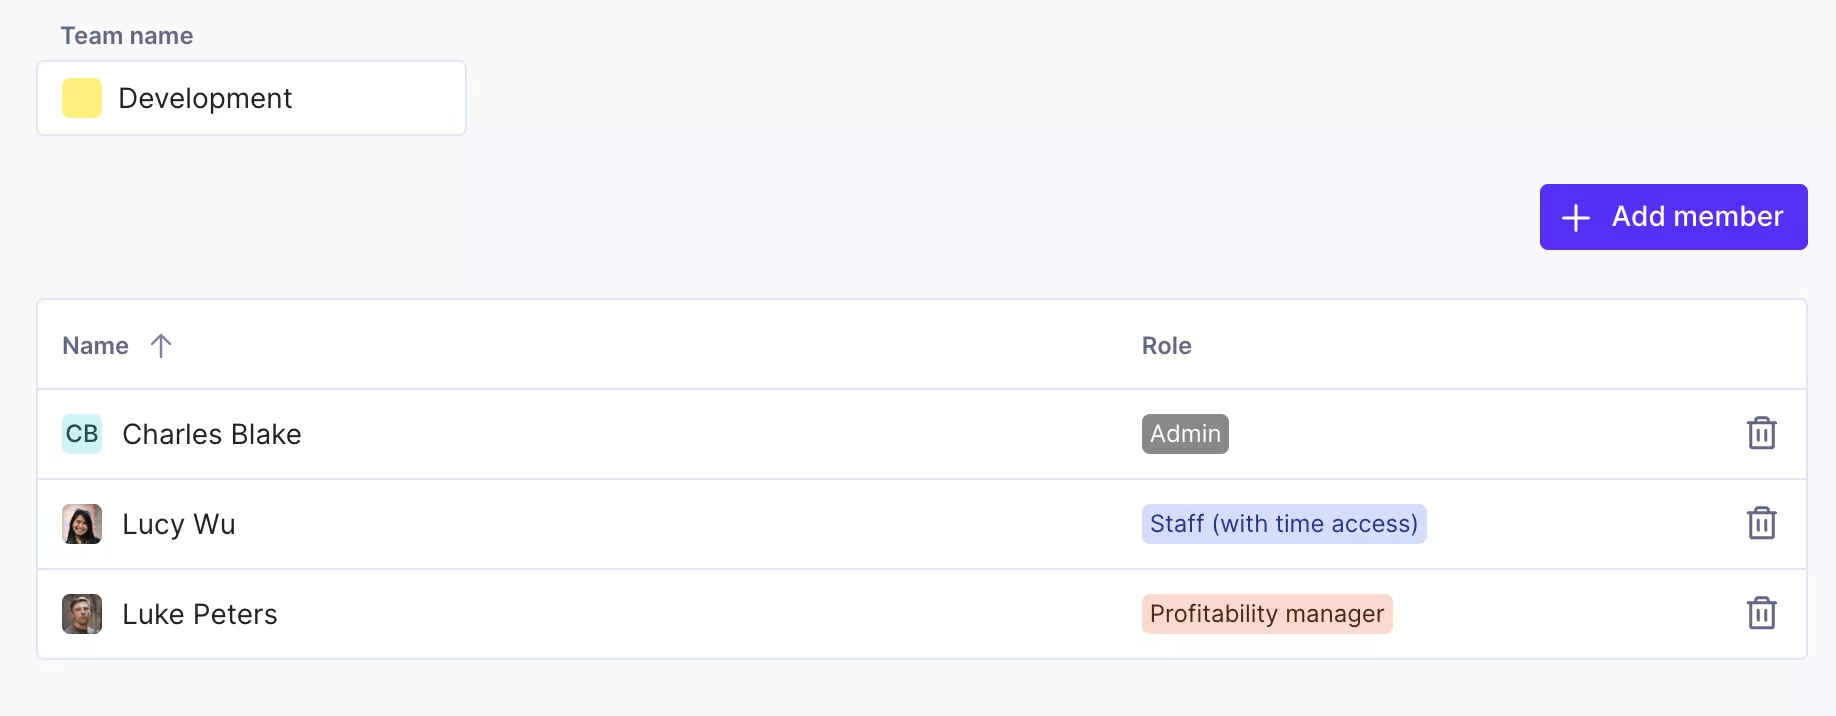
Teams
If you’re creating a Dashboard that could interest multiple people – say, that company overview from the previous example – a good way to share it with them would be to add them to a Team – a manually created group of people that have the same permission level.
In this example, a group of people was added to the Team called “Development”:
Now you can create a Dashboard that you can share only with the members from that Team:
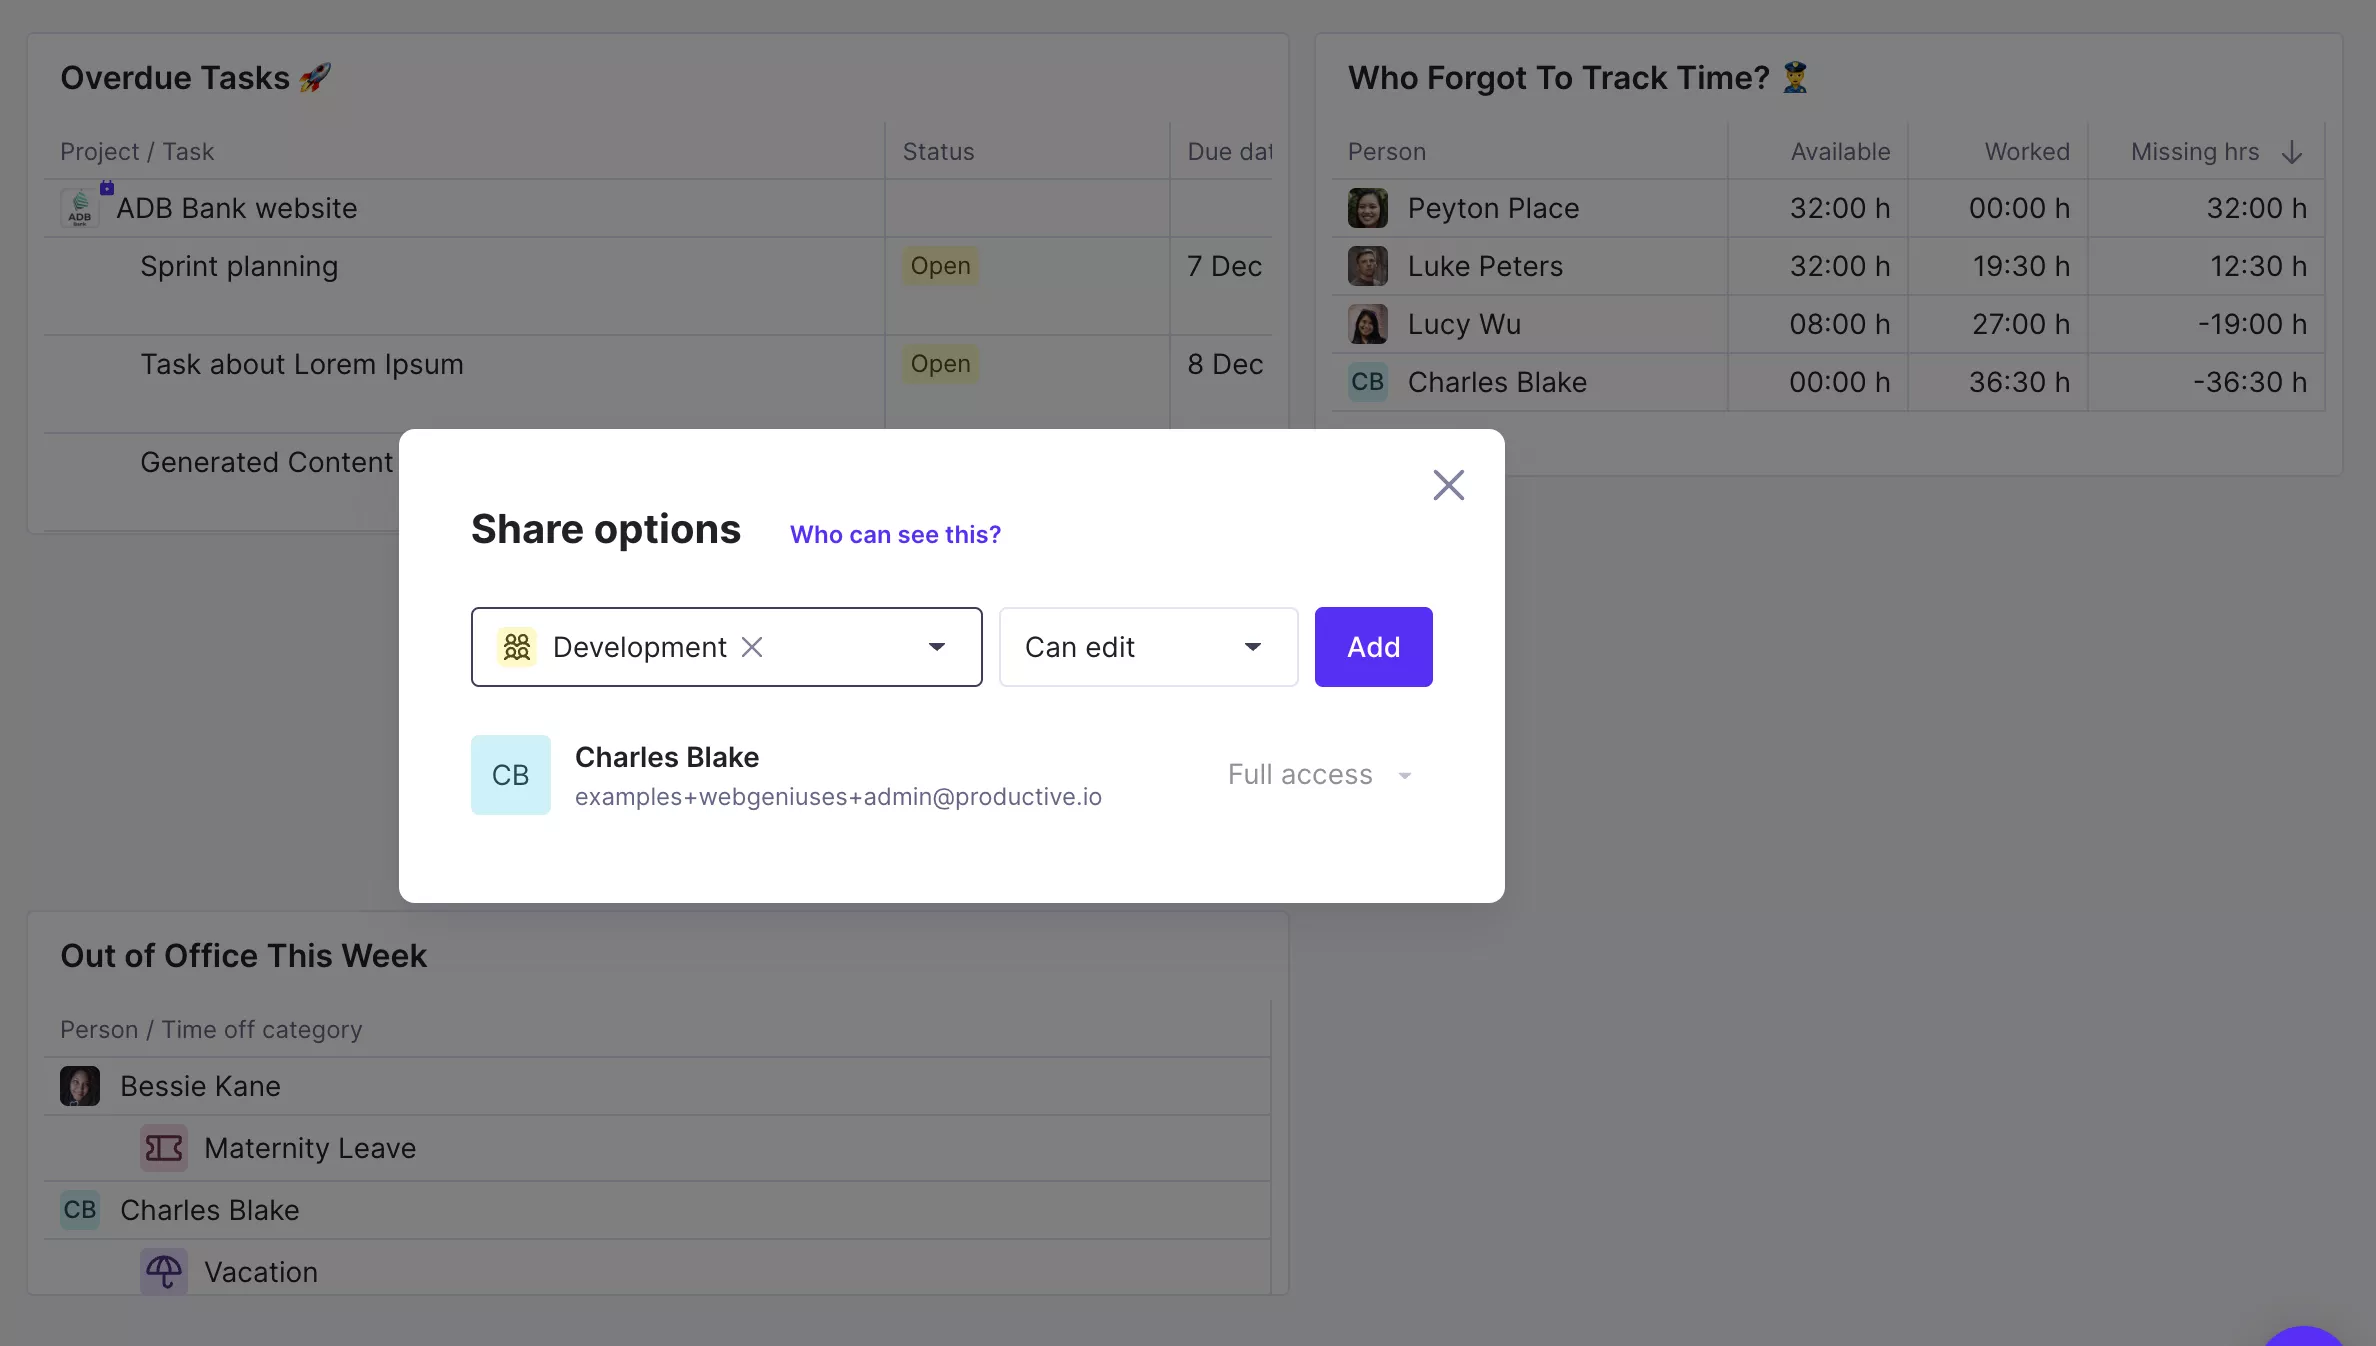
Have in mind that reports will still be visible to people with their respective permissions, meaning that if you share a financial report with a team, only people who can see the original data will be able to see that report.
Organising people in Teams will also be available soon on Projects and when filtering in Scheduling. We also plan to add Teams to Docs, our upcoming collaboration and note-taking feature.
Some Ideas To Get You Started
When creating a Dashboard (or more of them), think of what is the type of information you need to see often, without the unnecessary stuff. Here’s a couple of examples to inspire you:
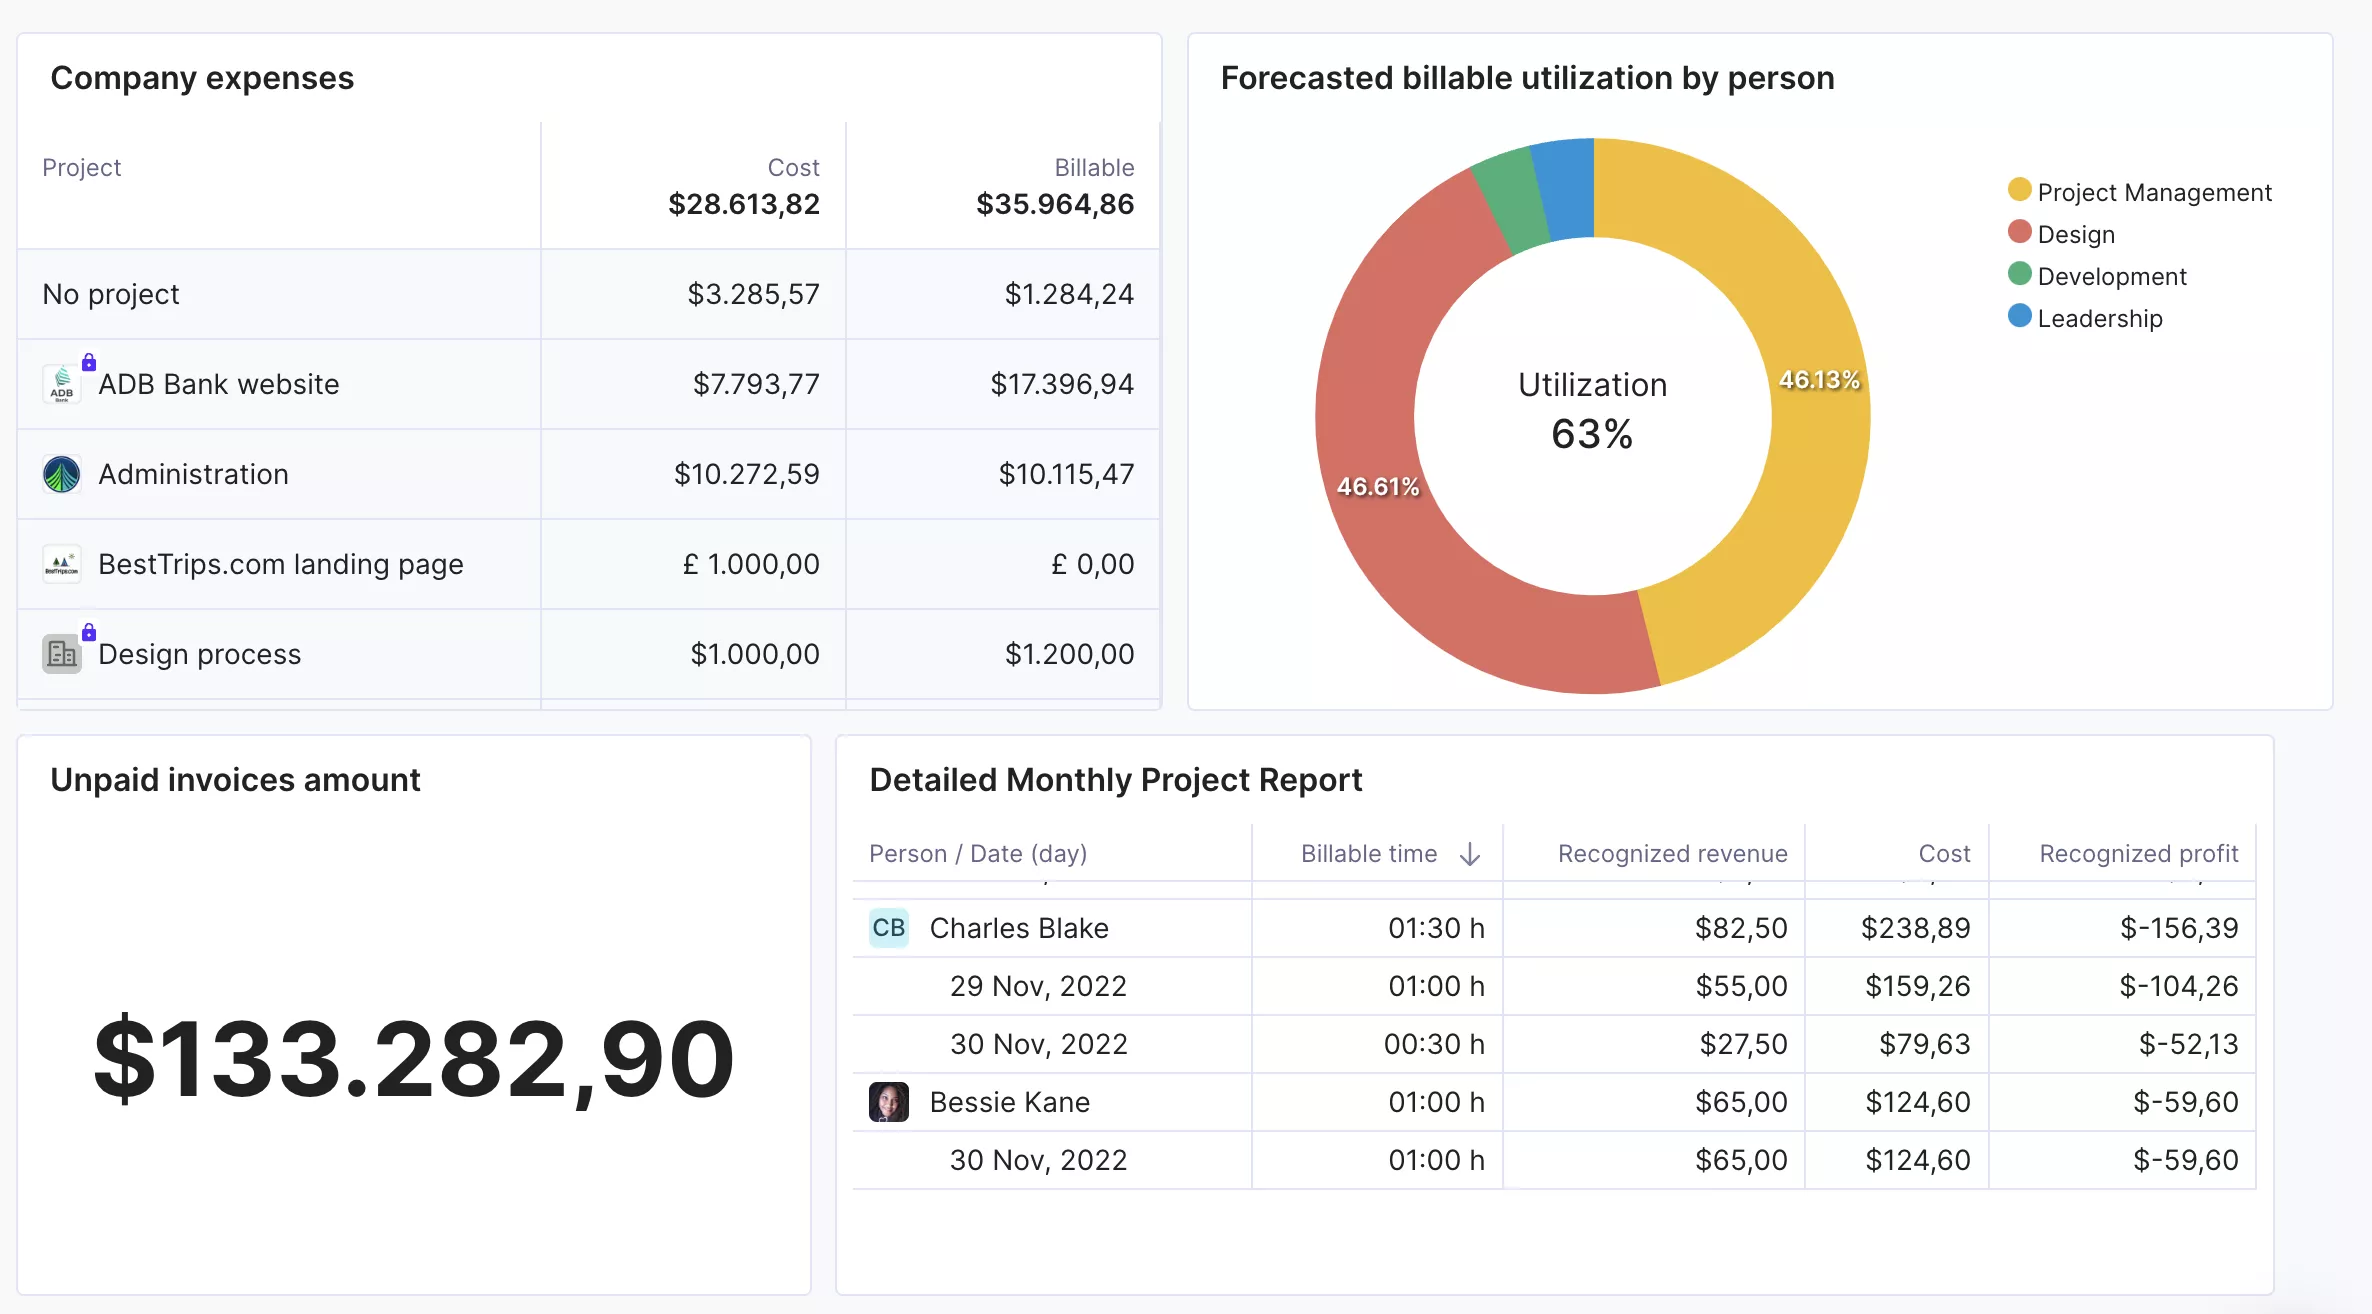
A clear overview for your finance team:

Focusing on Sales? Here you can see the projected revenue per client, how much was generated by new deals or existing customers, potential revenue of open deals…

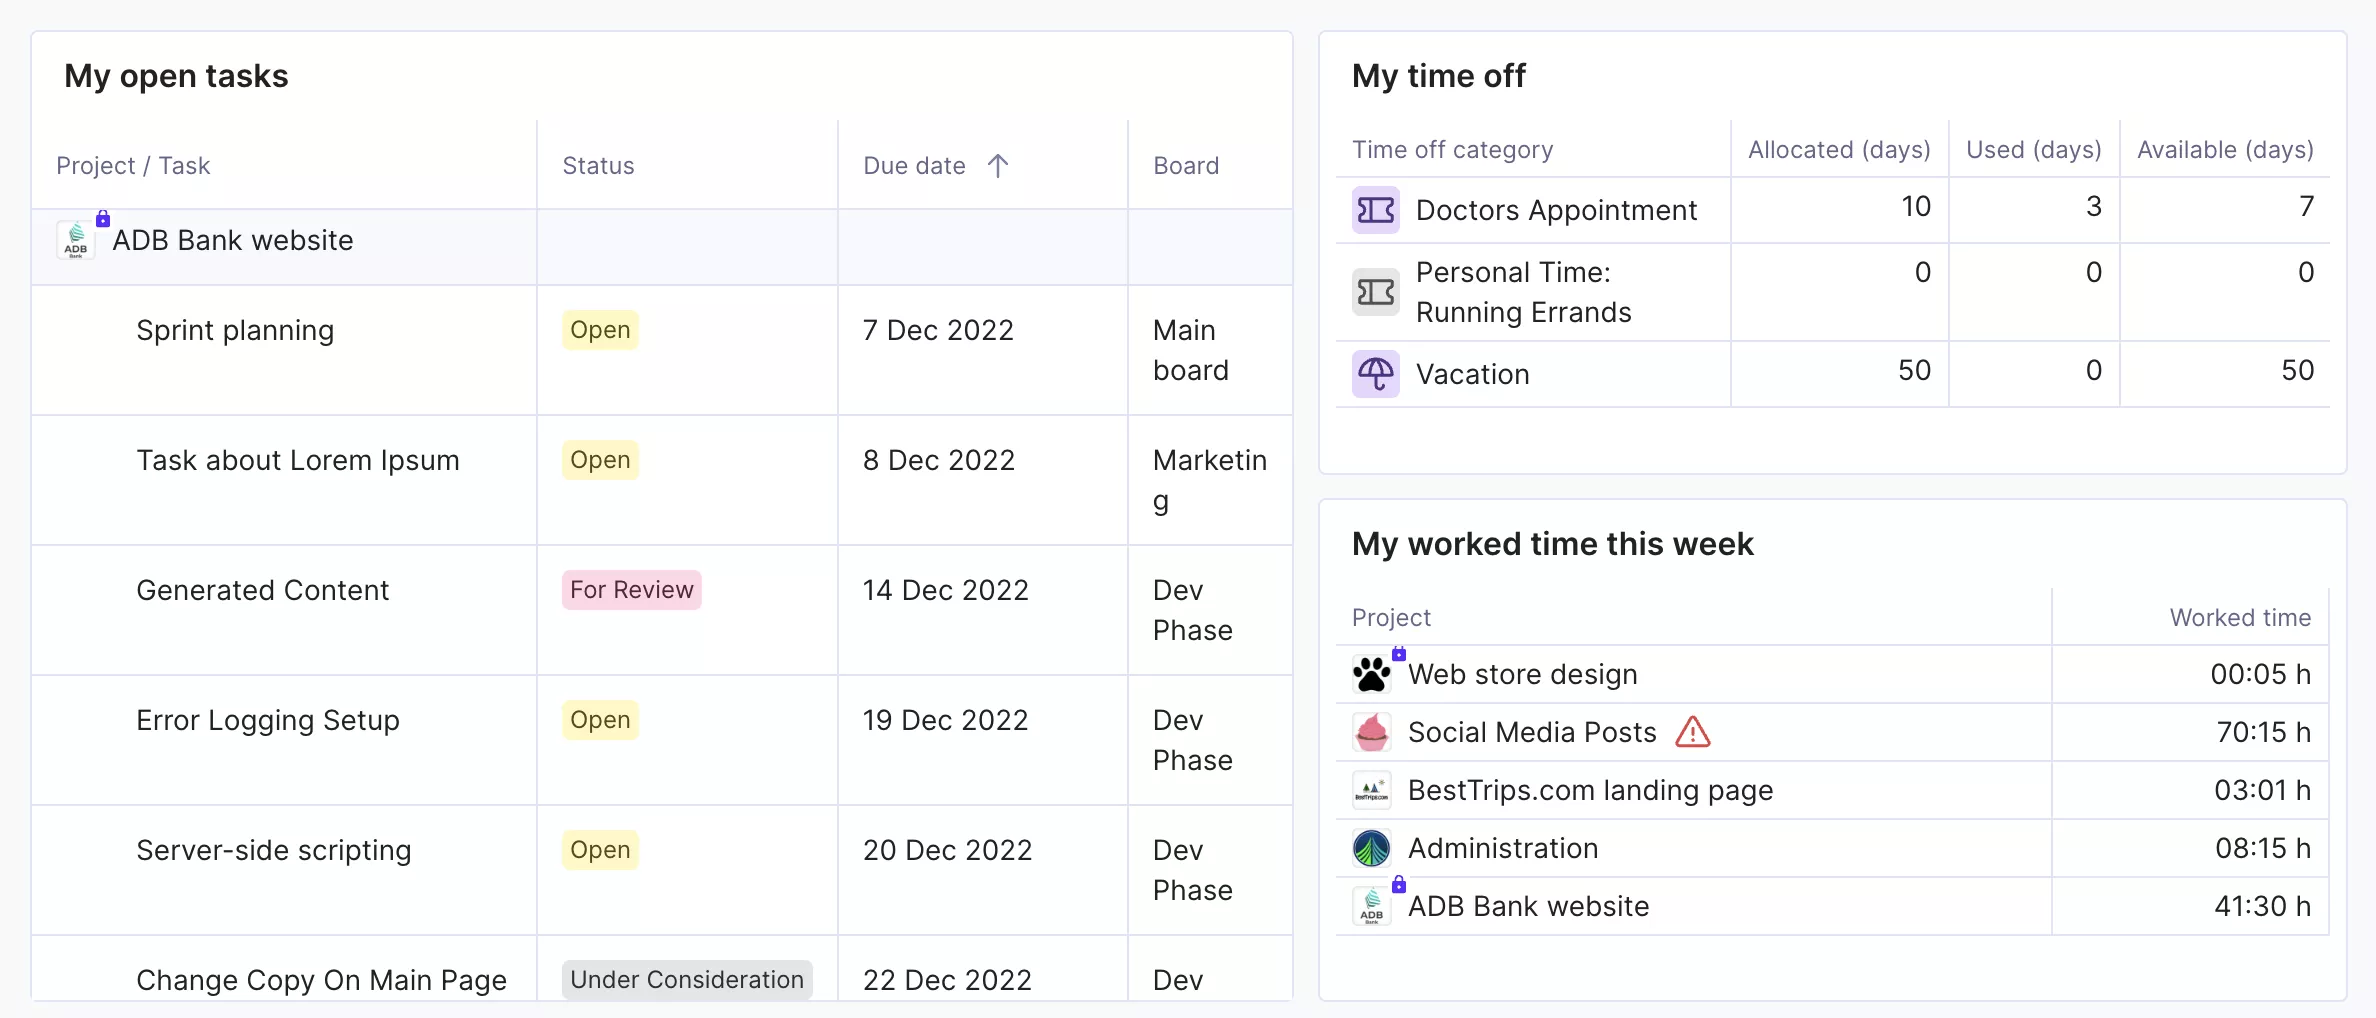
And if you’re just concerned with tracking time, Tasks you need to finish, and how much time off you have left, then check out this view:

As said before, all of them can be shared with a specific team, the whole company, or they can be personal data centre. If you need more inspiration, reach out our support team and we’ll help you with the set up in no time.
Streamline Your Project Management
Productive helps you organize your project activities and keep all project stakeholders in the loop.


