Guide To Benefit Cost Ratio in Project Management

The Benefit-Cost Ratio (BCR) analysis in project management helps determine a project’s profitability by comparing present values of benefits to its costs.
By the end of this article, you’ll know how to calculate the BCR, understand its advantages and limits, and how to apply it in your projects.
Key Takeaways
- BCR is calculated by dividing the present value of benefits (PVB) by the present value of costs (PVC), indicating economic viability.
- A BCR above one signals a profitable investment, while anything below suggests that expenses will be higher than profits.
- Project managers must consider both direct and indirect expenses (including opportunity costs) when calculating this benefit to cost ratio.
- Cost-benefit analysis should also incorporate non-financial benefits and stakeholder perspectives for comprehensive project evaluation.
What Is the Benefit-Cost Ratio (BCR)?
The Benefit-Cost Ratio (BCR) is a financial metric used in project management to evaluate a project’s economic gains. It compares the present value of expected benefits (PVB) to the present value of projected costs (PVC).
It’s commonly used in the feasibility study to support investment decisions and prioritize potential business opportunities. This calculation provides essential insights into potential returns on investment.
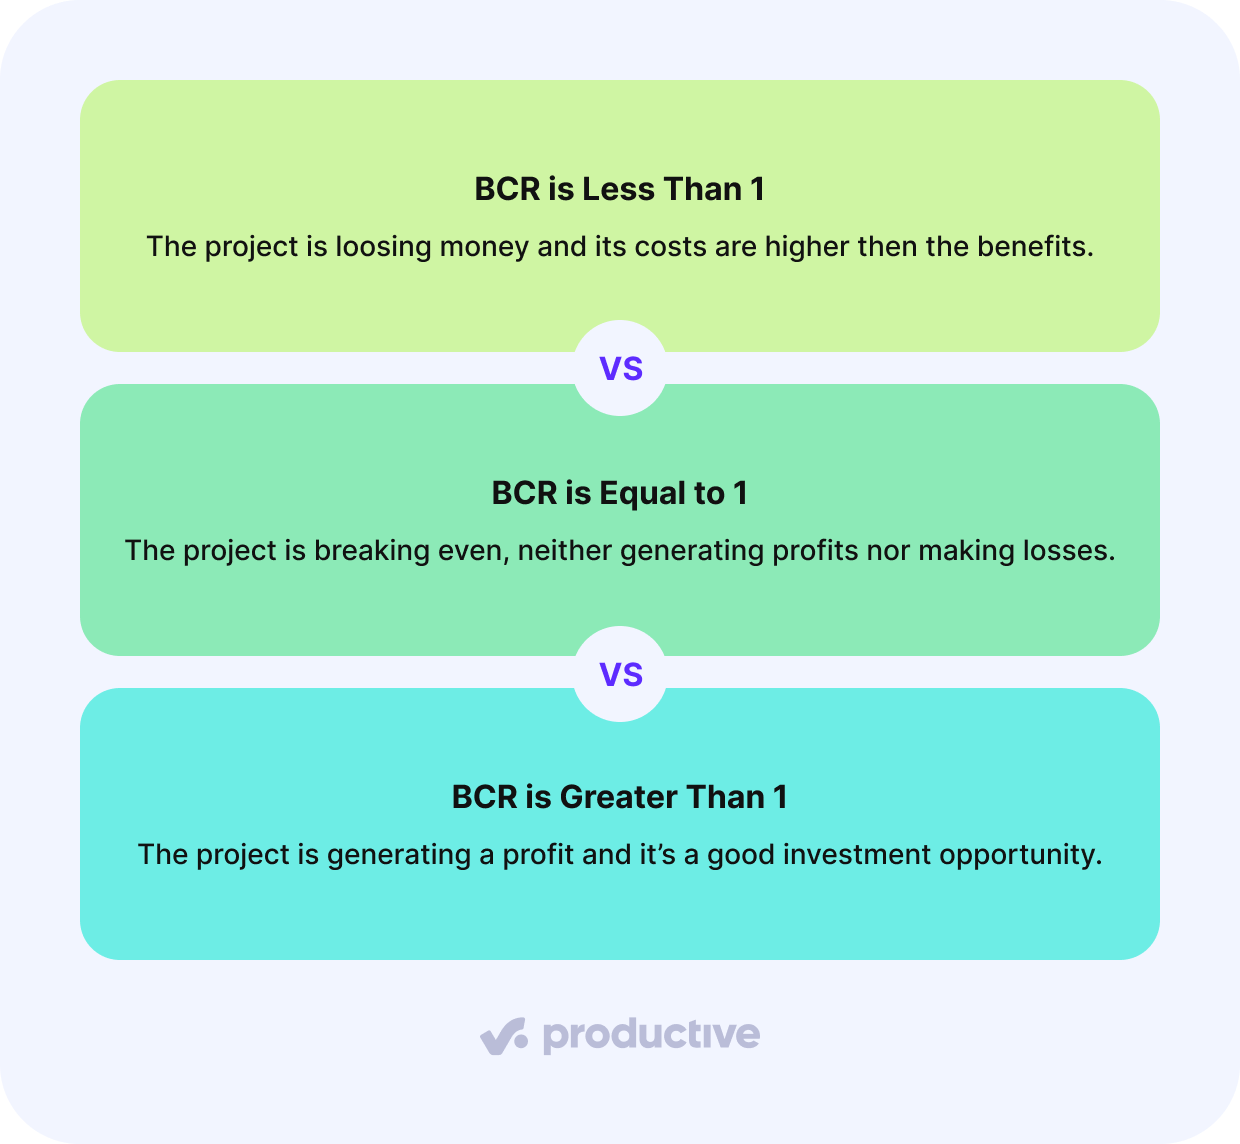
When you’re evaluating potential investments, a BCR of less than 1 indicates that expenses exceed the potential monetary benefits, making the project a bad investment option.
A BCR equal to 1 is a break-even point where profits exactly match expenses, meaning that you should really consider if the risky project investment is worth it.
If you’re analyzing a project with a BCR greater than 1, you’ve identified an economically viable opportunity where the expected benefits outweigh the expenses, making it a worthwhile investment.
The accuracy of the cost-benefit study relies heavily on determining the PVB through appropriate discount rate selection.
In the sections below, we’ll zoom-in on all three scenarios.
BCR is Less Than 1
When you’re analyzing a project that shows a BCR below 1, it indicates that the costs exceed the expected profits, suggesting potential financial losses. For example, a BCR of 0.75 means you’ll only get $0.75 for every dollar invested. The PV concept requires discounting all future profits and capital costs to make accurate comparisons.
Although the BCR analysis is powerful tool for financial assessment, you’ll need to take into account that it doesn’t consider intangible benefits or strategic objectives.
It’s important to evaluate your project using additional metrics like the internal rate of return (IRR) and net present value (NPV) for a detailed research.
BCR is Equal to 1
This ratio represents a critical threshold in investment analysis, where the PVB precisely equals the PVC.
In this scenario, you’re fundamentally breaking even, neither generating economic surplus nor incurring losses. For decision-making purposes, this represents an NPV of zero (for every dollar you invest, you get one dollar back).
While these don’t create additional financial worth, they may offer strategic advantages or intangible benefits that aren’t captured in monetary terms.
You’ll need to carefully consider non-financial factors, such as environmental impact and social impact, when deciding whether to proceed with a BCR-1 project, as other investments might deliver higher returns.
BCR is Greater Than 1
When the BCR is higher than 1, it signals a good investment opportunity where projected profits are greater than anticipated expenses.
In other words, for every dollar invested, you’ll receive more than a dollar in return.
For example, if you’re evaluating a manufacturing business with a BCR of 1.67, you should expect €1.67 in profit for every euro invested. While this metric strongly suggests economic viability, you shouldn’t rely on it exclusively.
It’s important to take into account other factors, like non-monetary rewards, potential risks, and strategic alignment with your organization’s goals.
How Does the Cost-Benefit Ratio Work?
The cost-benefit ratio works like a financial indicator of the project’s viability based on a formula. First, you’ll need to calculate the present value of all expected profits and expenses of your project using an appropriate discount rate. Then divide the total PVB by the total PVC to determine the ratio.
Below, we’ll explain the key ingredients of the cost-benefit study.
Present Value of Benefits
Determining project viability requires understanding how the PVB works within the cost benefit analysis. You can calculate it using the formula
PVB = FV/((1+r)^n)
where :
- FVB represents the future value.
- r is the discount rate
- n indicates the number of periods (eg. moths, quarters, years)
To simplify this process, you can use Excel’s built-in functions for PV calculations.
When you’re comparing, converting future profits to PV helps create an accurate BCR. This guarantees you’re making apples-to-apples comparisons between current expenses and future returns, leading to better informed investment decisions.
Present Value of Cost
For this part of the cost-benefit analysis, you’ll need to make a detailed cost estimation. Take into account all future expenses, including operational and maintenance costs, and convert them to their current worth using the PV formula from before.
PVC = FC/((1+r)^n)
where :
- FVB represents the future costs.
- r is the discount rate
- n indicates the number of periods
The process requires attention to factors like interest rates, inflation, and duration.
Higher interest rates reduce the PVC, while longer time horizons amplify the impact of the time value of money. It’s important to maintain consistent discount rates and regularly update your calculations to reflect current market conditions.
How To Calculate the BCR?
To calculate an accurate BCR, you’ll need to understand the basic BCR formula as well as the key input parameters that influence your results.
When gathering your input data, you must consider all quantifiable gains, including direct revenue, cost savings, and indirect advantages, along with both initial and ongoing expenses throughout the project’s lifecycle.
Your assumptions about discount rates, timelines, and risk factors will greatly impact your BCR calculations, so it’s important to document and validate these parameters with stakeholders before proceeding.

Centralize all documentation and project parameters needed in Productive.
BCR Formula
Calculating the BCR is done with a straightforward formula that helps managers evaluate investment decisions. The magic formula goes like this:
BCR = PVB / PVC
Remember to discount all future cash flows to their PV.
To implement this formula, you’ll first calculate the PV of all expected benefits, including revenue streams and other positive outcomes. Then, you’ll determine the PV of all costs, such as initial investments and ongoing expenses.
The resulting ratio provides a clear indicator of project viability, with the ratios above 1 signaling potential profitability.
Input Parameters and Assumptions
When gathering data for your BCR analysis, you should take into account both quantitative and qualitative factors. Make sure that your assumptions reflect real market conditions and stakeholder perspectives.
- Monetary profits must be quantified using market research and stakeholder input.
- Cost estimations should incorporate both direct and opportunity costs.
- Discount rates need to reflect the time value of money and risk adjustments.
- Data quality and reliability must be verified to support all assumptions.
Quickly assess ROI across sales stages with Productive’s deal tracking.
Projected Cash Flows
Always map out expected profits and expenses over your project’s lifetime. Here, you also need to consider the worth of the invested time.
Here are the basic expenses that you need to take into account when analyzing cash flows:
- Initial capital budgeting investments and startup expenses
- Recurring operational expenses and maintenance fees
- Expected revenue streams and financial gains
- Indirect gains such as increased productivity or higher market share
Afterwards you’ll discount these cash flows to PV using an appropriate rate that reflects your organization’s cost of capital. This systematic makes sure that you’re comparing profits and expenses on equal terms, accounting for both monetary and non-monetary factors in your analysis.
Discounted Cash Flow Analysis
Discounted Cash Flow (DCF) analysis transforms complex financial decisions into straightforward, measurable outcomes.
When you’re evaluating a project, you’ll need to forecast future cash flows and discount them back to their PV using an appropriate discount rate, typically your company’s weighted average cost of capital (WACC).
DCF comes in particularly valuable when comparing different investment options. For instance, if you’re considering two business opportunities with varying cash flow patterns, DCF helps you determine which one offers better profits today.
How To Perform a Cost-Benefit Analysis?
To perform a cost-benefit analysis, you’ll need to identify all expenses and profits, convert future values to PV using an appropriate discount rate, and then divide the sum of discounted benefits by the sum of discounted costs.
Don’t forget to apply the discount factor to each year’s values before performing the final calculation.
You’ll see how the BCR works in practice by examining projected cash flows over a project’s lifecycle and applying discounted cash flow analysis to account for the time spent. Always include how much this time is worth (in monetary terms).
Below is a step-by-step process that walks you through the calculation using realistic numbers so that you can replicate the method in your own work.
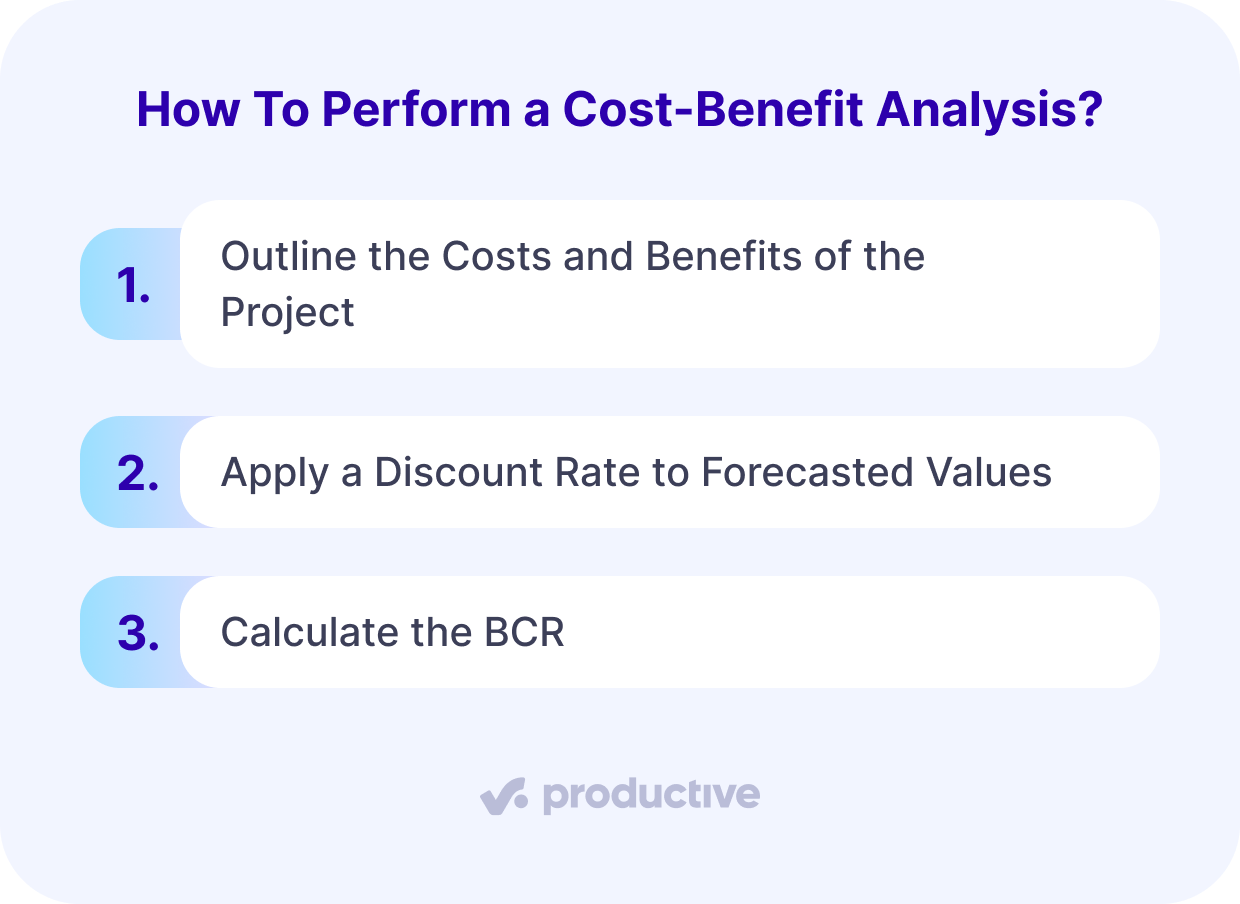
Step 1: Outline the Costs and Benefits of Your Projects
Start by identifying every cost and benefit that your project will create throughout its lifecycle. Be thorough here—underestimating costs or overhyping profits is a quick way to get misleading results.
Include these common project costs:
- Upfront investments (software, equipment, onboarding)
- Ongoing operational costs (labor, licenses, infrastructure)
- Training, support, and potential downtime
And don’t forget the potential rewards:
- Increased revenue from better performance or reach
- Cost savings through automation or process improvement
- Time savings that can be monetized
- Non-monetary gains (brand perception, market positioning)
You’ll need to assign dollar or euro values to every item, even non-monetary ones, using estimates based on past project data, industry data, or expert input.
Step 2: Apply a Discount Rate to Forecasted Values
Once you have the projected values, you’ll adjust them to their PV. This accounts for the fact that money today is worth more than money tomorrow.
Use the formula from earlier to discount each future value:
PV = FV/((1+r)^t)
Where:
- PV = present value
- FV = future value
- r = discount rate (typically your cost of capital or WACC)
- t = amount of years in the future
You can do this manually or use the NPV() function in Excel or Google Sheets.
Step 3: Calculate Your BCR
Once you’ve discounted your cash flows:
BCR=Total PVB / Total PVC
This will give you a clear, single value. To recap:
- A BCR above 1 means your project’s gains outweigh its costs
- A BCR below 1 indicates potential financial loss
- A BCR of 1 suggests break-even—only worth pursuing if a strategic value exists elsewhere
Now, let’s do the math on an imaginary scenario of developing a new internal tool for time tracking.
BCR Example: Project Rollout for a New Internal Tool
Let’s say your team is considering a tool that automates time tracking. Here’s a simplified forecast:
Costs:
- Upfront implementation: $40,000
- Annual operating costs: $5,000 per year for 3 years
Expenses:
- Time saved across teams: equivalent to $25,000/year in recovered hours
- Reduction in timesheet errors: $5,000/year in admin costs avoided
Discount Rate: 8%
Here’s what the math looks like:
Total PVC:
- $40,000 (Year 0)
- $5,000 in Year 1 = $4,630
- $5,000 in Year 2 = $4,287
→ Total PV of Costs = $52,886
Total PVB:
- $30,000 in Year 1 = $27,778
- $30,000 in Year 2 = $25,720
- $30,000 in Year 3 = $23,815
→ Total PV of Benefits = $77,313
The resulting BCR of 1.46 tells you that the project will return $1.46 in value for every $1.0 spent. That’s a strong signal to proceed. Additionally, you should:
- Compare multiple project proposals
- Build a stronger business case for leadership
- Prioritize initiatives based on financial return
Use Productive’s bar chart with financial metrics to refine your benefit-cost ratio with real-time financial data.
It’s always a good idea to use a project management platform like Productive to track actual project costs and time in real-time, so you can refine your BCR calculations with real data, not just forecasts.
In case you’re swamped with different PM options, you might want to check out our detailed guide on choosing PM software.
Track and forecast project profitability with Productive
How To Interpret the BCR Results?
As you already know, the BCR ratio provides a clear numerical indicator that represents the relationship between potential gains and expenses. You should always include these numbers in your decision-making process (alongside other strategic considerations).
When you’re interpreting the BCR results, you should also evaluate how the ratio reflects your project’s potential profitability and viability in quantitative terms:
- A BCR greater than 1.0 indicates your gains outweigh expenses, suggesting a profitable project.
- Your ratio’s accuracy depends on precise benefit and cost estimations
- You’ll need to take into account market conditions and external risks that could affect the ratio.
- Your project timeline influences when the expenses and profits happen.
Decision-Making Data
Making sound project decisions requires a systematic approach to interpreting BCR results. This means taking into account multiple factors beyond the raw numbers. Incorporate sensitivity analyses and examine various time horizons so that you can better understand how changing conditions might affect outcomes.
While BCR’s quantitative framework helps reduce subjective bias, don’t forget to account for intangible perks and market uncertainties that could impact your project’s success.
You’ll want to use BCR alongside other metrics like NPV and ROI for thorough decision-making.
What Are the Advantages of a BCR Analysis?
The biggest advantage of the BCR analysis is that you get an accurate evaluation based on monetary value and potential returns. This method is particularly useful when comparing multiple project options, as it provides a standardized approach to assess their relative merits and financial feasibility.
Financial Assessment
By now, you understand the importance of this powerful financial assessment tool in project management. You can use it for more than just a project cost analysis; it improves risk assessment, and strategic capacity planning.
This systematic approach gives you a clear look into project finances because it:
1. Calculates project profitability by dividing PV benefits by costs
2. Enables comparison between multiple project alternatives
3. Supports strategic decision-making through objective financial metrics
4. Integrates well with project management software for real-time data
When you’re managing complex projects, BCR’s ability to automate calculations and provide real-time data guarantees you’ll make informed decisions about resource allocation and cost control.
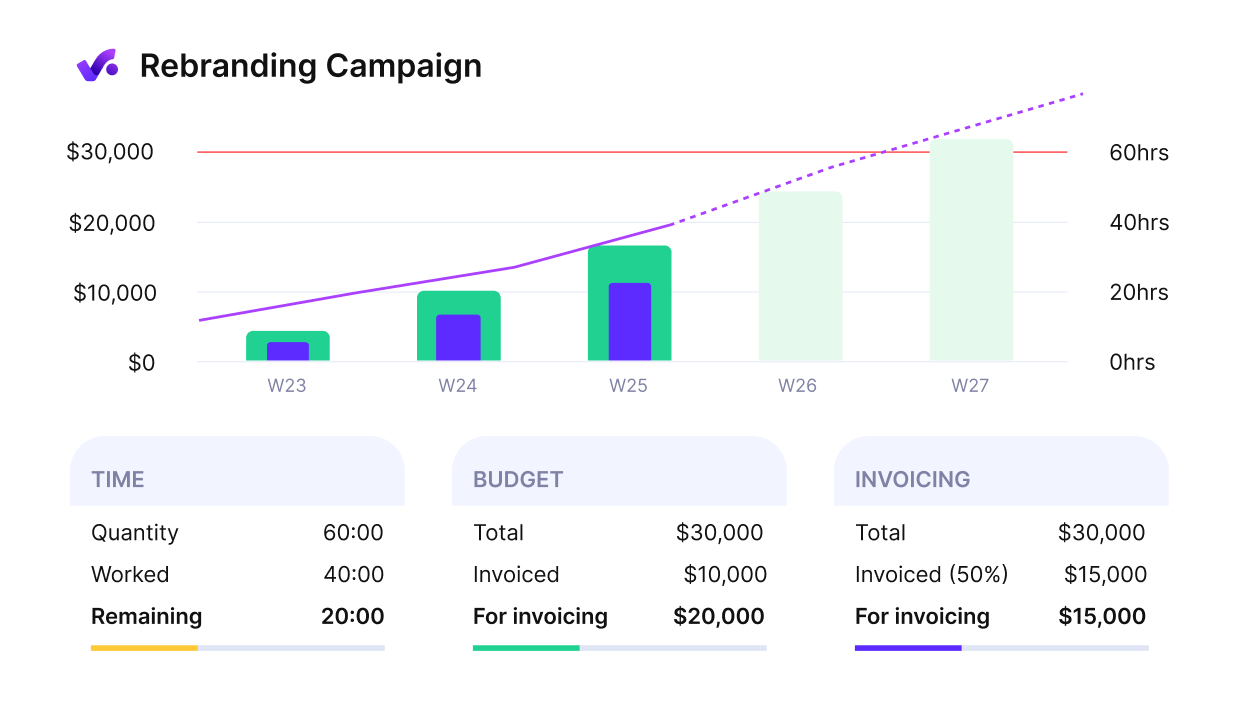
Break down budget, time, and invoicing data to strengthen your BCR analysis with precise forecasts.
Project Comparison Methodology
BCR strengthens your decision-making process by providing clear, quantifiable metrics that help justify resource allocation and project selection. The method’s flexibility allows you to incorporate both quantitative and qualitative factors, ensuring a thorough evaluation of each initiative.
When you’re documenting your analysis, BCR’s structured approach helps you maintain detailed records of assumptions and methodologies, making it easier to communicate findings to stakeholders.
You’ll also benefit from its risk management capabilities, as sensitivity analyses reveal how different scenarios might impact project outcomes.
Limitations of BCR
While BCR helps compare project profitability, it doesn’t account for absolute project size or scale, which means a smaller project might appear more favorable than a larger one with greater total profits.
The accuracy of BCR calculations can be compromised by the difficulty in quantifying qualitative gains and the potential trade-offs between cost reduction and quality maintenance.
Relative Profitability Constraints
Despite its widespread use in project evaluation, the BCR analysis has significant limitations when evaluating relative profitability across different initiatives.
When you’re evaluating using BCR, you’ll encounter several constraints that can impact decision-making accuracy:
- BCR’s simplification of complex projects into a single number often fails to capture essential nuances and contextual factors.
- The ratio is very sensitive to assumptions about cash flows and discount rates, which can lead to skewed results.
- Direct comparisons between business ventures become challenging due to varying scales and scopes.
- BCR’s focus on financial metrics might overlook significant non-monetary gains and social impacts.
Potential Quality Trade-offs
Making decisions only based on BCR can lead to significant quality compromises that affect a project’s long-term success and sustainability.
When you’re focused exclusively on improving BCR metrics, you’ll often face pressure to cut corners, use cheaper materials, or rush processes that could diminish project quality.
These trade-offs aren’t always immediately apparent, as BCR calculations typically don’t capture intangible factors like customer satisfaction, environmental impact, or brand reputation.
You’ll also need to take into account that while cost-saving measures might boost your BCR, they can result in increased maintenance expenses, regulatory compliance issues, and damaged stakeholder relationships over time.
Calculation Accuracy Challenges
The BCR is a key evaluation tool in project management that helps project managers and stakeholders make informed investment decisions. While it’s not perfect, this ratio helps you better compare investment opportunities and evaluate their financial viability.
When you’re doing the benefit-cost math remember to count-in both quantitative and qualitative factors, and don’t rely on it as your sole decision-making metric. You should use it alongside other financial indicators to develop an comprehensive project assessment strategy.
If you’re not doing it already, definitely use PM software to get the most accurate project data, budget forecasts, and project progress reports.
Get started today with a simple book a demo click.
Monitor Project Viability with Productive
Track profitability, real-time costs, revenue, and time – all in a single platform for complete project management.
