Unified Financials

We Help Your Agency Reach New Heights
Switch from multiple tools and spreadsheets to one scalable agency management system.
Billable capacity is one of the most important metrics in your agency.
The higher it is, the more of your people’s hours are billed to your clients. This metric has one of the strongest impacts on your profit margins, therefore you should use every tool at your disposal to make sure it grows constantly.
To help you manage your people’s capacity more efficiently and increase your utilization, we are introducing a significant improvement in Scheduling.
Which issue did we try to fix?
This is what your Scheduling screen looked like before.
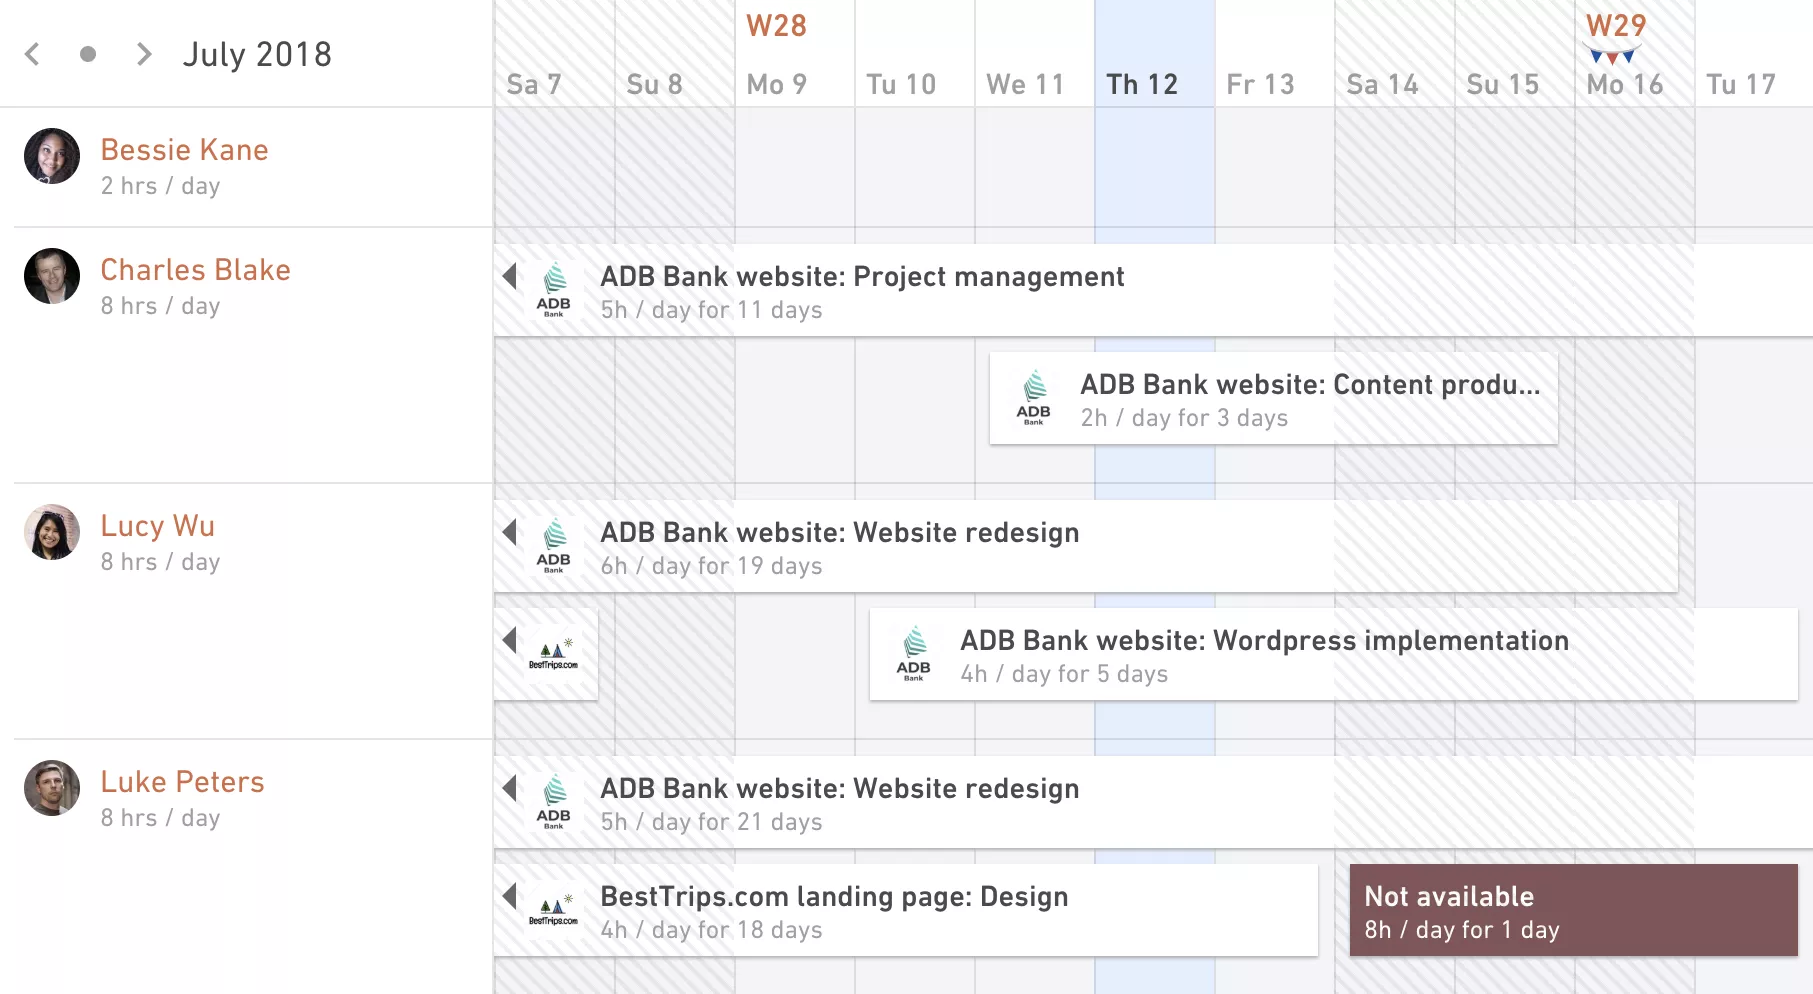
You could create bookings for your team and determine how their capacity will be spent across projects they are assigned to, which was great. This offered many benefits already:
Bird’s eye view of your company – scheduling helps you decide between taking on more work or saying ‘no’ when clients knock on your door
Helps with hiring strategy – if your entire team is booked for a very long time, perhaps it’s the right moment to hire more people
Time tracking is much easier – when people are scheduled in Productive they get automated time tracking suggestions
Progress report revenue forecast – actively scheduling people allows Productive to predict your project revenue, making it easy to see when you will reach the budget cap
But, there was one problem…If you wanted to understand whether someone is booked over or under their capacity you had to do some basic maths and calculate the hours on your own.
If your Scheduling view was cluttered with bookings, basic maths quickly turned into frustration.
How did we fix this?
This is what the same Scheduling screen looks like now.
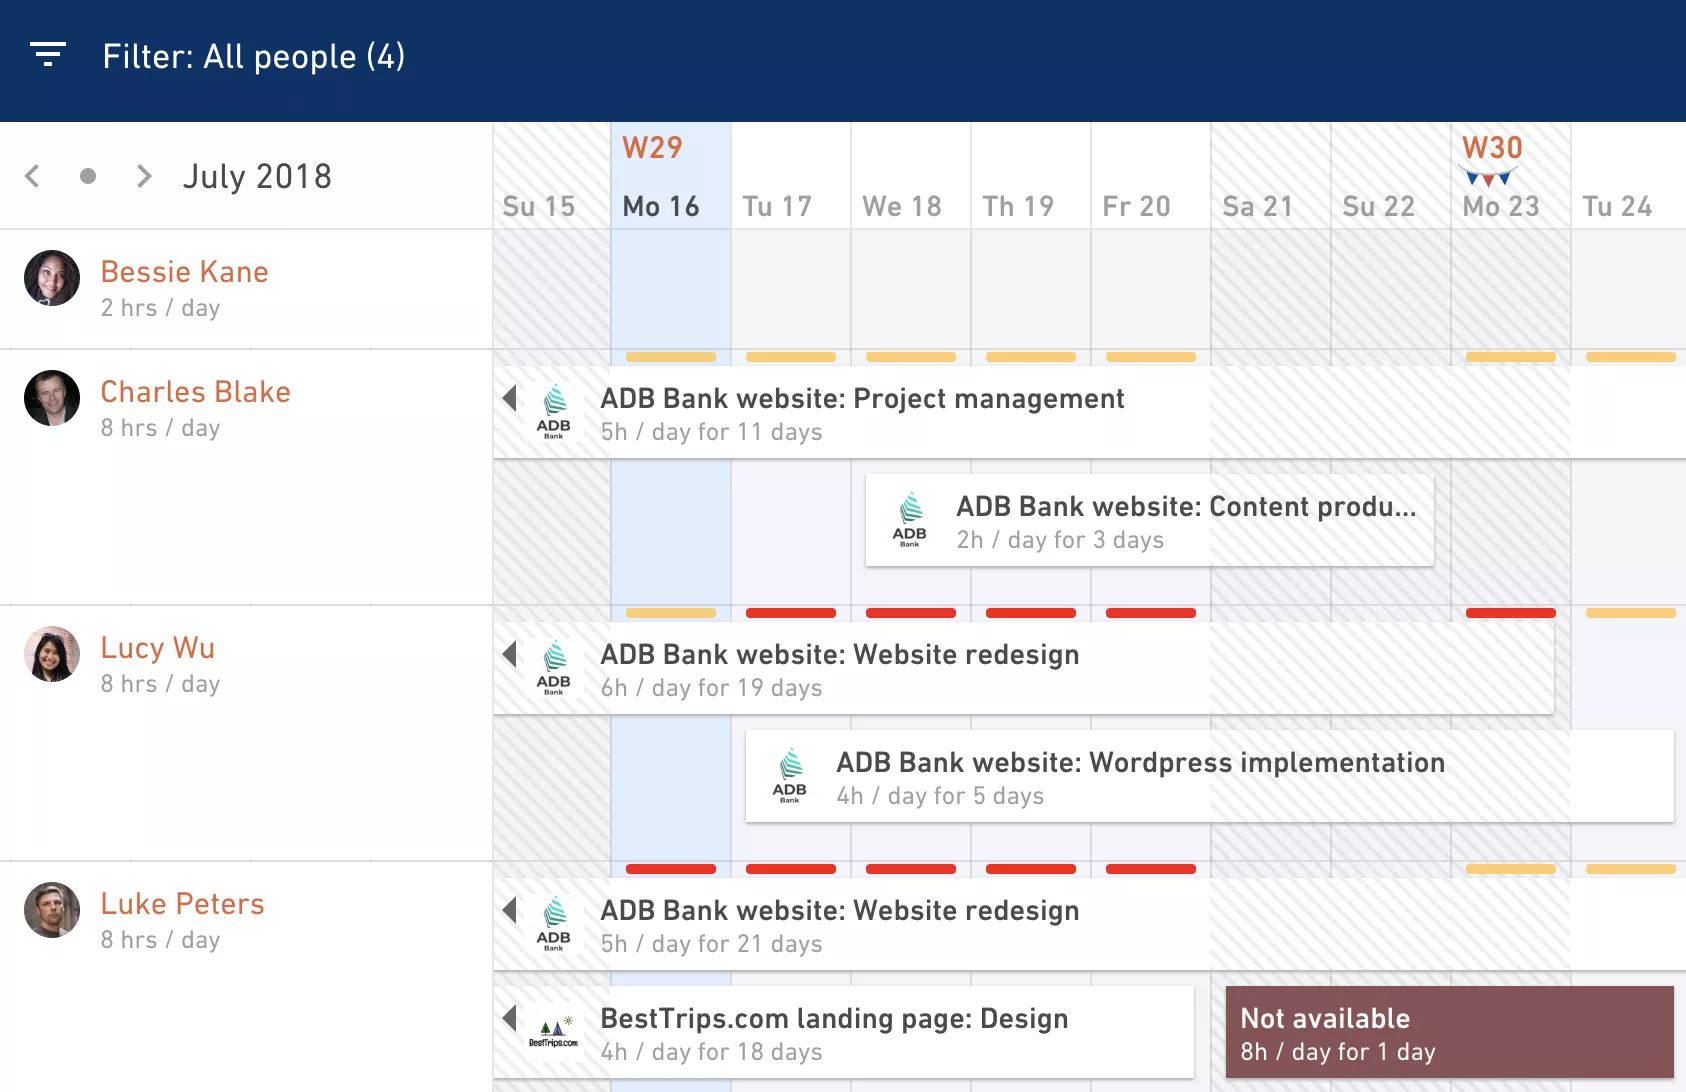
These are your bookings with the addition of booking indicators. Now you can see if someone is booked over or under their capacity at a glance. Forget the maths!
You will notice there are some colours here. This is what they tell you:
Red line – overbooked (e.g. 10/8h)
Yellow line – underbooked (e.g. 5/8h)
No line – completely booked ( e.g. 8/8h) – best case scenario
If you want even more information about a particular booking, you can hover the booking indicator to find out more.
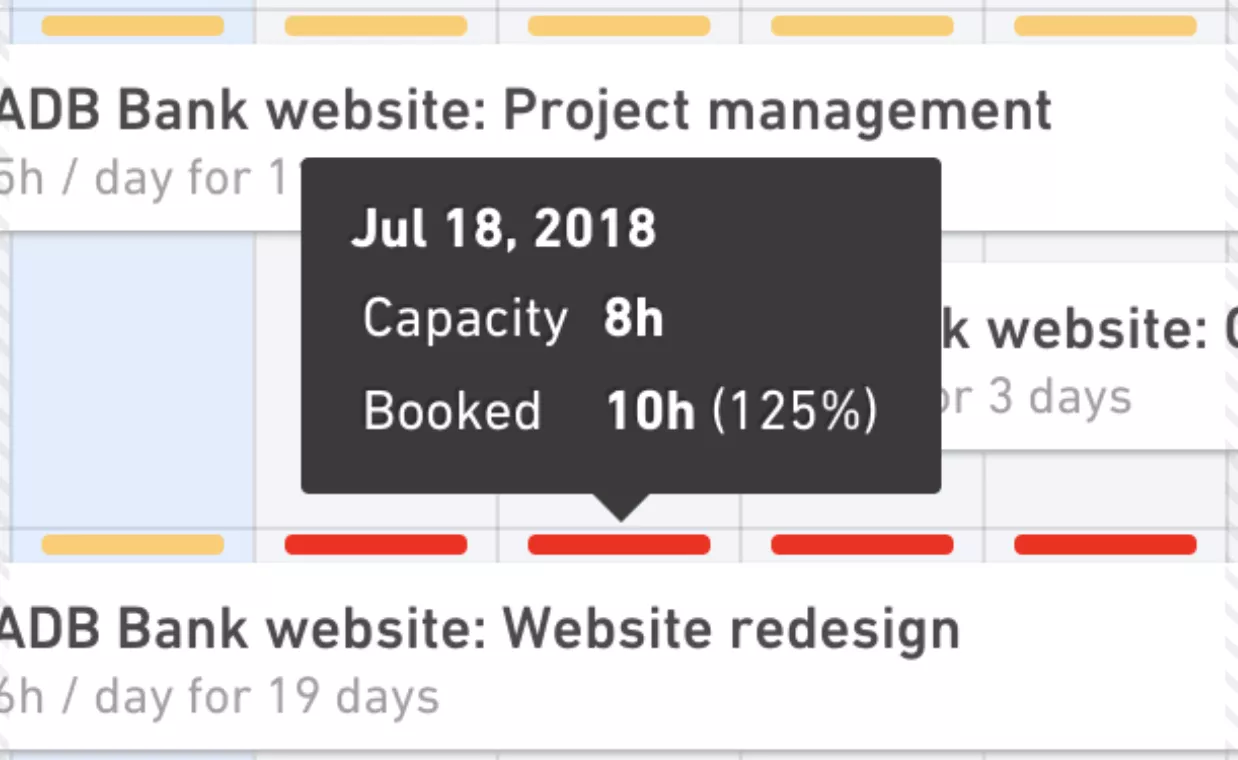
This tells you that the daily capacity of this person is 8 hours and you booked him for 10 hours (2 hours over capacity).
Which additional benefits does this bring to the table?
Your people are happier – overbooked people are often under stress and prone to generating overtime for your company (a metric you should keep low)
You earn more money – if your people are underbooked you are not using their full potential, therefore you are earning less than you could with better planning
Booking indicators make it so much easier for you to improve billable utilization. Just think about that metric the next time you open up a screen filled with bookings that are red or yellow. Think of the unused potential, or all the people who are loaded with more work than they can handle.
Having a visual understanding of these issues at a glance will help you plan more efficiently and improve your numbers significantly. Everyone loves bigger numbers (unless they’re overtime).


