All About the Schedule Performance Index in Project Management (SPI)

In this article, we’ll discuss key terminology for understanding the schedule performance index in project management and other variance analysis formulas, and provide practical examples of how to use schedule performance for better project management.
Key Takeaways
- SPI measures project schedule efficiency by using the formula SPI = EV/PV
- Values range from over, under, and equal to 1 and depict whether a project is on track with planned schedule
- Combining SPI with other key metrics (SV, CPI) provides project teams and managers with an overview of their entire project
- Regular SPI monitoring at key checkpoints helps identify schedule deviations early, enabling project managers to quickly implement improvements
What Is the Schedule Performance Index in Project Management?
The schedule performance index is a metric in project management that helps project managers monitor project timelines and efficiency.
SPI works by comparing work completed (known as earned value) and work planned (known as planner value).
The result is an index which can be under, over, or equal to 1, in case of perfectly balanced timelines.
SPI is part of earned value management, a comprehensive methodology which analyzes three project performance factors: schedule, cost, and scope.
Schedule Performance Index Formula
Here’s the schedule performance index formula:
work completed (EV) / work planned (PV) = schedule performance index
It’s a simple formula, but you’ll need to calculate two other metrics to get your result:
Step One: How to Calculate Earned Value
EV represents the value of all completed work at any given point in your project timeline.
To calculate it, you’ll be using the following formula:
percentage of work completed x original budget of the project = earned value
So, if your project budget is $15,000, and you’ve completed 20% of your work, EV amounts to 0.20 x 15,000 = $3,000.
Having a software system that can help you manage your project progress is valuable for calculating metrics in project management. With Productive, you can track billable hours against your budgets and see profitability and revenue in real time.
Control project schedule performance with Productive
Step Two: How to Calculate Planned Value
The formula for planned value is very similar to EV. But, instead of percentage of work completed, you’ll need the percentage of work that you were planning to complete by a certain point in time.
Here’s the planned value formula:
percentage of work scheduled for completion x original budget = planned value
So, if you scheduled 25% of work to be completed at that time, that means that your PV is 0.25 x $15,000 = $3,750.
Project managers can use Gantt charts and other techniques in the project planning phase in order to create a schedule baseline for their project, which can then be used for these types of analyses.
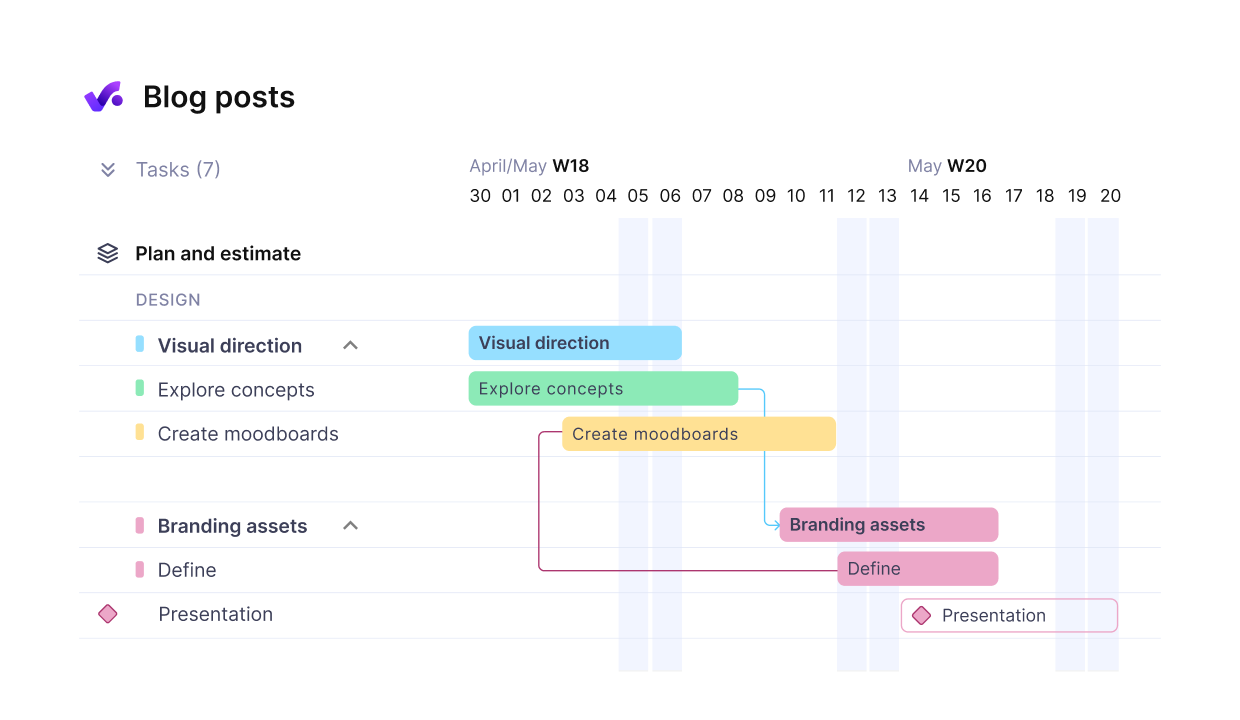
Visualize progress with Productive’s Gantt chart
Step Three: Calculating SPI
Now that we have all of the necessary components, we can go back to calculating our schedule performance index.
- Earned value = $3,000
- Planned value = $3,750
The SPI is:
3,000 / 3,750 = 0.8
Examples of SPI Values
Here are some example calculations to show you the full range of schedule performance index values:
- If you’ve got a $250,000 planned value but only achieved $200,000 in earned value at a certain point in time, your SPI of 0.8 means that the project is being completed slower than expected.
- If your planned value is $300,000 and your earned value is also $300,000, your SPI is an exact 1.0. This means that the project is progressing according to your original schedule.
- If your PV is $400,000, but your EV is $450,000, your SPI is 1.125. This indicates that work is being completed slightly faster than expected.
How to Use SPI
Now that you know the basics, you’re probably wondering how the schedule performance index is used in practice.
Since it’s used in various types of industries, from the construction industry to professional services, a one-size-fits-all external benchmark doesn’t really exist.
However, it can be very useful as an internal benchmark.
By analyzing SPI patterns and applying these findings to future projects, project managers can gather reliable insights for predicting future outcomes and making data-driven decisions.
For example, you can try to detect:
- How deviations at a specific period (for example, 50% of completion) impact project delivery overall
- Whether specific project consistently see delays at a certain point, which can point to process inefficiencies or resource gaps
- How early schedule delays impact the rest of your progress—are they usually recovered later, or do they lead to bigger and bigger setbacks
- The impact of resource allocation, whether adjusting materials or employees in response improves your SPI and to which extent
These are just a couple of examples that can help you get the most out of your performance metrics.
Benefits of Calculating Schedule Performance
According to research on the construction industry by R.B. dos Santos and A. E. Jungles, it was found that the SPI of projects with schedule delays is significantly different from that of projects that are delivered on time.
This means that the schedule performance index can be a great tool for calculating your risk management—consider incorporating it into your risk register.
On the other hand, another research by S. Kim on construction projects showed that SPI had a high chance of deviations from its baseline index of 1.0 throughout a project’s lifetime.
In comparison, successful projects showed a relatively stable CPI. This suggests that, while SPI is useful for tracking schedule performance, it might not be the best sole indicator of project success.
Combining SPI with other metrics provides a comprehensive view of a project’s overall health, helping project managers make more informed decisions and mitigate risks effectively.
Understanding Other EVM Metrics
Here’s a quick comparison of project management metrics:
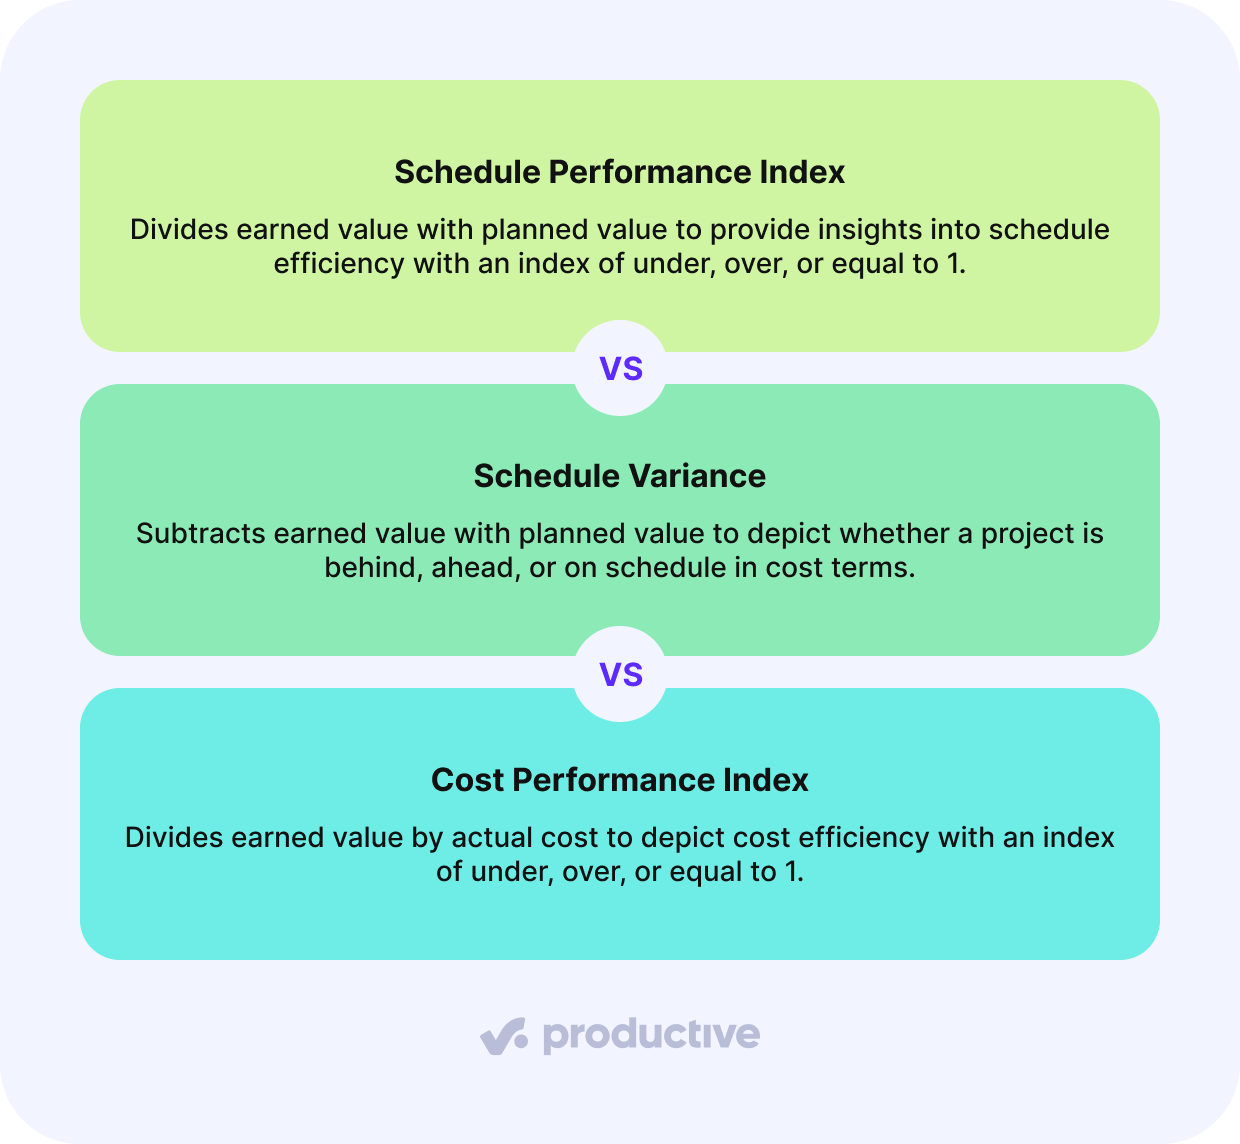
1. SPI vs Schedule Variance
Schedule variance is a closely related metric to SPI, as they both take schedule adherence into account, but approach it from different angles.
Schedule variance is calculated by subtracting earned value from planned value. Instead of an index in the SPI formula, the result of SV is a value expressed in cost (money) terms.
So, if your earned value at a point in time is $5,000, and your planned value is $6,000, that means you’re at a -$1,000 loss.
When to use them:
- SV is useful for understanding the absolute impact of delays
- SPI is useful for comparing schedule efficiency and making relative comparisons
2. SPI vs Cost Performance Index
The cost performance index (CPI) calculation is related to SPI, but focuses on cost metrics.
CPI is calculated by dividing earned value by actual cost (AC). This is the sum of all expenses and costs incurred by a particular point in time.
So, if your EV is $5,000 and your AC is $6,000, that means your CPI is 0.83, indicating you’re overspending.
CPI and CV have the same relationship as SPI and SV. Check out our article on cost variance in project management for more information.
When to use them:
- SPI shows how efficiently a project is progressing according to the planned schedule
- CPI is a measure of cost efficiency and helps determine whether you’re staying within budget
When to Calculate Schedule Performance
You’ll need to calculate your SPI at regular checkpoints, ideally integrating these measurements with your project management software for real-time tracking and analysis.
Here are some important checkpoints for ensuring that you’re tracking the actual progress that project teams are making:
- Run calculations at all major milestones to assess progress against baseline expectations (for ex. design, development, testing, launch for software development)
- Perform regular interval checks based on your project’s duration and complexity
- Review your index whenever significant schedule updates occur or after completing critical path activities
Tracking SPI at these checkpoints allows you to forecast completion dates more accurately and implement corrective measures before minor schedule variances become major delays.
3 Tips for Better Project Performance
Here are three useful tips and project management techniques that you can use for supporting actual performance:
- Consider different project management techniques depending on the type of project you’re working on. For example, rolling wave planning is an iterative approach that can be very useful for situations where you know what needs to be done in the short-term, but future details are vague (due to complexity or other factors).
- Monitor KPIs regularly to stay on track. Keeping an eye on profit margins or resource utilization can help you monitor how your business performs during project delivery, which safeguards stable operations and growth.
- Utilize project management software for better coordination and tracking. Software can streamline scheduling, task assignments, and progress monitoring, and a tool which does all of this in one can support your SPI calculations and more.
Monitoring Your Project Schedule With Productive
SPI is an essential metric in the project management toolkit, helping project teams stay on track and within budget.
With project management software such as Productive, you can manage all aspects of your business performance.
Get full project visibility
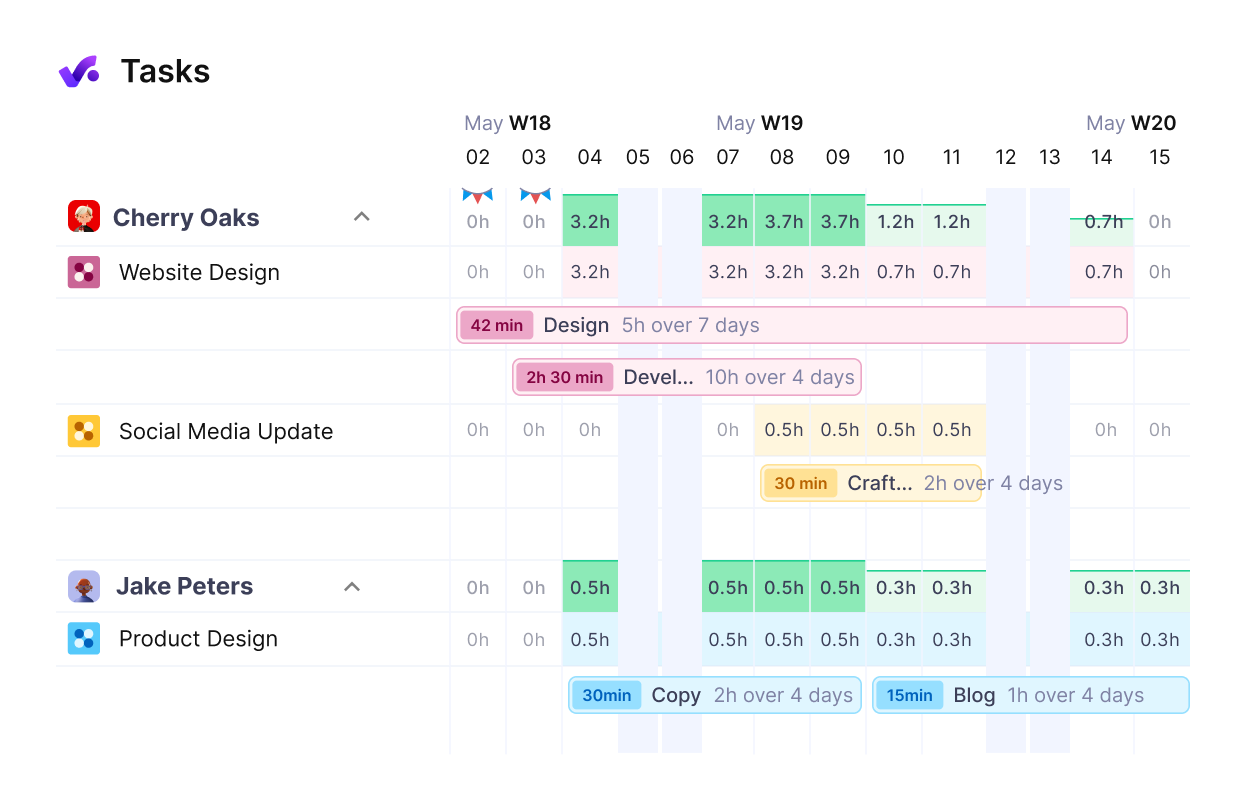
First, organize your project within Productive’s Gantt, Workload, Kanban, or other view to visualize your projects. Then, break up larger milestones into tasks and track time against them to manage your billable time.

Understand where your hours are going
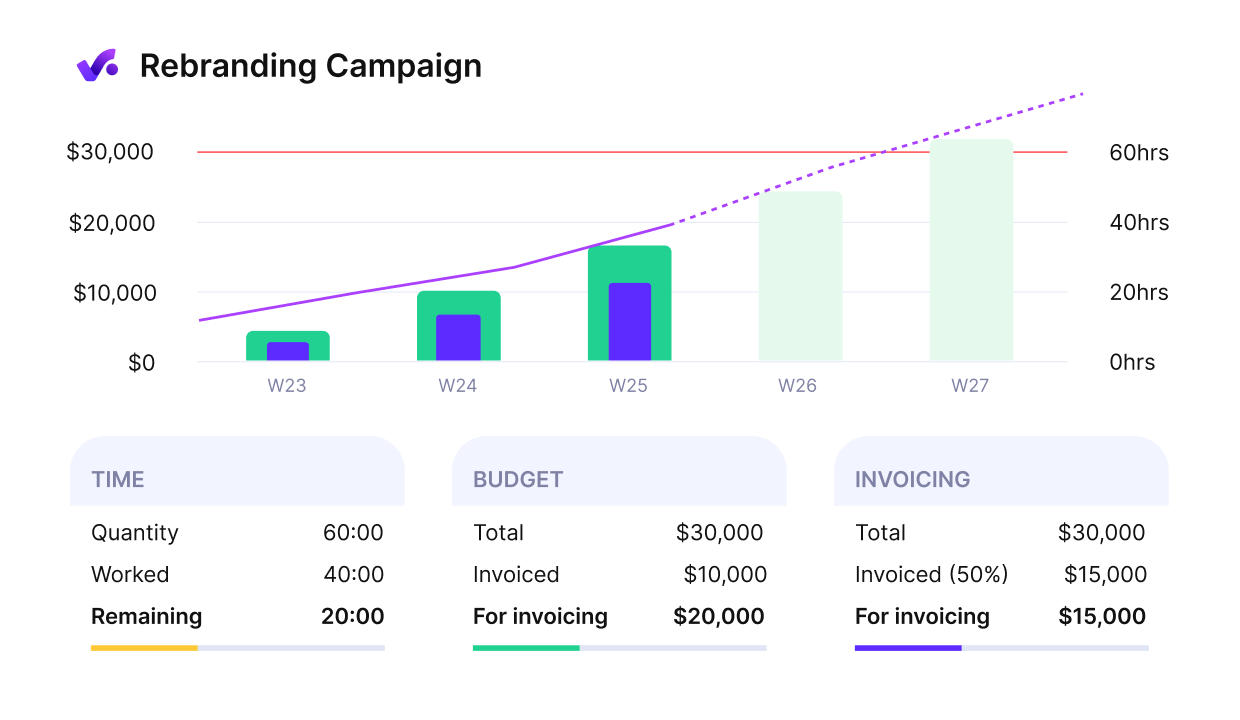
Within Productive’s Budgeting and Profitability charts, you can view your finances in real time. Productive includes overhead management and expense tracking for more accurate insights.
Monitor key data
Finally, Productive also includes resource planning for allocating resources based on capacity and availability. With the Scenario Builder, you can model different scenarios to make data-driven decisions for the future.
Book a demo with Productive to learn more about its benefits for professional services businesses.
Optimize Project Performance With Productive
Keep your projects on schedule and within budget with Productive’s all-in-one project management and financial planning features.
