Revenue Per Employee: How to Calculate and Improve It

Before you approve the next hire, someone could ask what each person already brings in. Revenue per employee is total revenue divided by headcount, and in professional services it shows how much of your revenue each person’s time produces.
This guide covers what it measures, how to calculate it, what firms average, how to read a change, how to improve it, and where it misleads you.
Key Takeaways
- Revenue per employee is total revenue divided by headcount: in a services firm, it shows how much of your revenue each person’s time produces.
- Professional services firms worldwide averaged $168,000 in revenue per employee in 2025: treat it as a reference point rather than a target.
- Billable utilization, unbilled work, and your mix of billing to non-billing staff are what can change RPE: the first two get more revenue from the team you have, and the third is about who you hire next.
- Revenue per employee is not a profit measure: it counts revenue before salaries, rent, and overhead. A firm can post a strong figure and still lose money.
What Is Revenue Per Employee?
Revenue per employee (RPE) is total revenue divided by the number of employees. In a services firm, it measures how much of your revenue each person’s time produces.
Some firms call it revenue per headcount or revenue per FTE. It is the same productivity metric under a different name, and a rough read on workforce efficiency.
Revenue per employee behaves differently in professional services than in a product business. A software company can grow revenue without adding staff. You cannot bill more hours than your people can work, so your ceiling is set by capacity rather than by demand alone.
If you want to see the other numbers worth tracking, our guide to professional services KPIs and their formulas runs through them.
The formula is one line. Both inputs need care.
How Do You Calculate Revenue Per Employee?
You calculate revenue per employee by dividing total revenue by your number of employees.
The formula for calculating RPE:
Revenue per employee = Total revenue ÷ Number of employees
The period does not matter as long as you keep it consistent, whether you run the calculation on a quarter or on a year.
For firms with part-time staff, full-time equivalents give a truer denominator than a raw headcount. The table below works it through.
| Line | Amount |
|---|---|
| Total revenue | $9,200,000 |
| Full-time staff | 36 |
| Part-time staff (eight people at 0.5) | 4 |
| Full-time equivalents | 40 |
| Revenue per employee | $230,000 |
Decide how you count contractors, and never change it. Full-time staff count as one each, part-timers as fractions of a full-time equivalent. Contractors are the judgment call, and for firms that lean on a freelance pool it is a big one.
Take a 27-person agency with $5.4M in revenue that also uses freelancers, enough to put 40 people on client work. Divide by 27, and the figure is $200,000. Divide by 40, and it is $135,000.
Same firm, same revenue, two very different numbers. If someone bills client hours all year, count them.
Once your own figure is clean, the question is what to compare it against.
What Is the Average Revenue Per Employee?
Professional services organizations worldwide averaged $168,000 in revenue per employee in 2025. That comes from Statista’s professional services benchmark, published in May 2026.
If you are asking how much revenue an employee should generate, the answer depends on your rate card and your billable mix.
Treat the average revenue per employee ratio as a reference point rather than a target. It is global, so it blends markets with very different rate cards.
It also spans a wide definition of professional services: accounting, advertising and marketing, architectural, management consulting, engineering, IT, legal, and research. Spanning that many sectors makes any sector comparison rough, since a creative agency and a legal practice sit inside the same average.
Track the direction over four quarters rather than the single figure. Next, we will cover what a change is telling you.
Why Does Revenue Per Employee Matter for Services Firms?
Revenue per employee matters because it flags a pricing problem, exposes unsold capacity, and shows when growth is not paying.
To be clear about where these come from: they are our own reasoning. Your number could move for reasons we have not listed here.
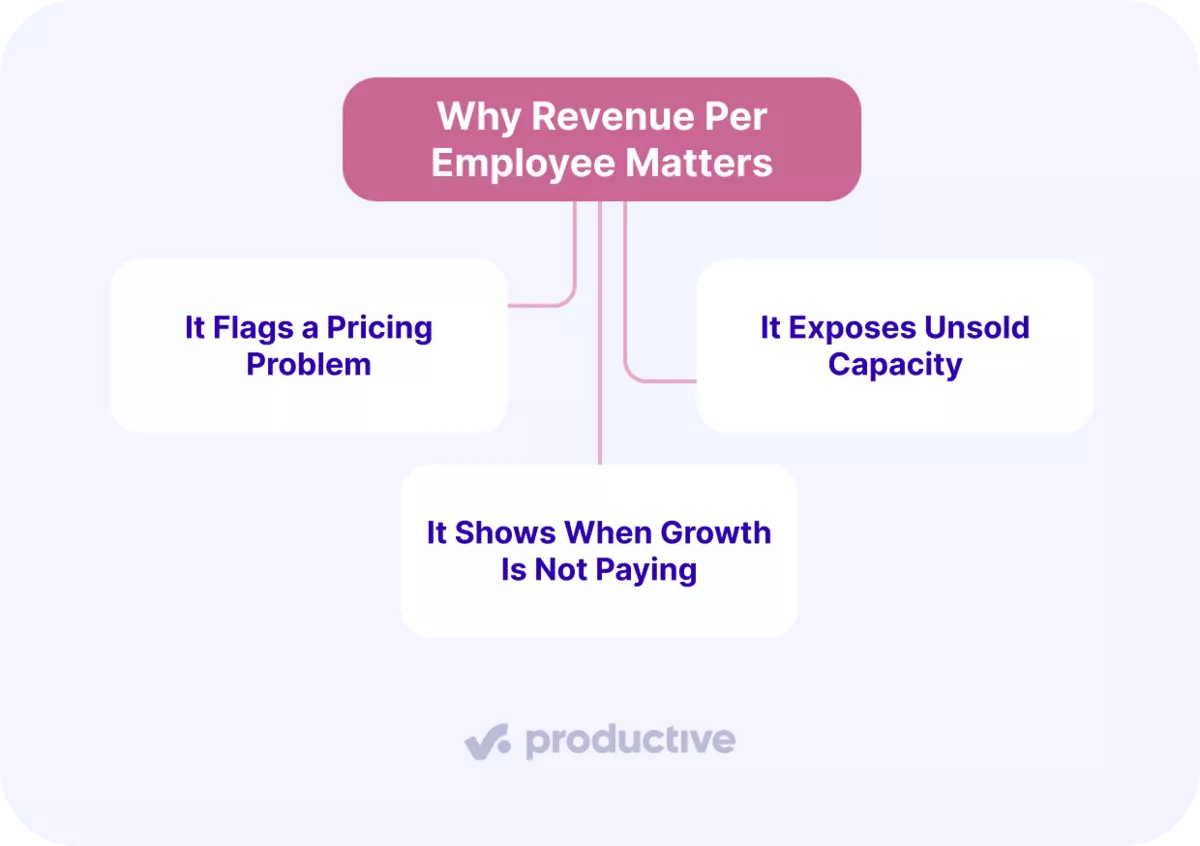
We’ll take a closer look at each.
It Flags a Pricing Problem
A falling RPE while everyone is busy points to price, not employee productivity. The hours did not change, so the money attached to them did.
Rule out unbilled work first. Say your team logged 1,200 hours this quarter, the same as last, but only 1,050 reached an invoice. One hour in eight never got billed, and revenue falls without a single rate changing. If billed hours track logged hours, your rates are the problem.
It Exposes Unsold Capacity
A falling RPE while people have capacity gaps means you are paying for time you cannot invoice. This is a sales problem before it is a staffing problem.
One reaction is to freeze hiring, but that does nothing for the quarter you are already in. Those people are on payroll either way. Filling their calendars changes the number this quarter, and cutting the next role does not.
It Shows When Growth Is Not Paying
A rising RPE with flat margin means you are earning more per person and keeping none of it. The extra revenue goes straight back out as delivery cost.
This one gets missed because a rising number looks like good news. You win bigger projects, staff them with senior people, bring in contractors to cover the load, and revenue per head climbs. Profit per head stays where it was.
Next, we will take a look at how to improve RPE.
How Do You Improve Revenue Per Employee?
You improve revenue per employee by raising billable utilization, catching budget overruns before they turn into write-offs, and growing your delivery team faster than your overhead. We’ll take a closer look at each.
Again, these three are our own selection rather than a finding from research. Other decisions move the number too.
Raise Billable Utilization
Utilization decides how much of the time you already pay for turns into fees. It works on capacity you are already paying for, whether or not you win another client.
For example, take a ten-person team charging $150 an hour with 1,600 sellable hours each. The rate and the hours here are made up. The utilization figures are not.
At 80% utilization, each person bills $192,000 a year. At the 66.4% that SPI Research reported on EIN Presswire as “the lowest level recorded in SPI Research’s 19-year history,” each person bills $159,360. Across ten people, that is about $326,000 a year, with no change to the rate card.
The lever only works if you can see current utilization, and that is the part firms tell us they struggle with. One agency operations lead told us they already fight to get people to enter time, and anything that adds friction loses ground.
With Productive’s Time Tracking, people track time against services inside a budget, and you can choose to bill a portion of the time logged.

Track billable time in Productive.
You can then set a utilization target per employee and report the gap against what they actually billed.

In the past, we were planning month-by-month; now we’re doing 90-day rolling forecasts on utilization to have way better utilization and, at the end of the day, better billability and also more ease for the team.
Catch Budget Overruns While You Can Still Bill Them
On fixed-fee, retainer, and capped work, hours that go over the budget is revenue you never charged for. Catch it while the work is live, and you can raise a change order.
Catching it early means watching budget consumption while the work is still running, not at month-end. One agency finance lead told us they see profitability by department but not by client. That leaves them unable to say which account is dragging them down.
If you would rather be told than go looking, you can configure a Budget Watcher, one of Productive’s AI agents. It monitors project budgets and posts a comment to the budget feed, tagging the budget owner and project manager when spending crosses a threshold you define.
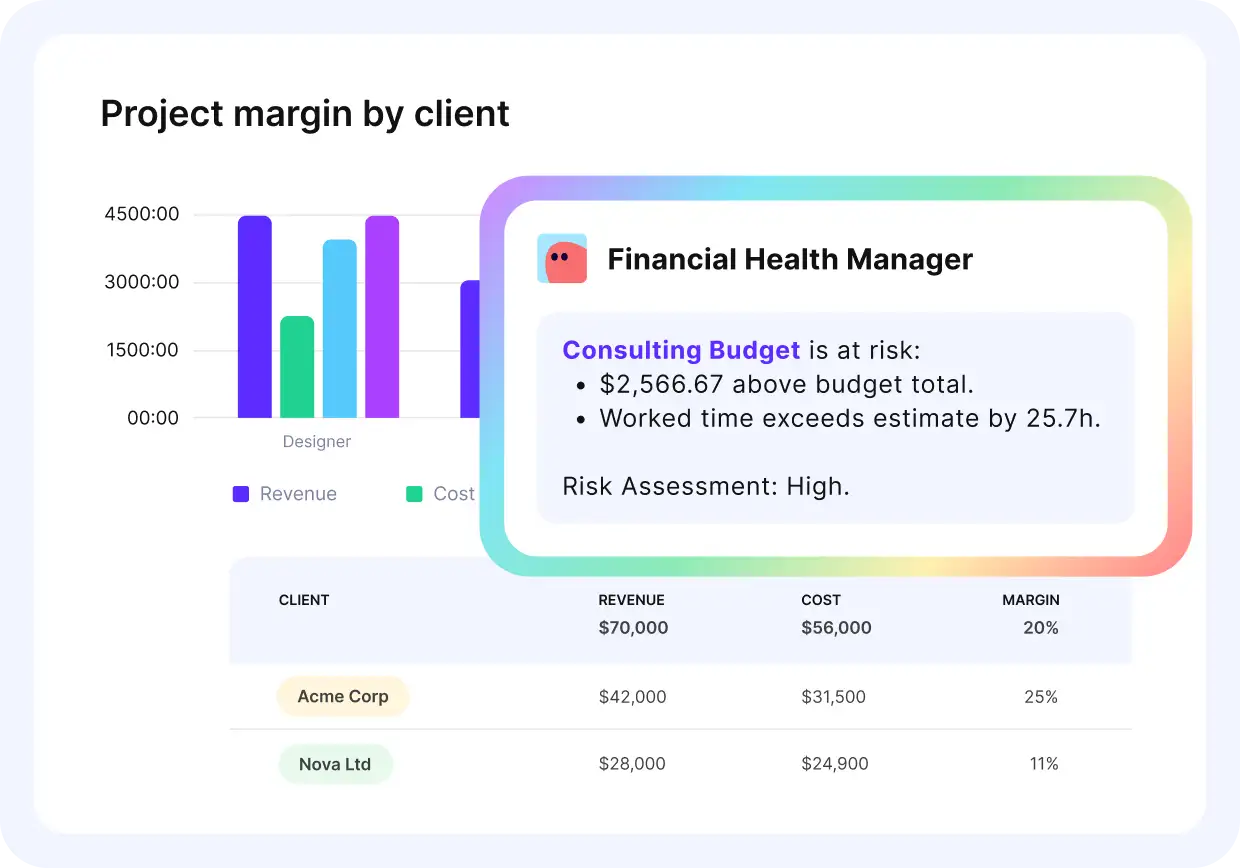
Let AI Agents monitor your budgets.
For a wider view of the category, see our review of project budget management tools.
Grow Your Delivery Team Faster Than Your Support Team
Expect the ratio to dip every time you hire someone who does not bill. A finance lead or a second project manager divides the same revenue across more heads, so the number falls the day they start.
That is not a reason to avoid the hire. Support roles are what let the billing side grow at all. It is a reason to know the dip is coming, and to time the hire against work you have already won. Otherwise, you read the drop as a problem months later.
Pulling all three levers still leaves one thing the ratio cannot tell you.
What Is the Main Limitation of Revenue Per Employee?
The main limitation is that revenue per employee ignores your own costs. It counts money coming in before labor costs, contractor pay, and overhead come out. A firm can post a strong number and still lose money.
To help understand this, we can look at what happens to profit as firms grow. Promethean Research’s analysis of digital agency profitability found that “in 2025, the average digital agency earned a 13% after-tax net margin”.
That average hides a steep gradient, and it tracks company size. “Studios with fewer than 10 full-time employees averaged 19% after-tax net margins in 2025”, against 12% at 10 to 24 people, 9% at 25 to 49, and “agencies with 50 or more FTEs averaged 8%”. In that sample, profit margin fell as firm size rose.
A larger agency can bill more per head than a studio and still keep less of it. Revenue per employee and profit per employee can move in opposite directions, which is why the revenue per employee ratio should never be read alone. Track profit per employee beside it.
That means costing your people properly, overhead included. Productive’s Expense Management allows you to add overhead costs on top of your employees’ salaries to get a true picture of your profitability.
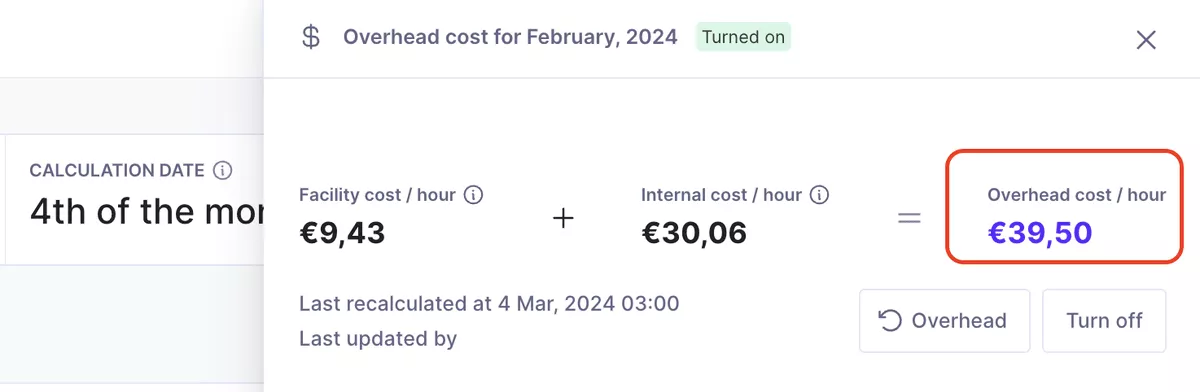
Add additional overhead costs on top of your employees’ salaries.
For more granular control, you can also calculate overhead per subsidiary if your organization has multiple locations with different operating costs.
Track overhead costs in Productive.
Keep All Your Numbers in One Place
A change in your revenue is an important question to answer. A solution is hard to find when your time, invoices, and resources live in three different tools.
The all-in-one PSA platform Productive connects time tracking, resource planning, and profitability, so the numbers come from the same data.
Book a demo with Productive to see your own utilization, revenue, and margin from one system.
Stop Rebuilding the Same Report Every Month
Productive keeps time, capacity, and margin in one platform, so the numbers behind your ratios come from the same place instead of three spreadsheets.
