Better, Faster, Stronger: Forecasting Charts and Budget Overviews


We Help Your Agency Reach New Heights
Switch from multiple tools and spreadsheets to one scalable agency management system.
As an agency owner or project manager, you’re always looking for better ways to plan projects and resources so that your revenue increases, too. You want to be able to predict your agency’s future and plan costs better.
Well, here it is: we bring you updates in Forecasting charts and Budget overviews in Productive. This will make it easier for you to visualize your agency’s future and steer it in the right direction.
Wait, I’m New—How do I Forecast in Productive?
Productive allows you to schedule staff members on various services that your clients are paying for within the scope of a project. These services come with billable rates, and staff members have their own internal cost rates.
Here’s an example of two staff members scheduled to work on the same project:
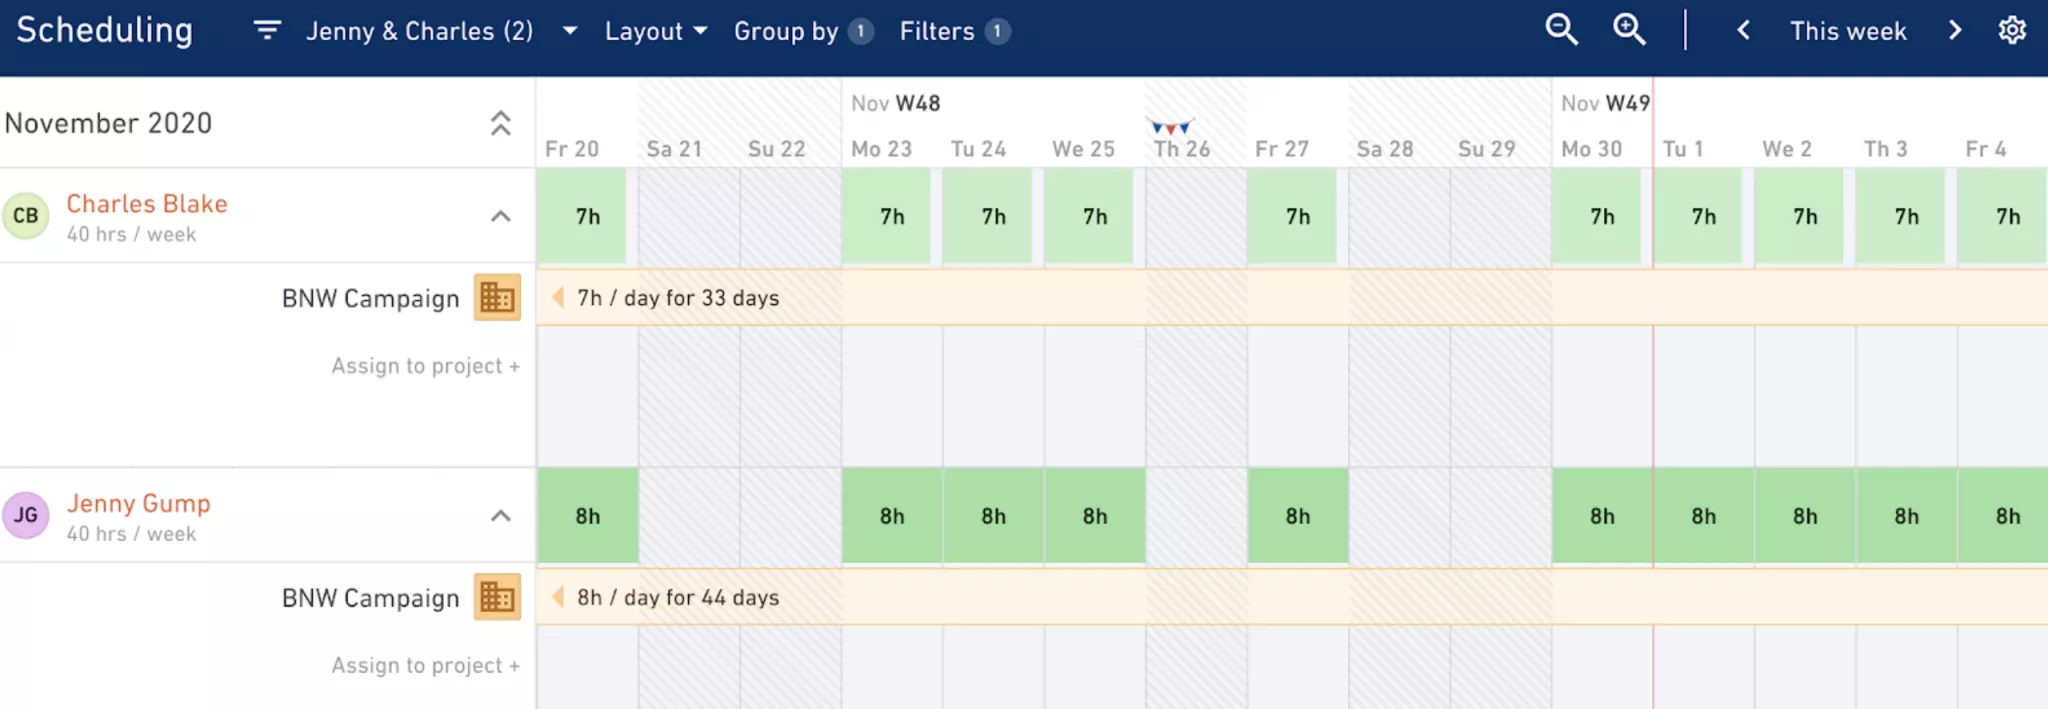
Building a schedule translates those rates into a forecasted budget/profit spend. This way, you can easily stay on top of not only actual budget and profit spend, but also peek as far into the future as you’ve scheduled your staff.
Keep reading to see those charts in action.
How to Read Forecasting Charts (Available in Productive Premium)
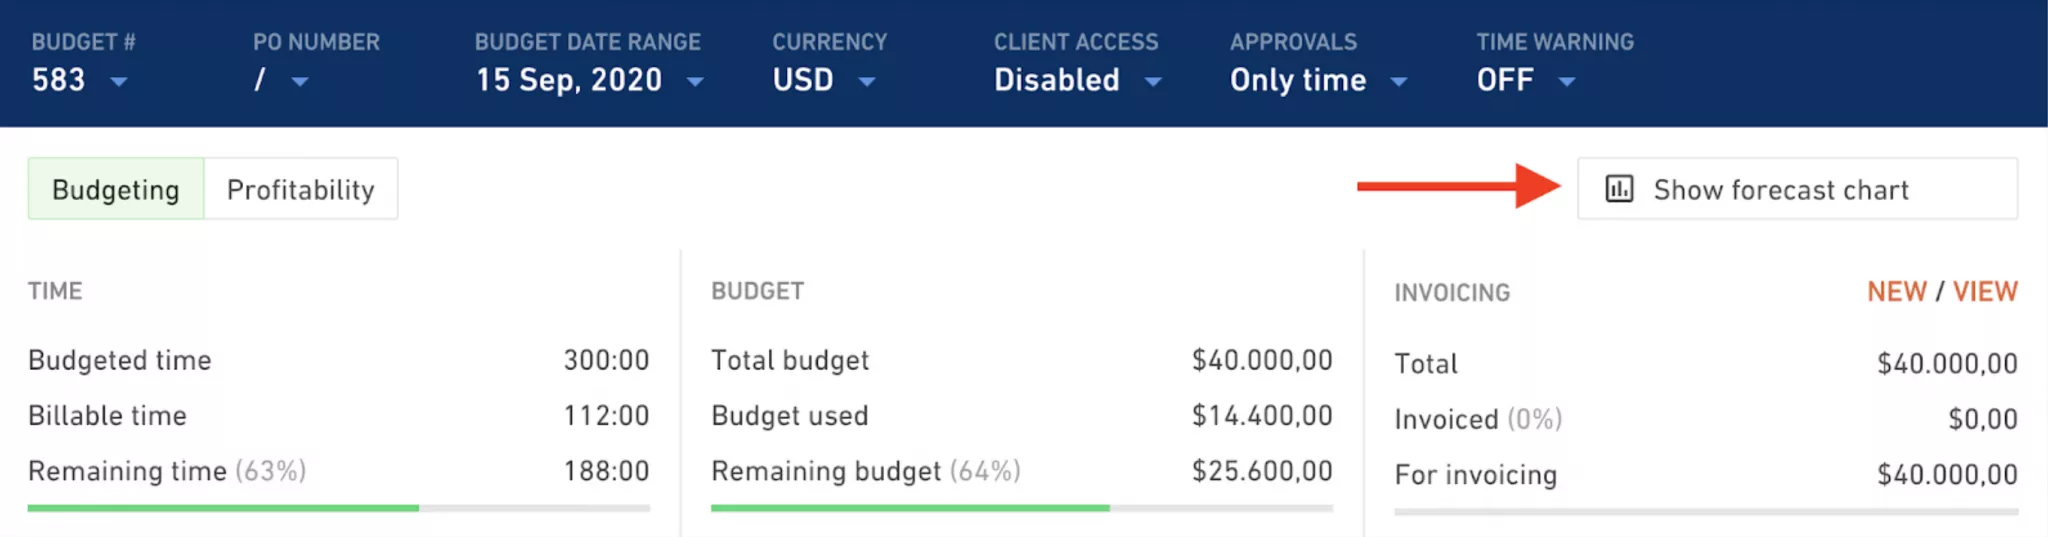
Click on the Show forecast chart button at the top right corner of this screen to reveal it:
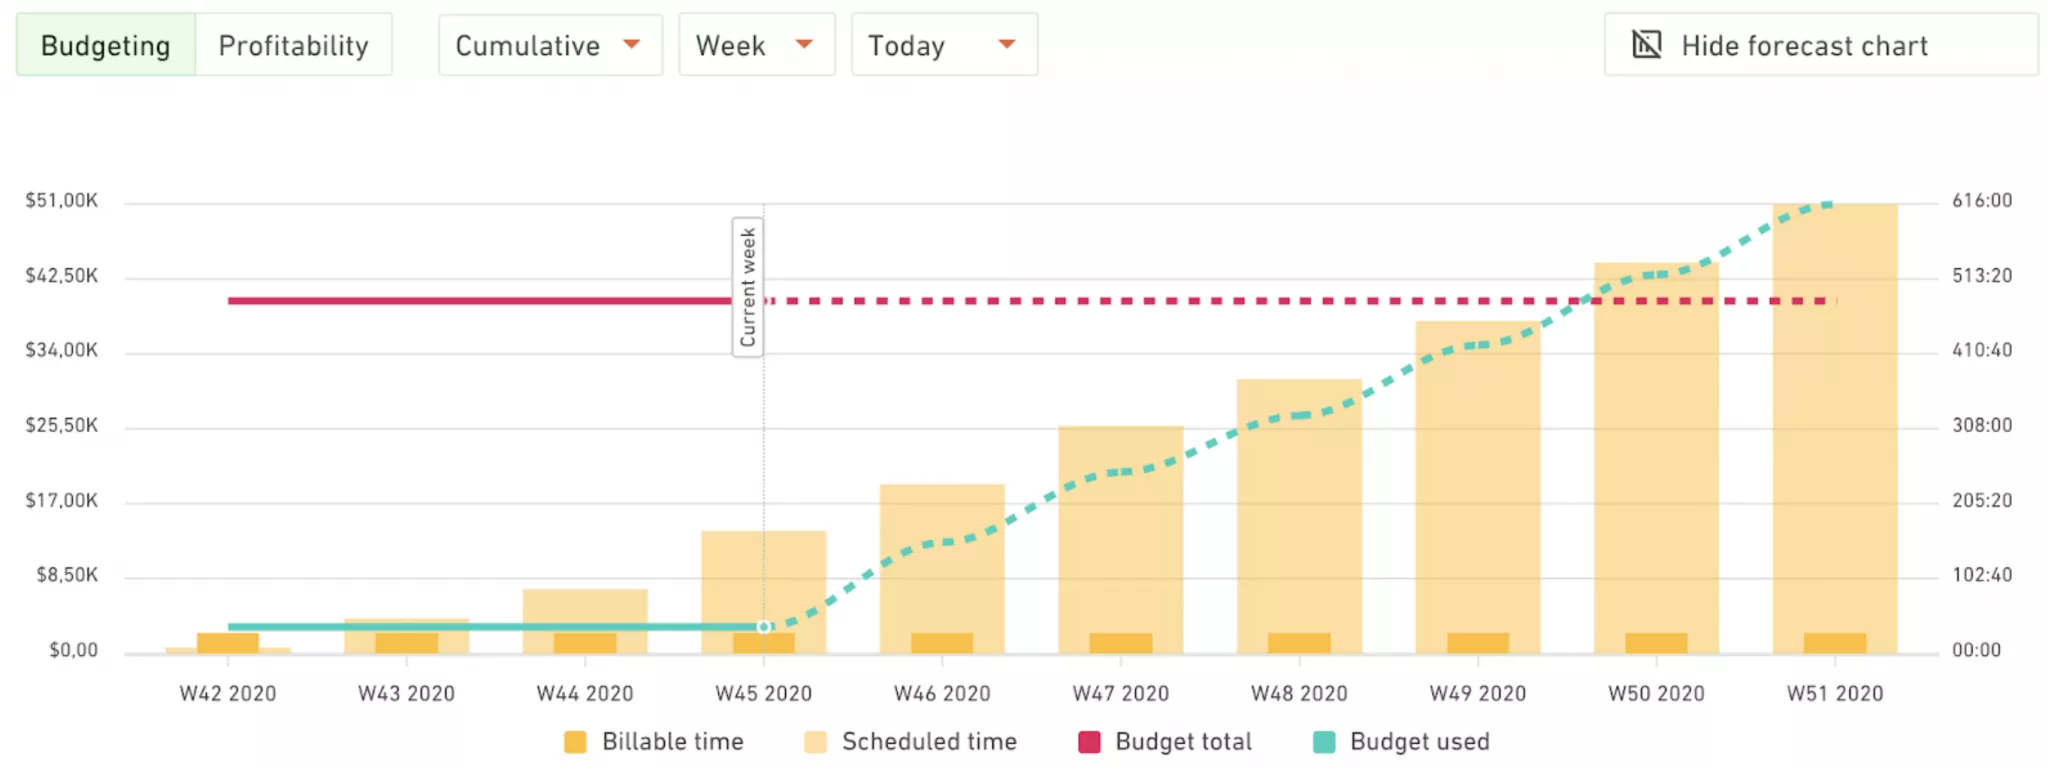
Let’s explain what’s happening here:
We’re currently in Week 45, so everything to the right of Week 40 is going to be the future (indicated by dashes instead of a solid line)
The future is based on your scheduled time
The project is set at a fixed price, so we have a horizontal, red line that shows the total fixed budget (USD 40.000,00)
The turquoise line that keeps growing with each passing week shows projected budget spend based on the scheduled time
Based on the provided information, we can instantly see that if things go according to our plan, we will have spent the whole budget by Week 50
You can even take a glimpse of the future by clicking directly on Week 50. See below:
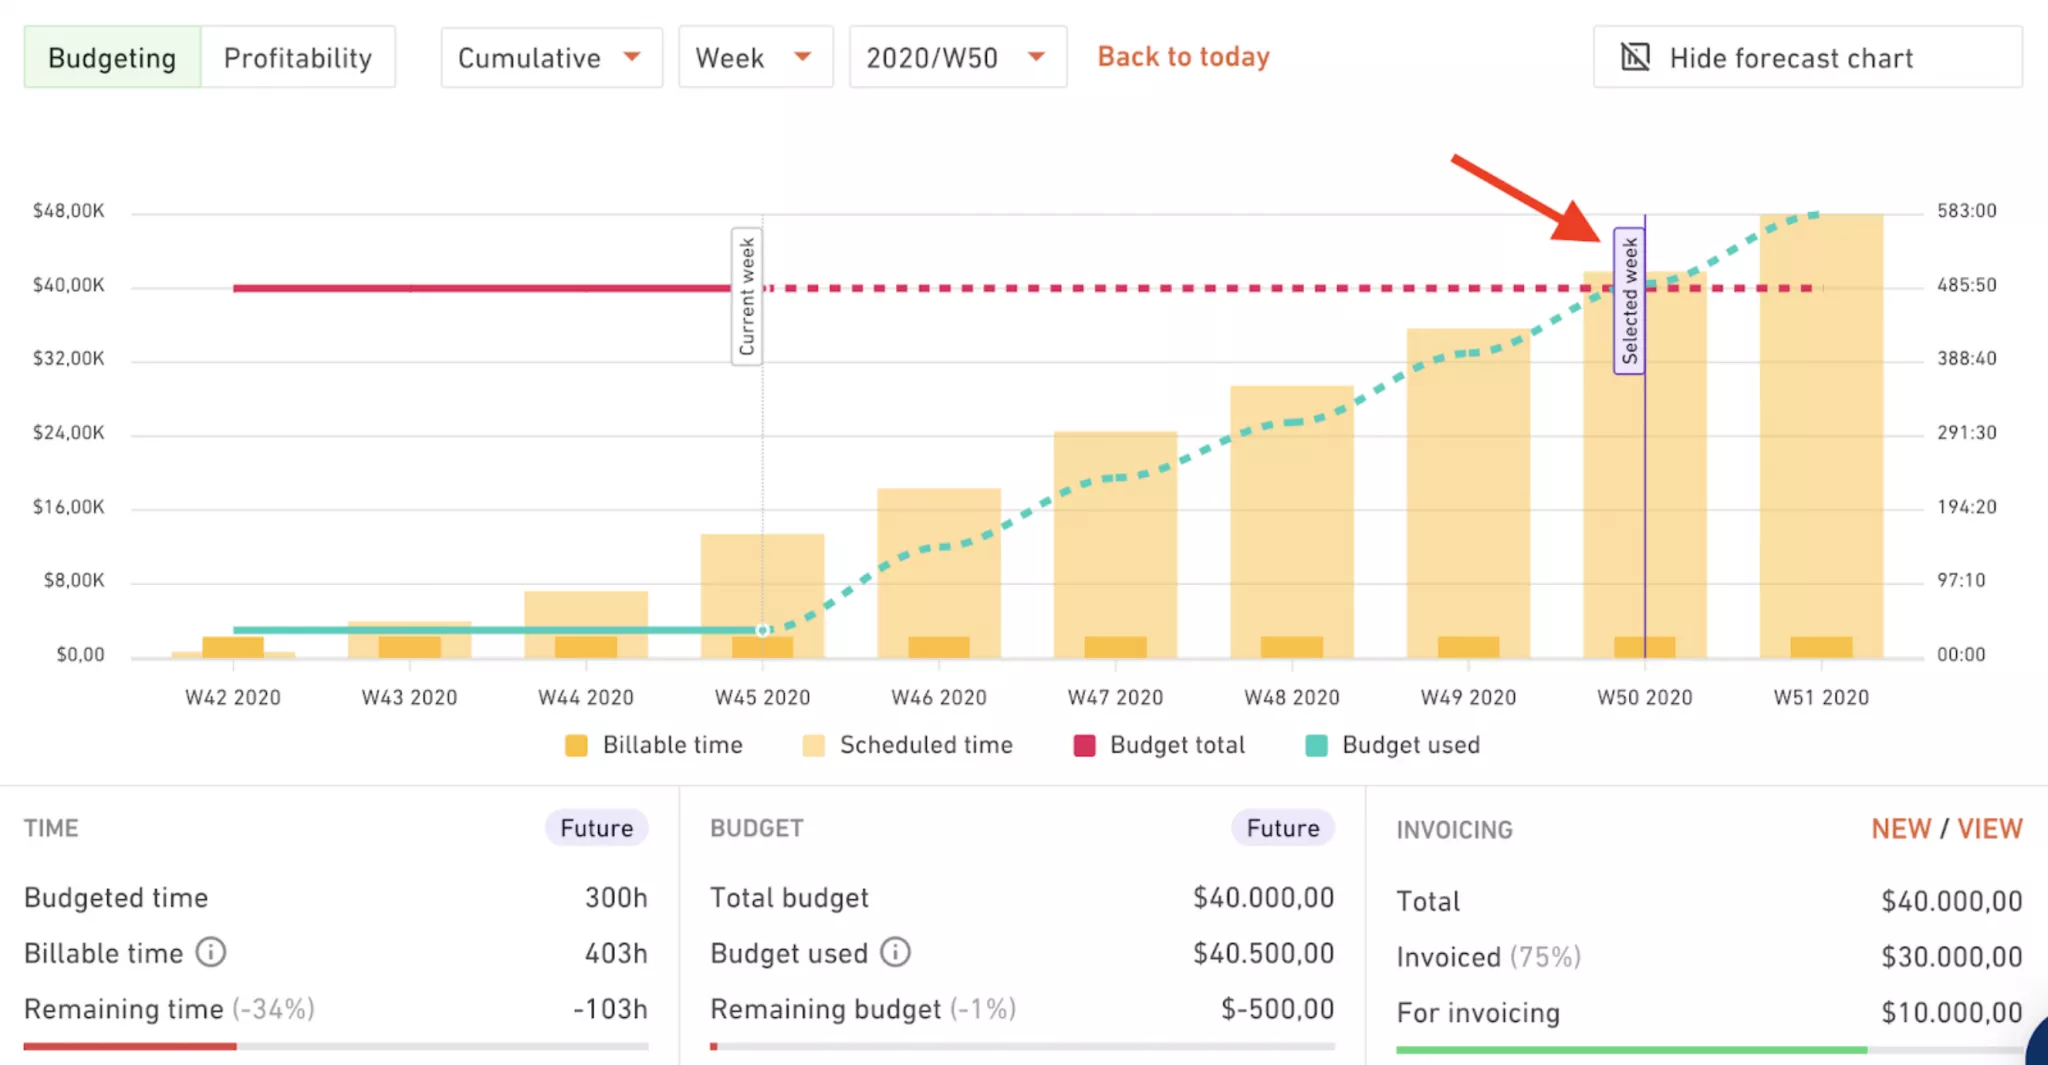
This allows you to see the status of your Time and Budget in the future. Based on the current plan, we will go 16 hours or $750 over the initial budget. Sounds like trouble, doesn’t it? Not really.
Switch the chart to the Profitability view to stop panicking. Let’s take a look at the profit in Week 50:
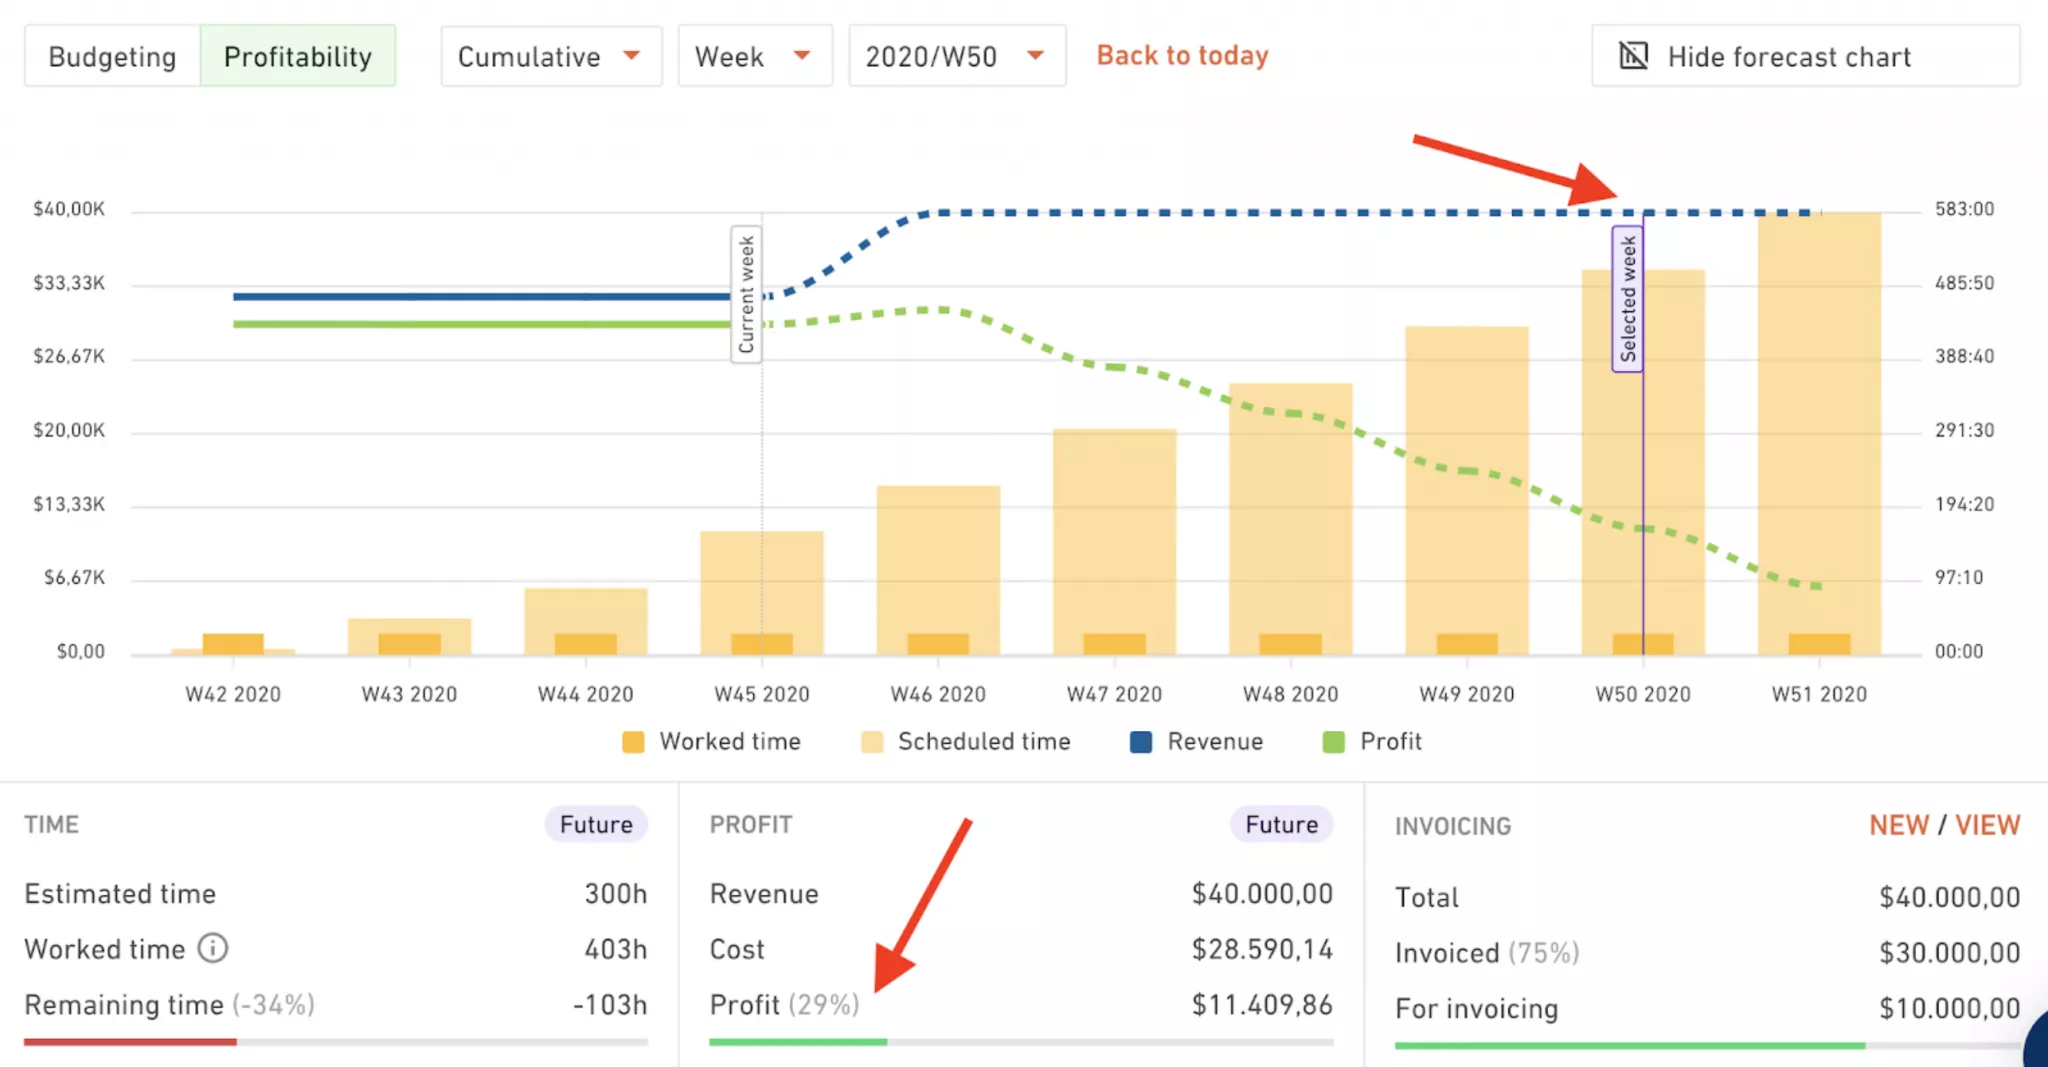
As you can see, even though we burned the entire budget, we still have 29% of the profit margin left. So we can afford to go over the budget even more and still make money. As long as the client is happy, right?
Patric Osburn
Service Operations Manager,
Quintica
Forecasting Charts have assisted our organization significantly. The way you can see in a glance that your team is allocated (Scheduled), to how much of the budget you have remaining or to see whether the budget has been invoiced, is obviously extremely insightful. I use the forecasting charts on a daily basis to ensure that my company is on track with all projects that are being delivered. The ability to forecast margin has also placed us in a position to better manage cash flow and provides key input into our project bonus scheme.
We’ve Revamped the Budget Overview
We’ve also made it much easier for you to understand the status of each individual budget. For starters, the Budgeting and Profitability information have now been separated. You can switch between both views to independently see a project’s health.
Click on either of the two buttons named “Budgeting” and “Profitability” in the upper left corner to switch between views.
1. When in the Budgeting View
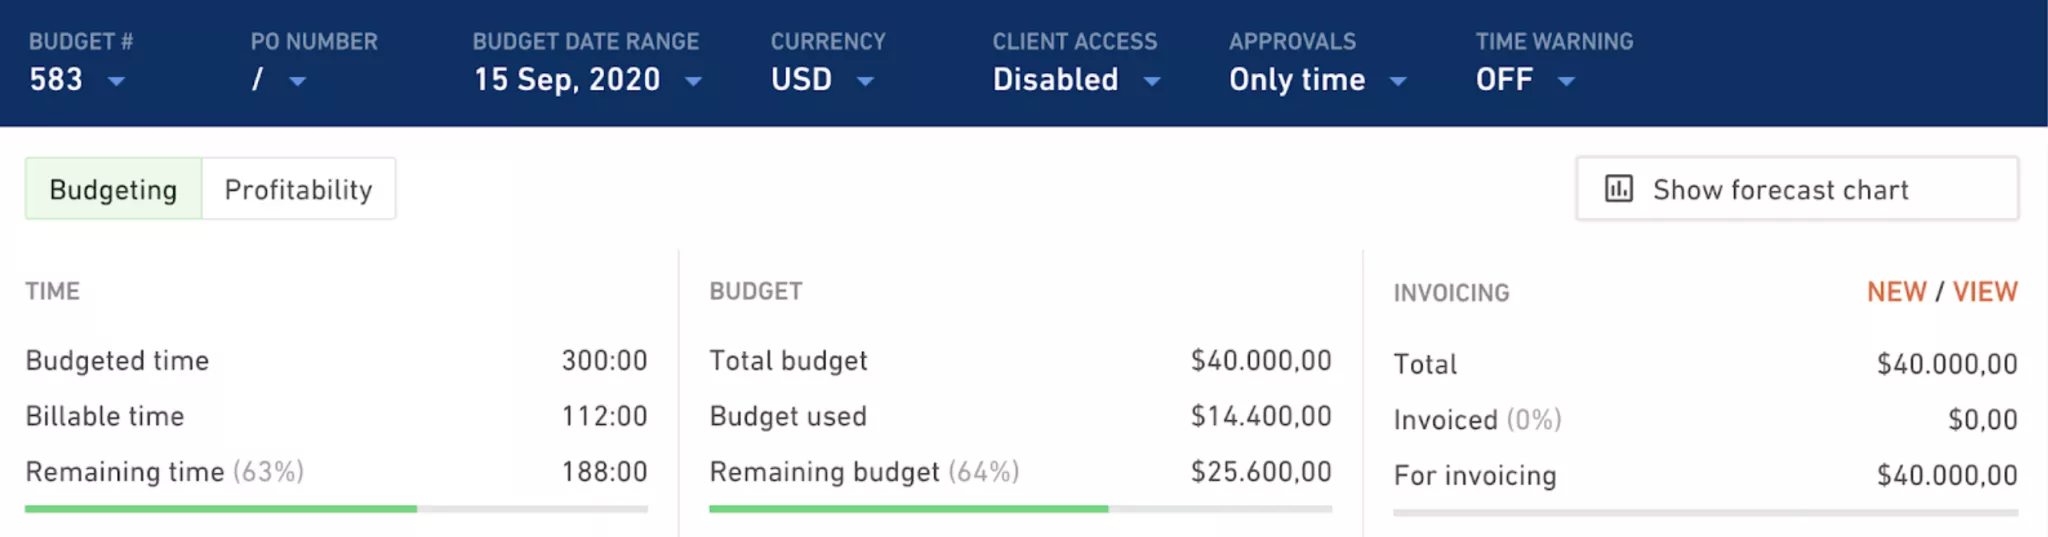
Visually speaking, the displayed information has been tidied up a lot. We’ve split the segments into:
Time
Budget
Invoicing
In Time, we display an aggregation of the estimated time from services in the budget. As teammates track time, you’ll see how the remaining time (as well as the progress bar) is being spent.
Within Budgets, you can see the total, aggregated budget from all your services. As teammates track time, they will spend the budget based on the billable rate of each service.
Finally, Invoicing has remained pretty much the same. It shows the total amount you need to invoice and how much is still left to invoice. Useful, right?
2. When in the Profitability View
Flip the switch at the top to take a look at the profitability of the Budget:
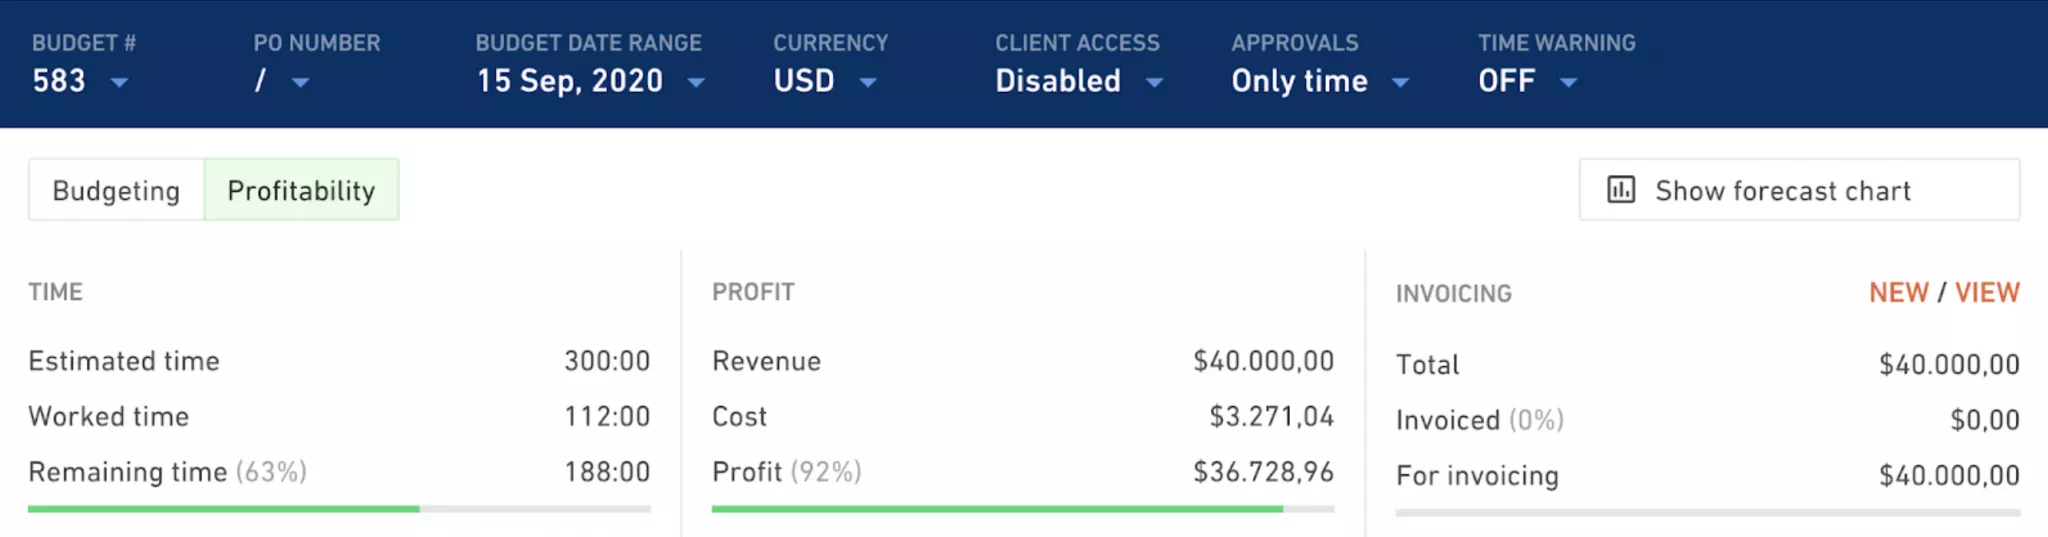
As you can see, the Time and Invoicing segments have remained the same, but the Budget segment has been replaced with a Profit segment. As people track time, they will incur costs based on their internal cost rate. If you’re using the overhead cost addon, the hourly overhead will be added on top of employee cost rates.
This means that with each new time entry, the profit of the project will diminish. Having that overview is going to be priceless when it comes to understanding how the project is performing.
How Can Forecasting Charts and Budget Overview Updates Help You?
The impact of these improvements is enormous because, let’s face it: your clients really, really care about the budgets they’ve given you. And so do you. Now our Forecasting charts are much more detailed, visually appealing, and easier to digest at a glance. As a project manager, you have a micro and macro view so you can know what exactly to communicate with your customers. This information is going to be priceless when it comes to understanding not only how any of your projects are performing today, but what you can expect from them down the line.
Need More Tips on Using Forecasting and Budget Overviews?


