How To Organize Projects by Business Line

We Help Your Agency Reach New Heights
Switch from multiple tools and spreadsheets to one scalable agency management system.
Most companies have divided their talent into different business lines, also called departments, based on their skills and specialities.
Often, when agency project managers or Management is analyzing data about their company, they want to dig deeper and compare it between departments. That gives insight into where they differentiate and what they could potentially improve in.
First of all, you should define your business lines in custom fields so you can later on segment data based on which business line it belongs to. We’ll use an example of a company that has three different business lines:
Mobile app development
Web development
and Product design.
Here are some possible use cases for what you can compare.
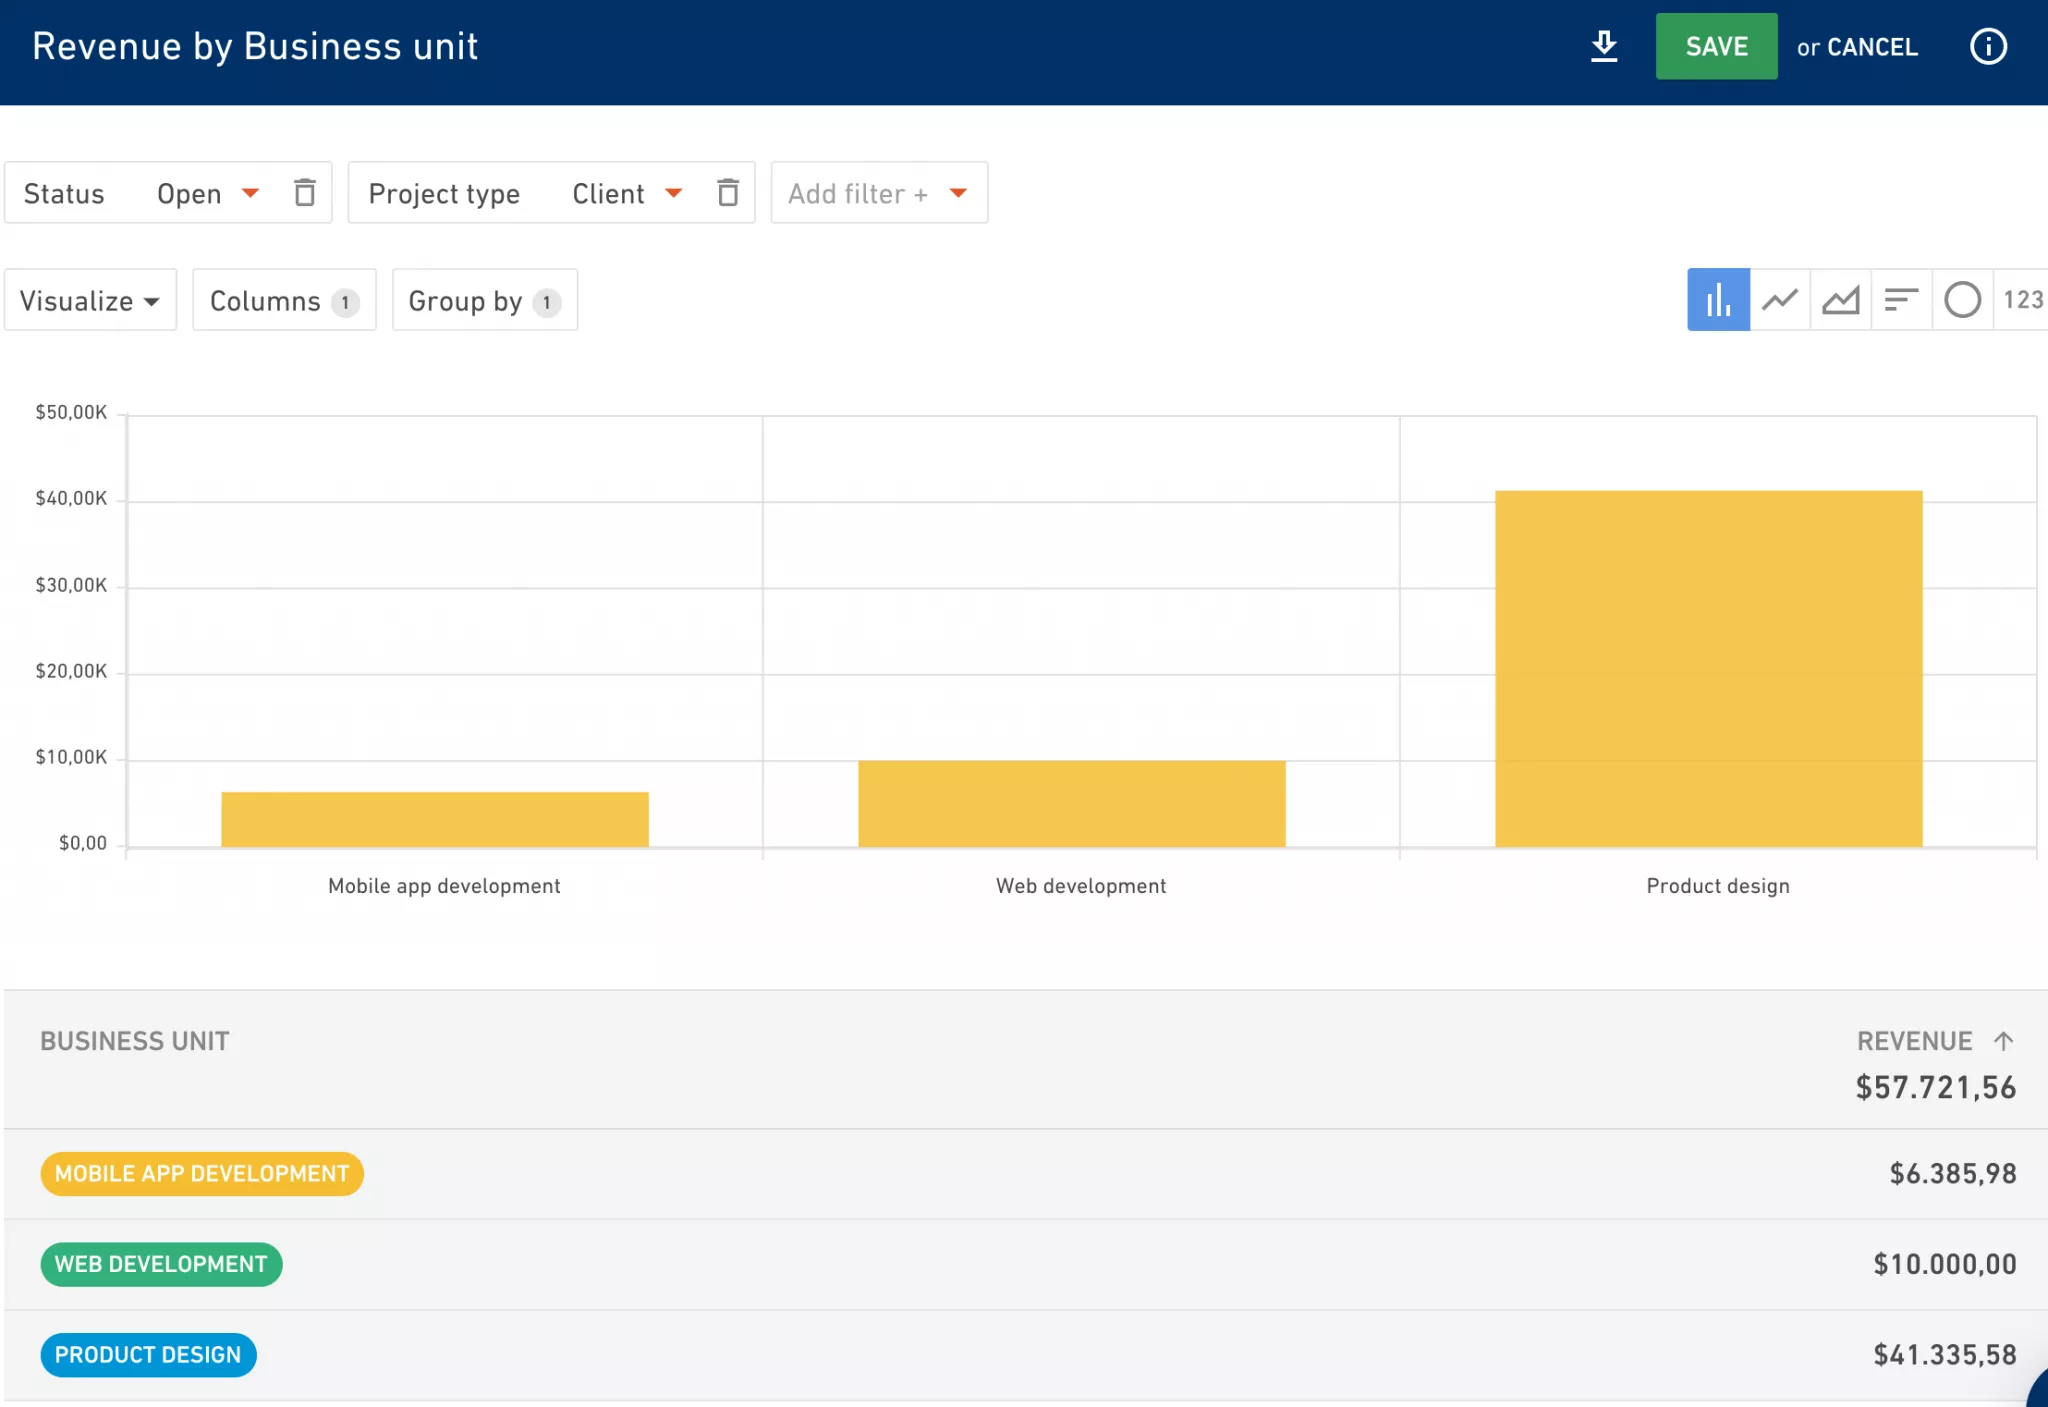
Revenue per business unit
Naturally, one of the things most companies want to look into first is which business unit is bringing in the most revenue? That’s one of the key benchmarks when comparing what part of the business is performing best and has the biggest impact on your success. You can easily sort your business units in Productive by using a combination of custom fields and reports.
Profitability by business unit
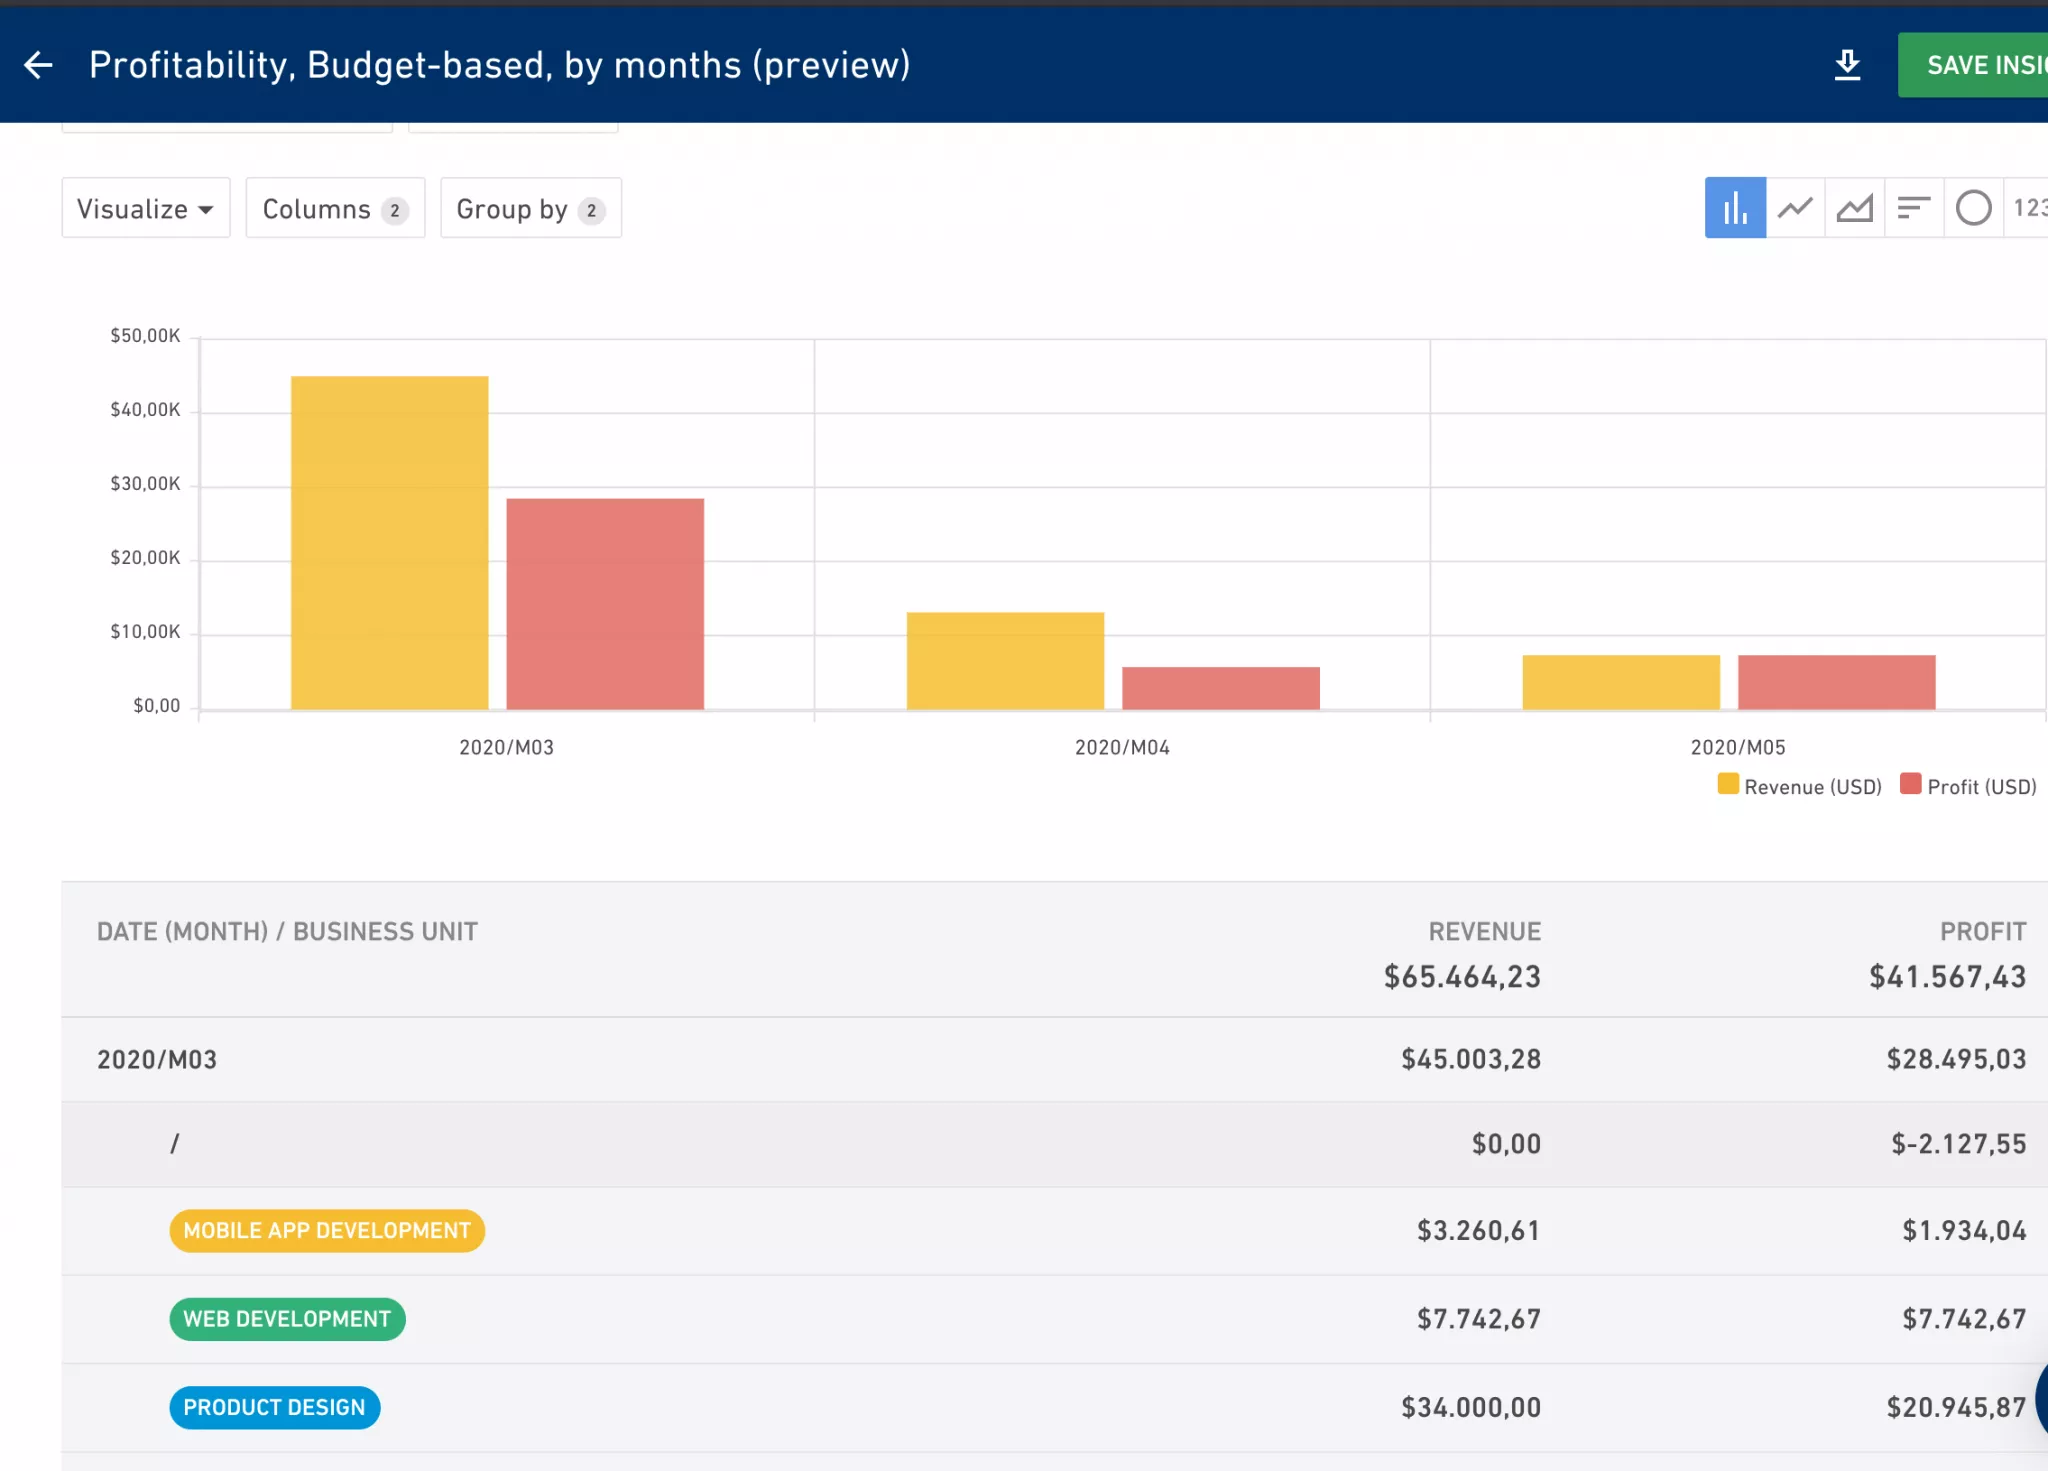
If a certain business unit is bringing in more revenue than others, it doesn’t mean it’s playing a key role in your company’s profitability. High revenue might deceive you and those types of projects often include lots of overservice which gives extra value to clients but ultimately drains your profit.
That’s why it’s important to compare the revenue every business unit has brought in together with the internal cost you’ve invested to deliver that service. You might be surprised by the final result.
Utilization by business unit
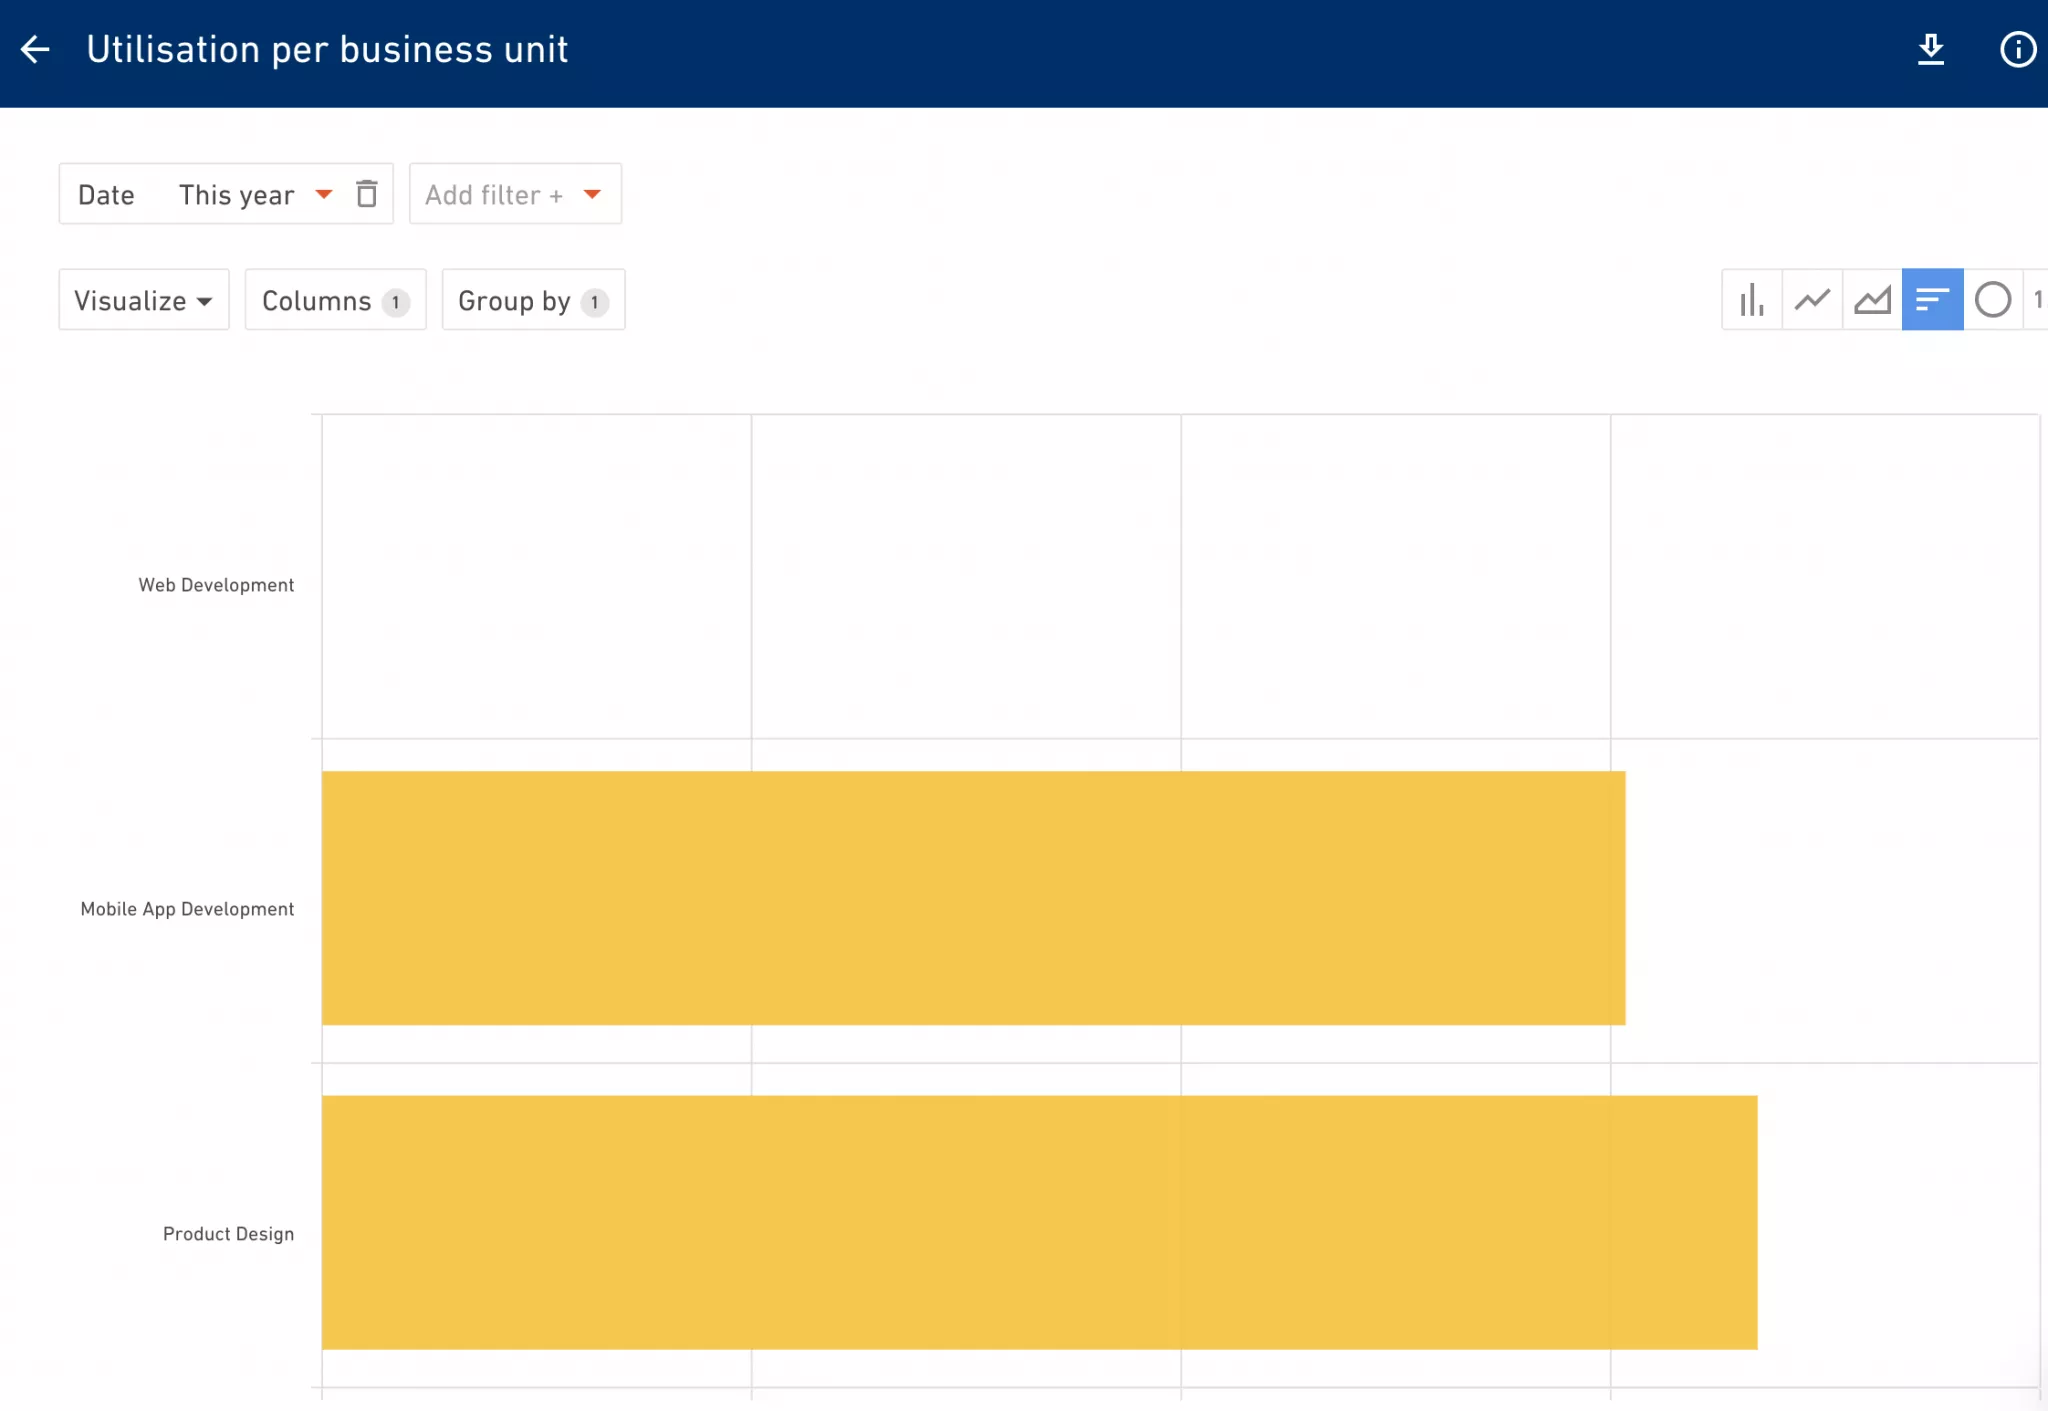
Utilization is one of the key features of any agency. It shows you how well you’re using your resources to generate revenue for the company.
Comparing utilization per business unit will surely help you compare the efficiency and tell you which unit is contributing most to revenue.
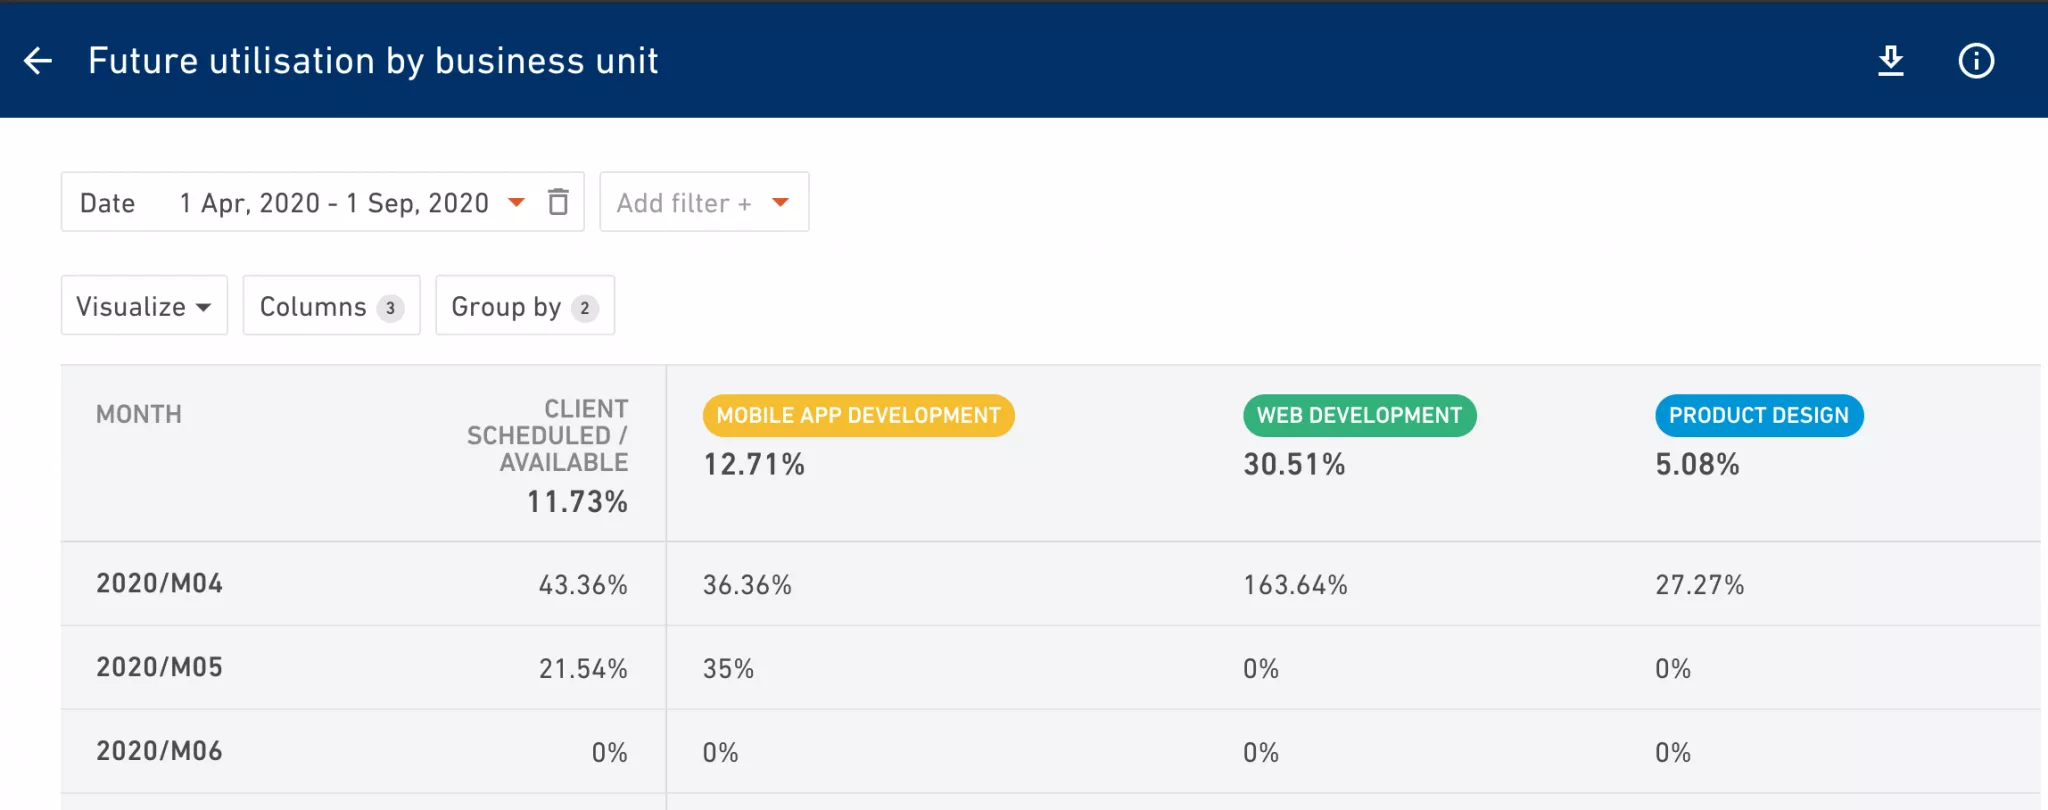
Do you want to see how busy every business unit will be in the future? You can use the hours you’ve already assigned to your team on future projects to predict how utilized they will be. Based on resourced hours, you can predict the utilization of future months. A tip is to use this data to align your sales and operations- if you spot that a certain unit will have available time in ex. May, try pushing new work for that month.
Estimates per business unit
For some business units, depending on the nature of their work it’s harder or easier to estimate the time and effort required to deliver the project. That’s where the data comes in to help you.
At the beginning of a project, you can set an internal estimate for every service you’ve sold. If you’ve undersold something or added a buffer in the budget, use the estimate as an orientation. An estimate is telling you how much time (realistically) you need to deliver that service.
Once the project kicks in and work gets done, you can compare estimates and actuals. After some time, you will see which units are more/less accurate with their estimates so you can improve.
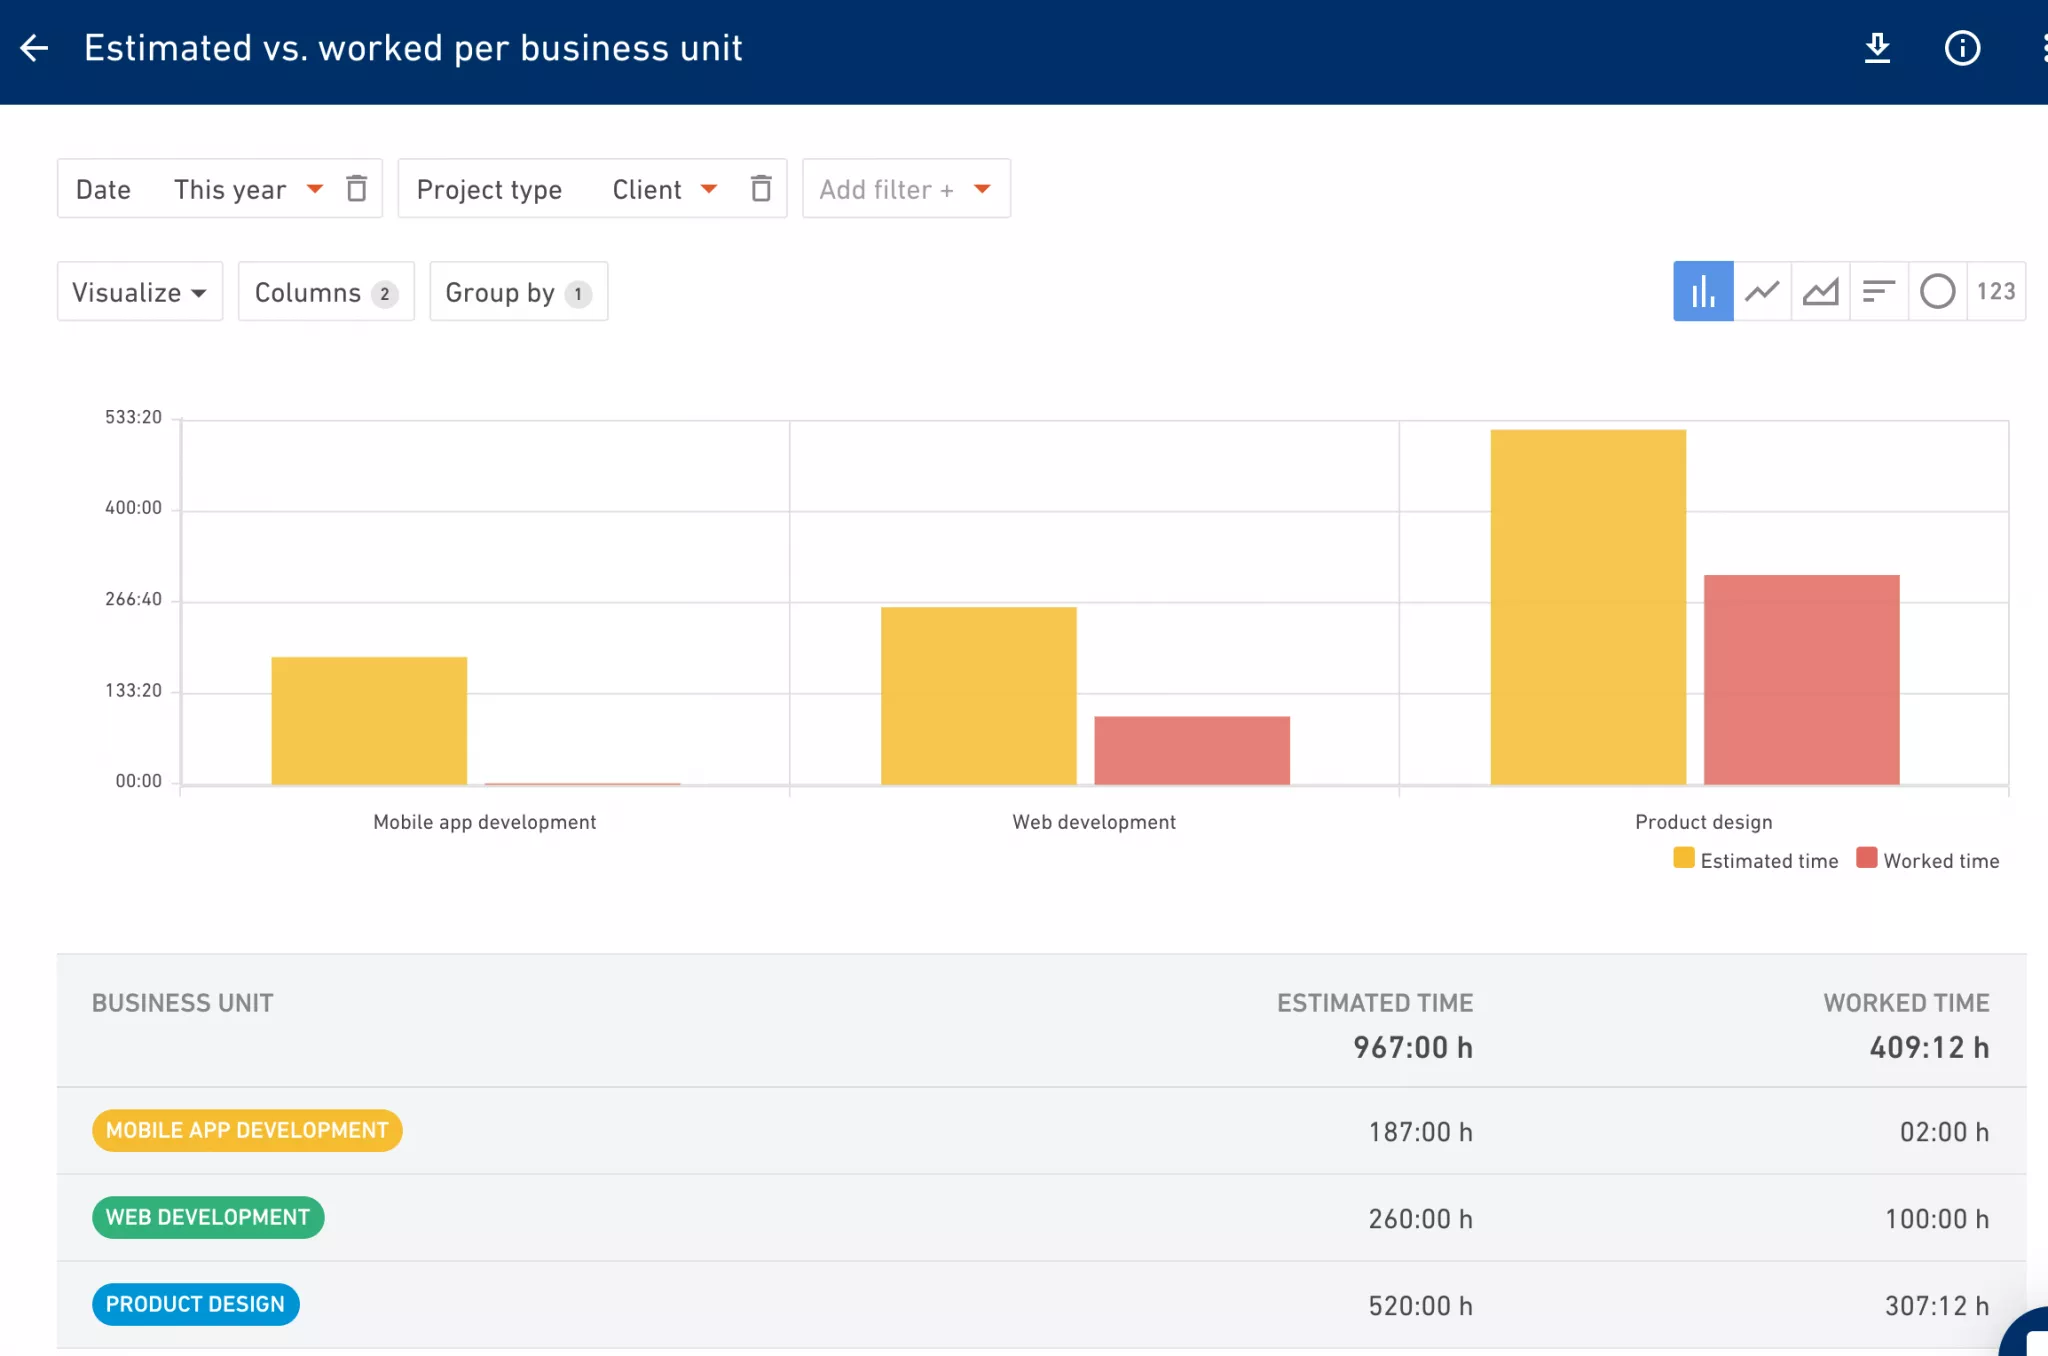
All of these powerful and very visual reports were custom made using a combination of custom fields and Reports, our brand new feature explained here.
The possibilities for customising the data just the way you want it are countless. If you need inspiration, guidance or help with setting up, our team will be happy to assist you.


