How To Group Clients By Industry

We Help Your Agency Reach New Heights
Switch from multiple tools and spreadsheets to one scalable agency management system.
If you’ve been in the business for some time now, chances are that you’ve focused on certain industries, or niches.
We’re talking about the areas in which you know you serve your clients best, where your agency shines.
And it’s no wonder. This path has shown to be a steady growth method for many agencies. Focusing on certain industries enables you to gain expertise in those fields and helps you refine your sales techniques. Consequently, your agency becomes an expert in the industries where your current (and hopefully future) clients are coming from.
If your business operates in a similar way, and your customers come from different industries, you might want to consider that when you’re analyzing the data of your projects.
Example of grouping clients by industry in Productive
Grouping clients by industry allows a company to dig deeper when they’re doing overall reporting on their business and analyzing the success of their projects.
This business, for example, is working with clients in three different business lines, Telecom, Finance and Media:
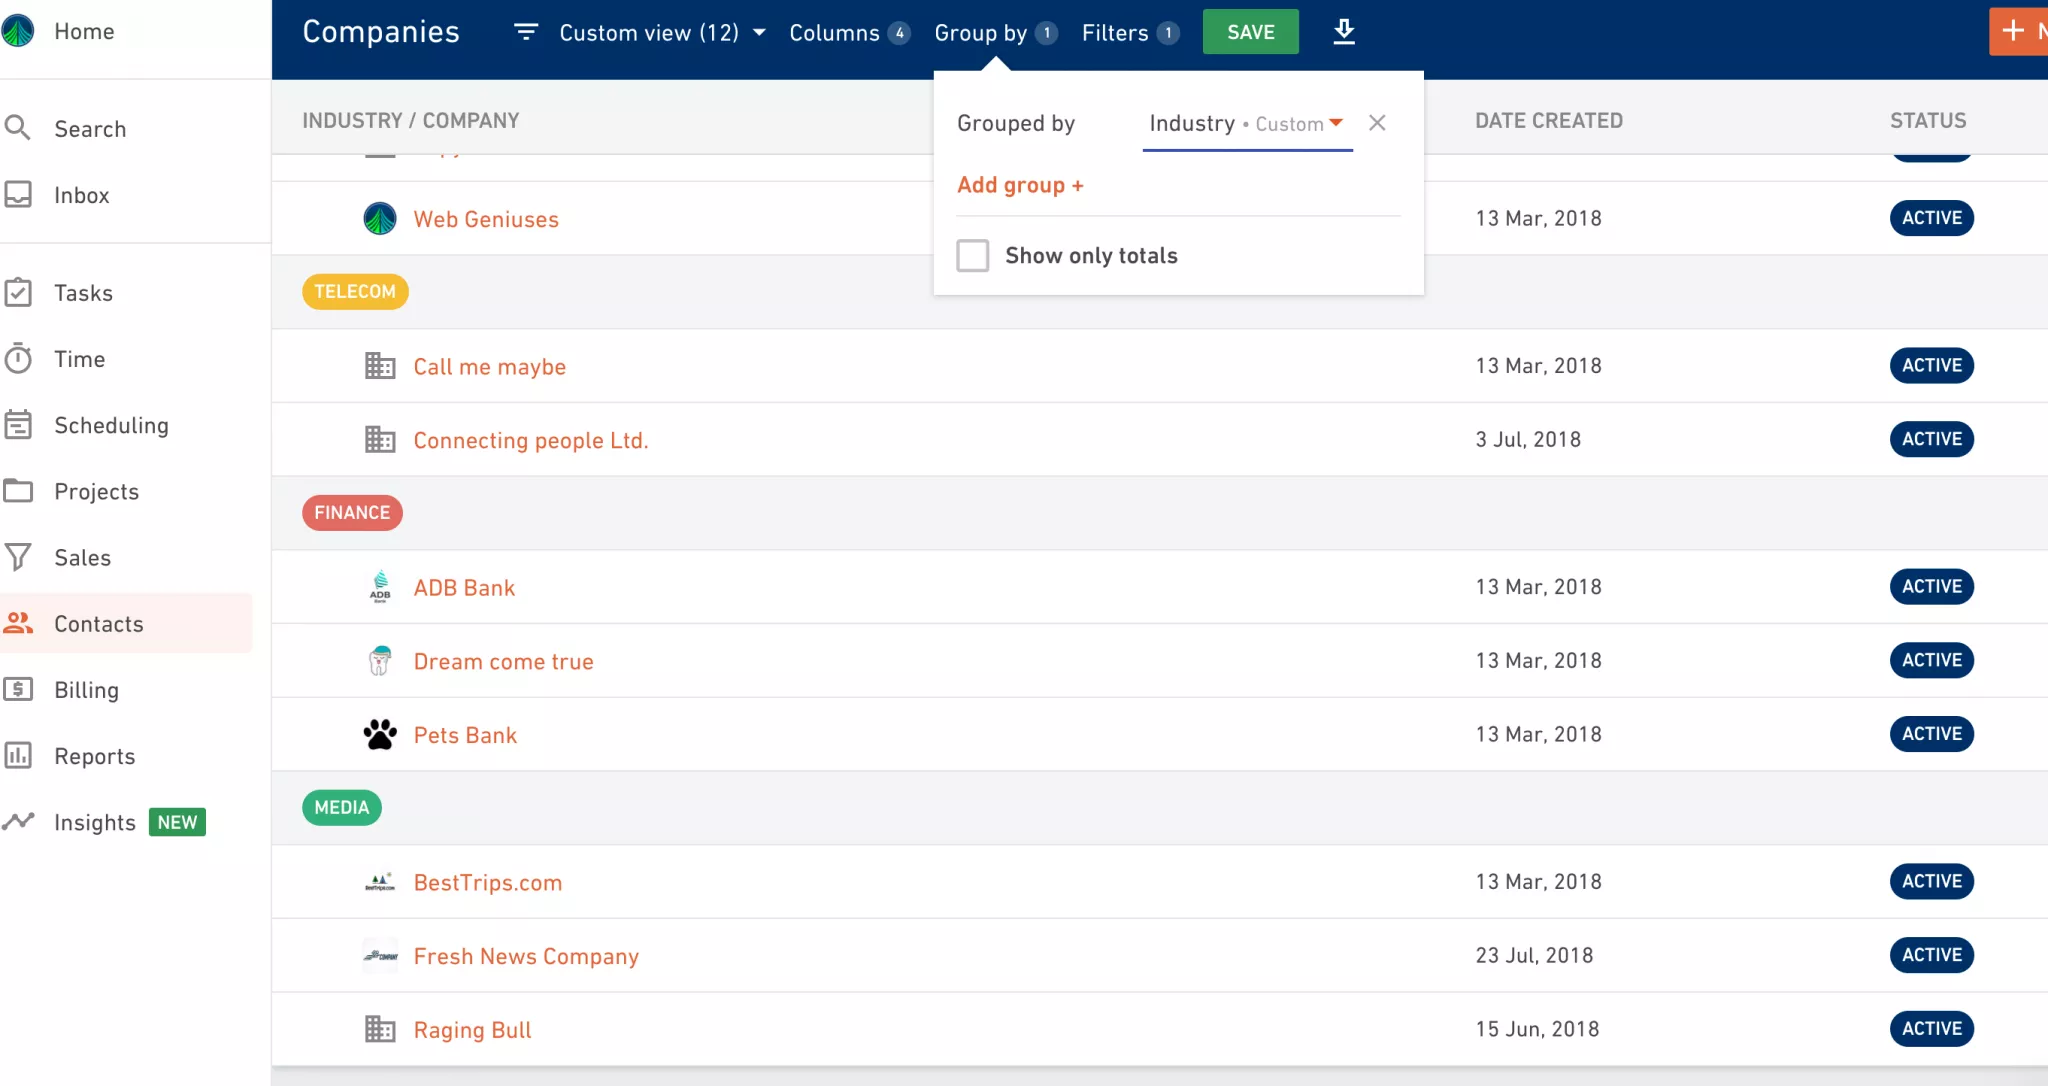
Let’s say you’re doing a rearview mirror perspective on where most of your revenue came from in the last quarter, or year. Grouping a budgets insight by the business line custom field can get you that information with a single click:
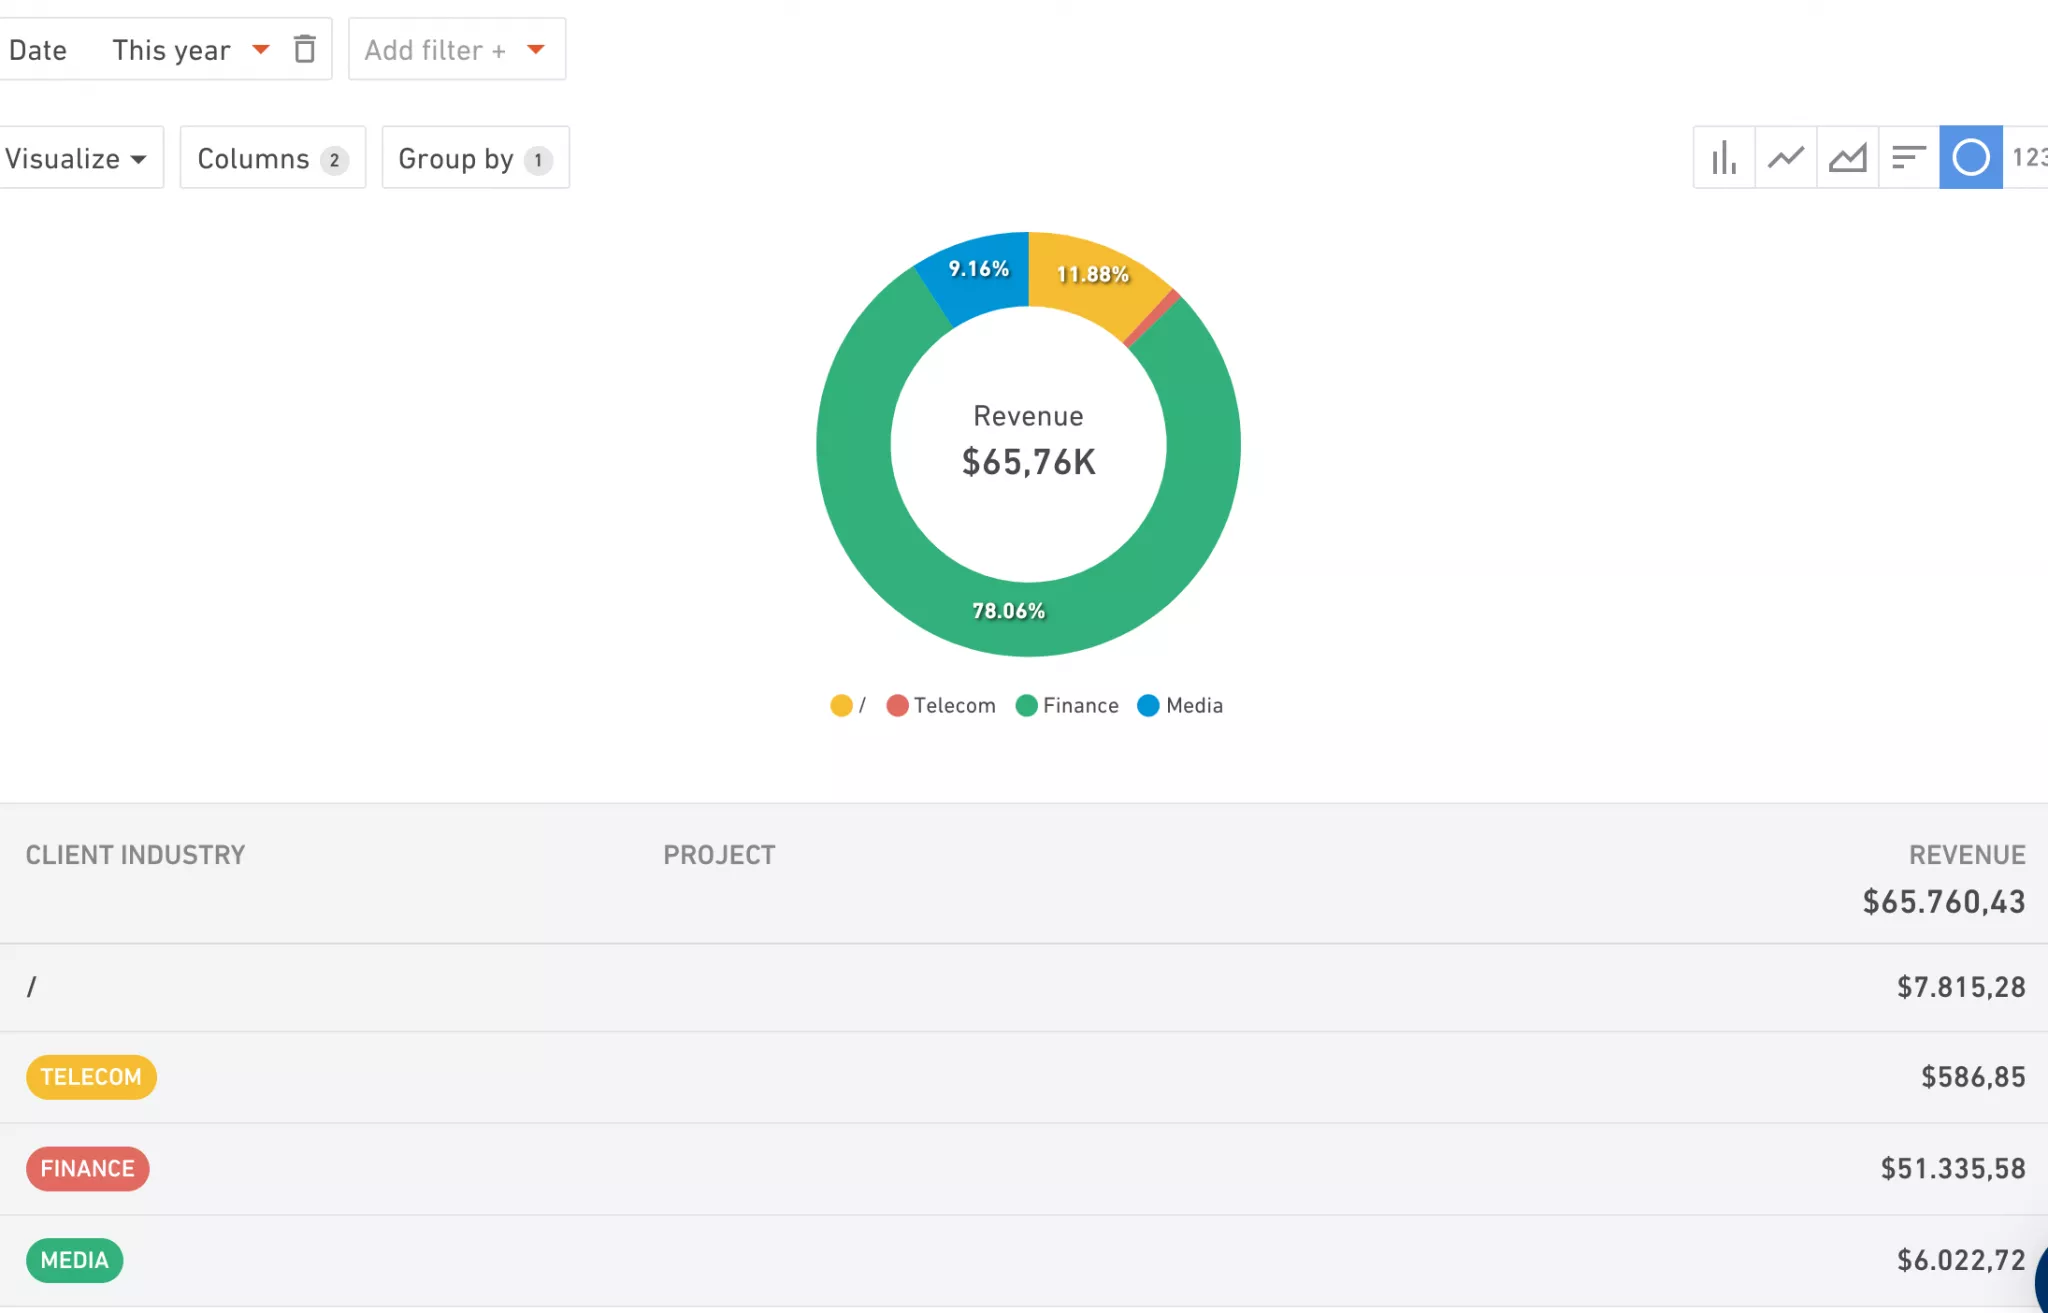
You can now easily see what’s bringing in the most revenue and which industries you should focus your sales activities on more.
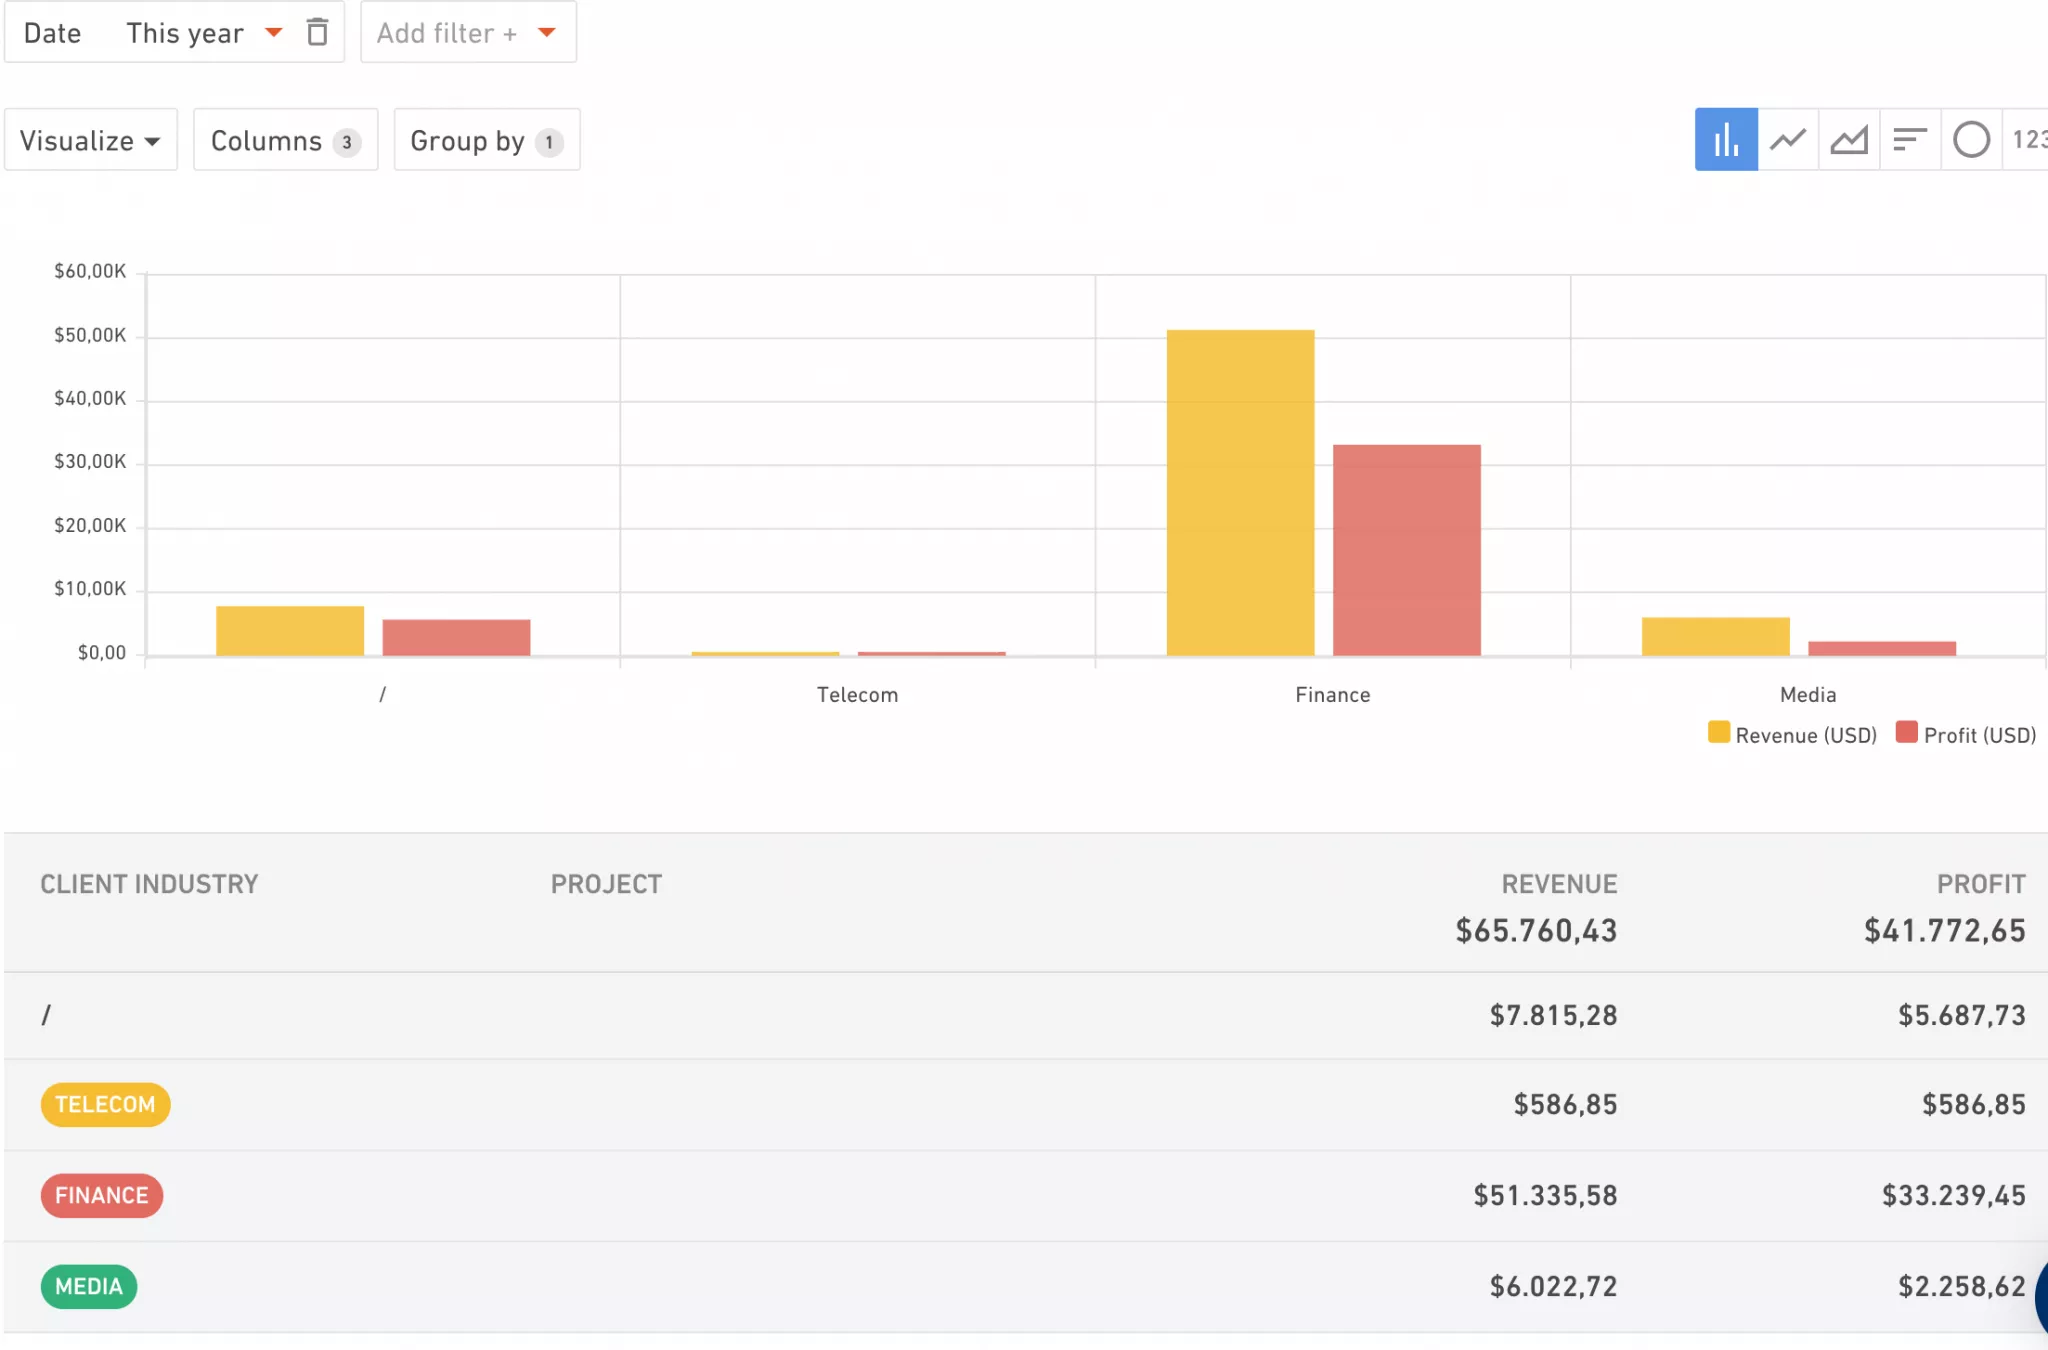
Don’t forget that revenue does not equal profit. In fact, fixating on revenue might be deceiving. Sometimes, if you over-service your clients, you will ultimately drain the profit of your projects and your business as a whole.
That’s why it’s important to analyze the profit you’ve made in different industries—the results might differ.
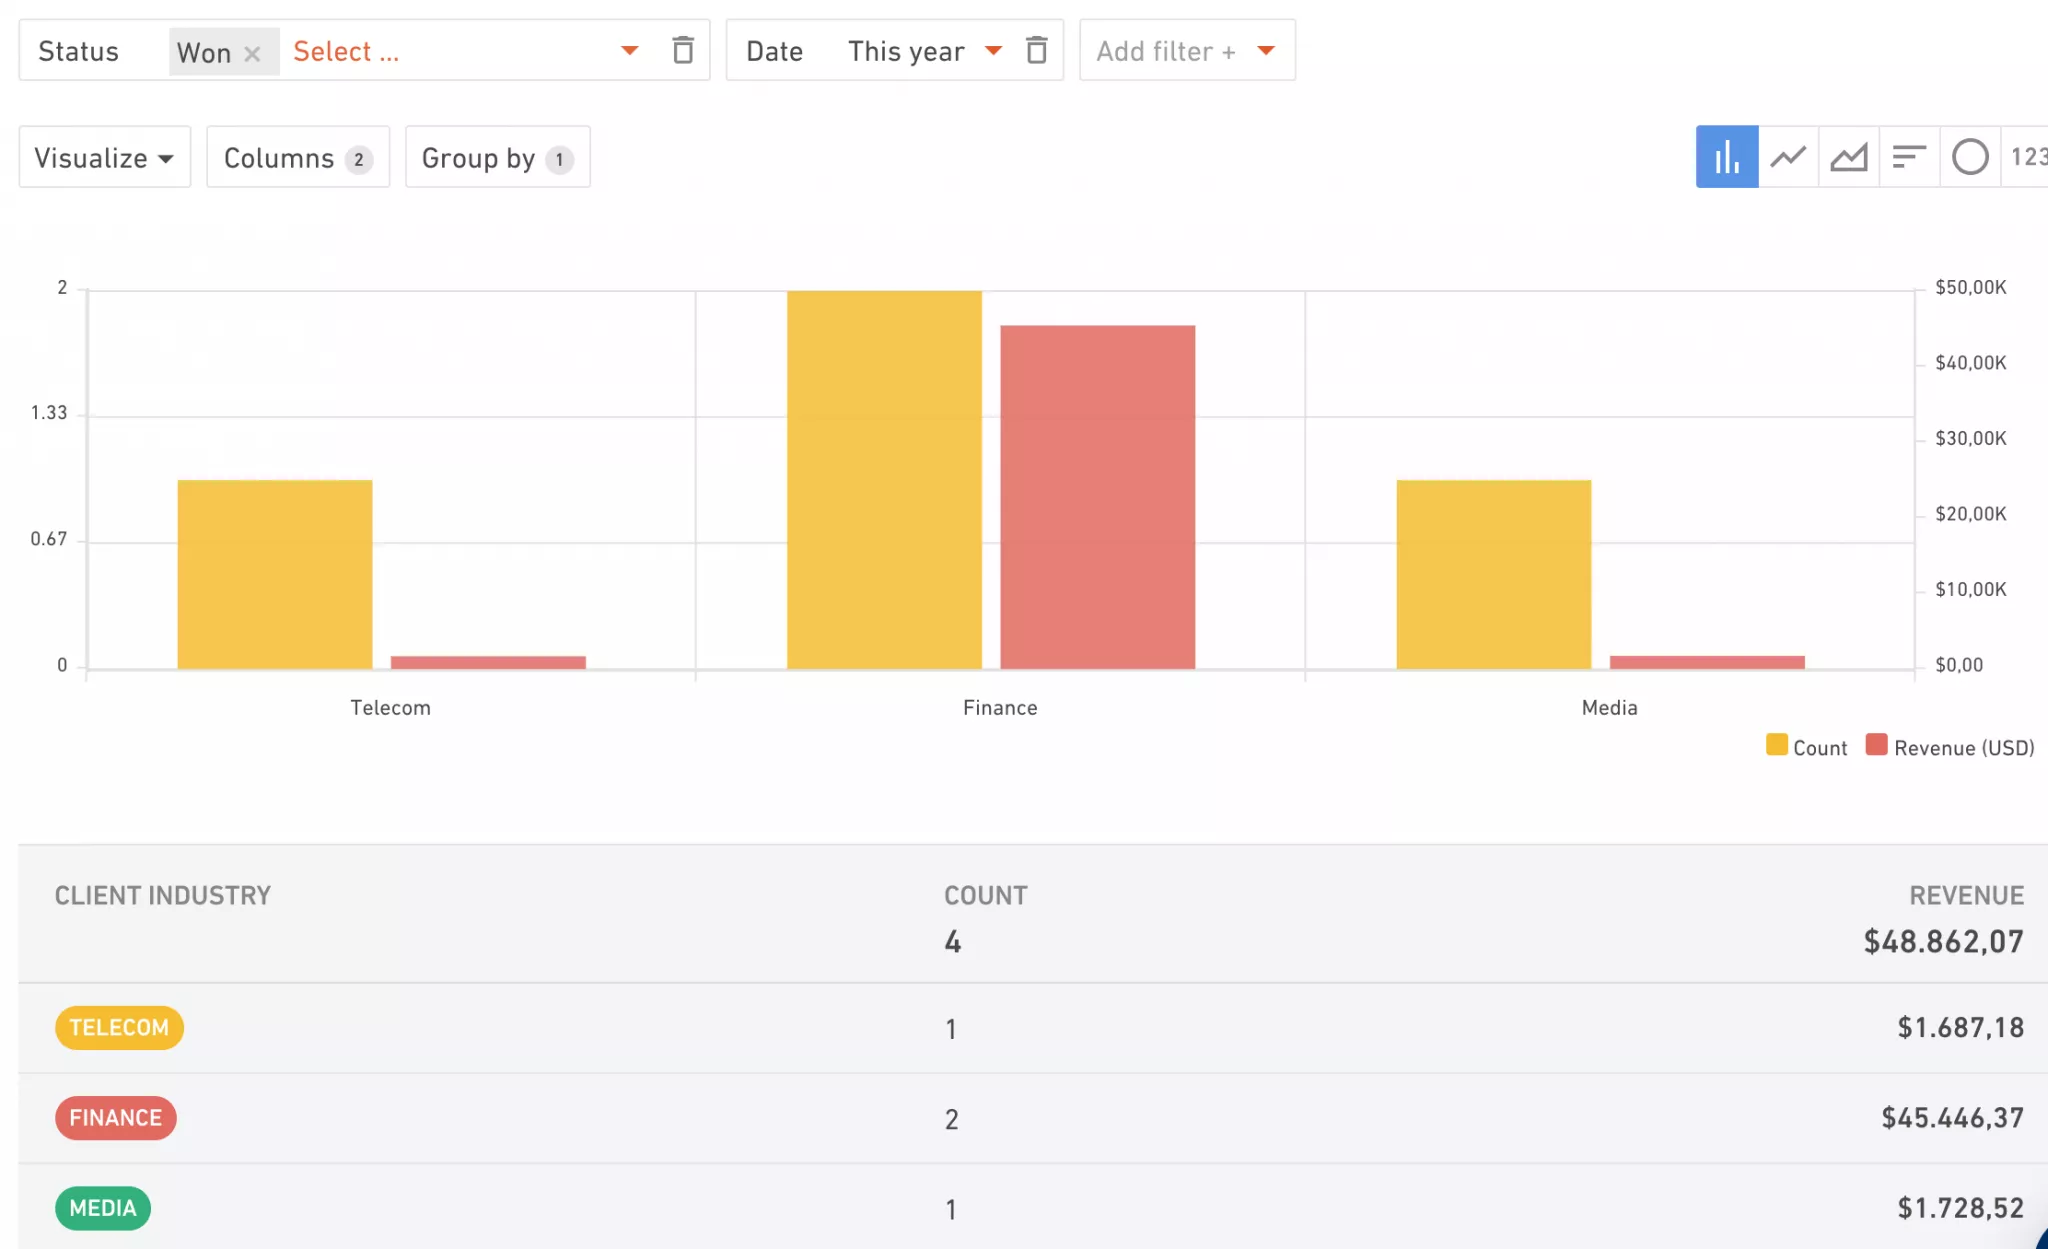
Speaking of sales, would you like to know which deals you’re more likely to win?
How to see which industry is bringing you the most revenue
Using custom fields in Productive, you can see which industries you’ve won the most deals in and how much revenue you’ve generated through those sales activities.
When you have the option of whipping up retrospective reports to show you how your business performed, you can use them to spot patterns and draw conclusions on what you can expect in the future. Still, those may be just assumptions, and you probably want to base your decisions on actual data.
Luckily, with forecasting, you can create a custom projection on where most of your revenue will come from in the future.
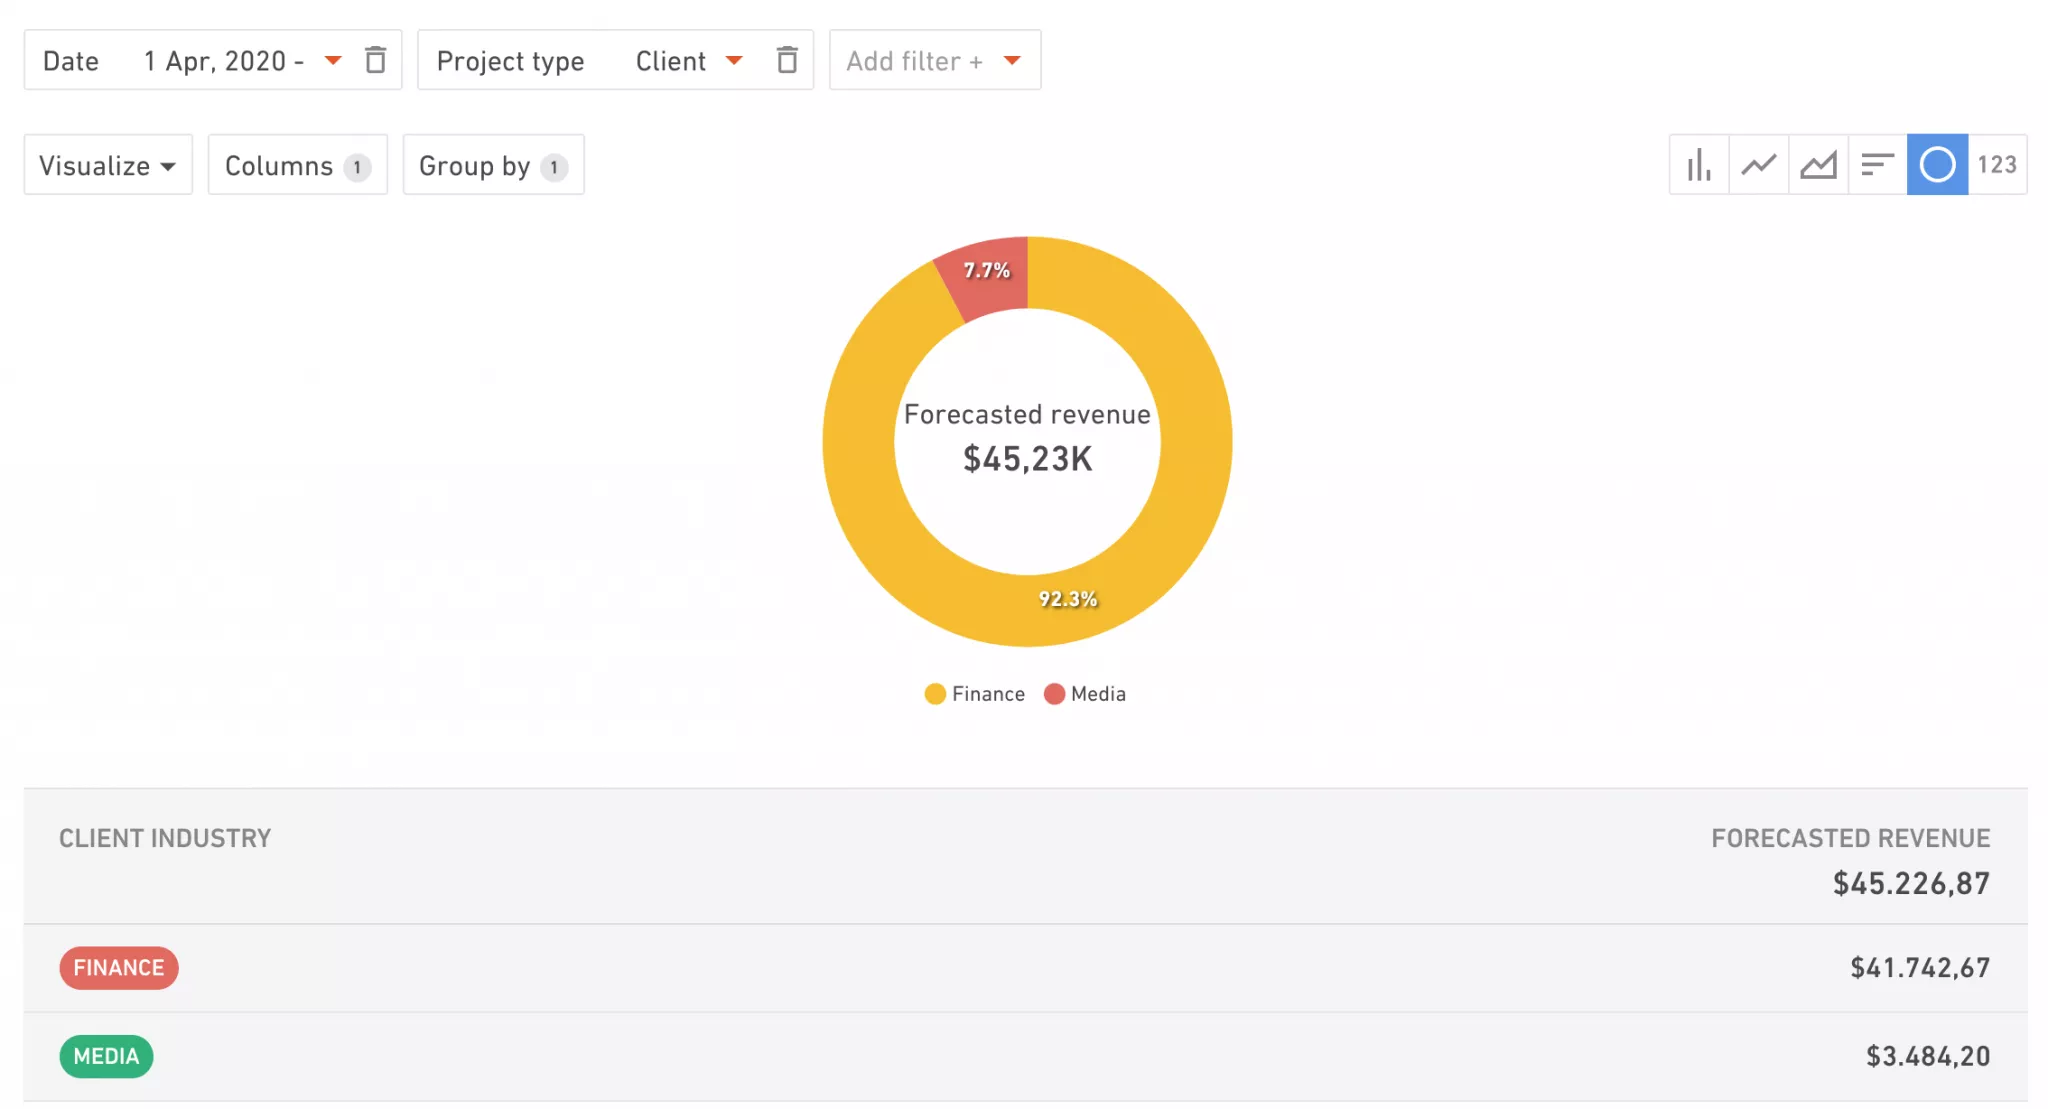
All of these powerful, visual reports were tailor-made using a combination of custom fields and Insights, our brand new feature explained here.
The possibilities for customizing data just the way you want to see it are endless. If you need inspiration, guidance, or help with setting up your custom fields, our team would be happy to assist you.


